BTC Price Analysis as Whale Alerts Indicate More Institutions Buying Bitcoin

As Bitcoin soared to a new all-time high of $57,808 on the weekend, over a billion dollars’ worth of BTC has left Coinbase to unknown wallets in the subsequent days—an indication that more institutions should be announcing their entry into crypto in the near future.

Bitcoin’s price is now hovering around the $57,000 price level and according to whale alert 36 separate transactions have been made today—valued at between 351 and 391 Bitcoins—from Coinbase exchange to unknown wallets. The transactions which all took place between 4 and 5 pm UTC are valued at over $750 million in BTC and added up to 13,204 Bitcoins.
Last night, Whale Alert also tweeted that 4,501 BTC had left Coinbase for an unknown wallet. The transactions of today and yesterday mean that over a billion dollar’s worth of crypto has left Coinbase in the past 24 hours. Although it’s not known whether the transactions are related, the movement of the mass amount of Bitcoin most likely indicates another major institution is preparing to enter the cryptocurrency space.
As more institutions flock to Bitcoin—institutional investors and speculators trading large quantities of BTC have been taking on a new method to hide the real sizes of their trades—to cut the risk of exposing their intent to the market, be they bullish or bearish, which could cause them unfavorable price moves.
The transfers could also be indicative of an over-the-counter desk reshuffling its wallets, a Bitcoin not-quite-billionaire moving cash to cold storage, or even a money-laundering scheme. It’s difficult to tell for certain at this stage as the transfer generated a new address for each transaction to protect the transferer’s privacy.
Bitcoin’s dramatic price rise over the last three months has been mainly attributed to big-time institutional investors such as MassMutual, Grayscale, Square, and MicroStrategy backing the cryptocurrency. With the increased institutional adoption of Bitcoin, the digital asset added over $300 billion to its ever-growing market cap in 2020.
Institutional investment looks set to continue as Bitcoin has breached the $1 trillion dollar market cap. But what can we expect from the BTC price in the short-term?
Bitcoin Price Analysis
With Bitcoin dropping slightly to below the $57,000 mark, what can we expect from the BTC price?
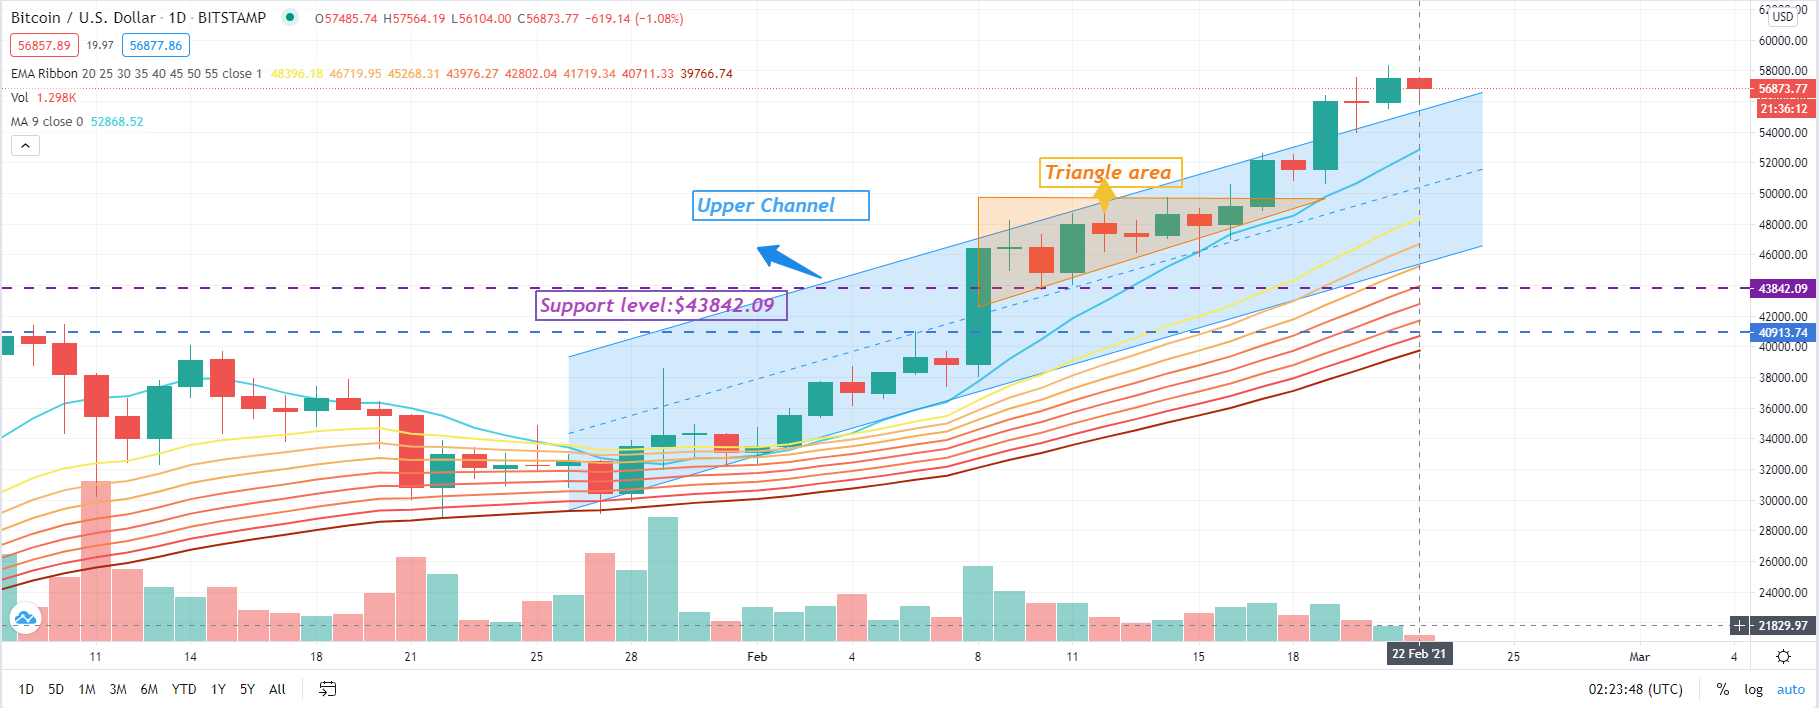
Source: BTC/USD via TradingView
From the daily candlestick chart of the Bitcoin price, it can be seen that the BTC/USD currency formed a long green candlestick on February 17, successfully breaking through the convergence triangle interval we drew before, and the highest price reached $52,640. On February 19th, it successfully broke through the resistance line of the ascending channel with a larger body bar, reaching a maximum of $56,400, and opened a faster-ascending channel.
Although a Doji candlestick pattern was formed on February 20th, the bulls want to stand firmly above the pressure line of the ascending channel line, but the bears want to push the price down into the channel line. The forces of both sides are even, indicating slight uncertainty in the next BTC price move. However, the candlestick on February 21, indicated more buying power and the bulls now appear to have the advantage as they continue to push the BTC price to the next level of $60,000.
In recent days, the candlestick chart has closed above the 9-day Moving Average, while the Moving Average Ribbon continues to rise, which also indicates that investors are still bullish on the market.
Contrary to this assumption, if the bears push the price back into the channel, the first support level will be the 20-day moving average, which is approximately $48,400. If the BTC price falls below this channel, it will indicate that a short-term bear market may soon occur and move to the first support line we drew at about $43,842. If Bitcoin falls further below this level, then the currency pair may be corrected to a 50-day moving average of the day at approximately $40,711.
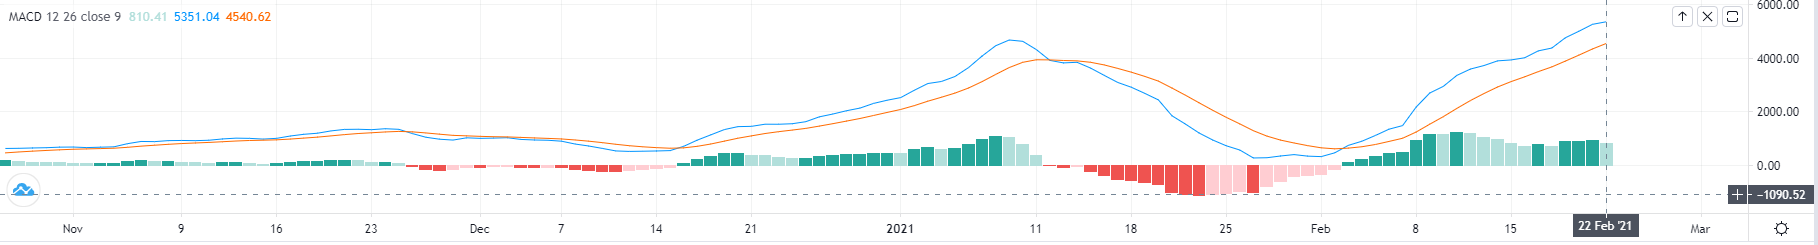
It can be seen from the MACD chart that the MACD line (blue) has begun to turn upstream and has already surpassed the signal line (yellow) with a constantly increasing opening amplitude. This helps confirm the formation of a short-term bull market which could see Bitcoin push for $60,000 in the next few days.
Image source: Shutterstock
Bitcoin’s Parabolic Price Run Pushes the Cryptocurrency's Market Cap Above $1 Trillion