Ethereum (ETH) Price Analysis - March 18, 2021

Digital asset company CoinShares released its weekly fund flow report. The report pointed out that because the price of Bitcoin surged to as high as 60K, some investors may sell their Bitcoin holdings to realize the benefits. Therefore, the data shows that approximately $39 million of funds have flowed out in the past week.
But Ethereum has a different situation.

According to the fund flow data chart, Ethereum is very popular among investors. Nearly half of the total flow of funds went into Ethereum, and the total inflow in the past week was approximately $113.5 million.
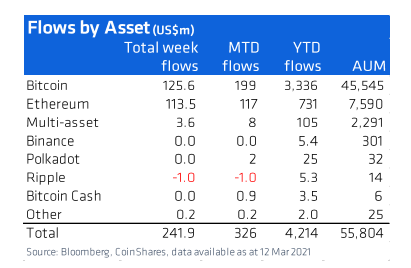
The report added that available pricing data suggests passive investment products continue to outperform their active peers. Compared with active investment, investors still prefer passive management strategies, with an asset management scale of $5.41 billion. Only $786 million is listed under active management.
Ethereum (ETH) Price Analysis

Source: ETH/USD Daily via TradingView
The current trading price of Ethereum (ETH) is $1,844, a drop of more than 9% compared to its all-time high of $2038.84 on February 20.
At a market value of $212,459,515,466, the world's second-largest cryptocurrency ETH managed to find a natural support level on the daily 20 Exponential Moving Average (20-EMA).
Judging from the daily candlestick chart, ETH is now in an ascending channel, and candlesticks in recent days have all closed above the 20-day Moving Average. This is a good sign that proves that the bulls have not hesitated and are still defending the price at a higher level. At the same time, the upwardly curved moving average distribution also confirms this point.
From a technical perspective, the stochastic RSI indicator shows that the blue K-line has turned upwards and has overlapped with the yellow D-line, which is a sign that a bullish crossover has formed.
If the bulls can actively defend the rally near yesterday's intraday high so that the two lines can climb upwards and approach the 80 overbought zones, the new momentum may push ETH to the first resistance at $1942. If ETH/USD successfully breaks through this resistance, the bulls retest their all-time high of $2038.84. Any further increase will likely make ETH/USD a new round of rising.
The MACD indicator is in the bullish zone, the blue MACD line has been hovering above the yellow Signal line and both lines are running above the zero axes.
If the bulls are not strong enough, repeated retesting of the 20-EMA support level of $1,757 will weaken the support level. If the bears lower the price around $1,757, the ETH/USD currency pair may gradually begin to fall to 50-EMA of $1,623.
If the bulls fail to hold this support level at the $1,623 level, then the ETH/USD currency may fall to the key support level of $1,422.
Image source: Shutterstock
Attorney Batting for XRP Investors to Join SEC Case to Refile Motion to Intervene