Polkadot (DOT) Price Analysis – March 16,2021

Polkadot (DOT) is currently the sixth-leading cryptocurrency with a market cap of around $31,766,980,598. It is trading at $34.37 at the time of writing.

With Bitcoin(BTC) hitting a new all-time high(ATH) of $61,781, the cryptocurrency has encountered a strong selling pressure. At present, Bitcoin has retraced by more than 11%. The altcoin market is highly correlated with Bitcoin. Looking back at the past 24 hours, DOT has dropped by 4.19%, which is similar to the loss suffered by the dominant Bitcoin, with a drop of 4.12% within 24 hours.
Polkadot(DOT) Price Analysis
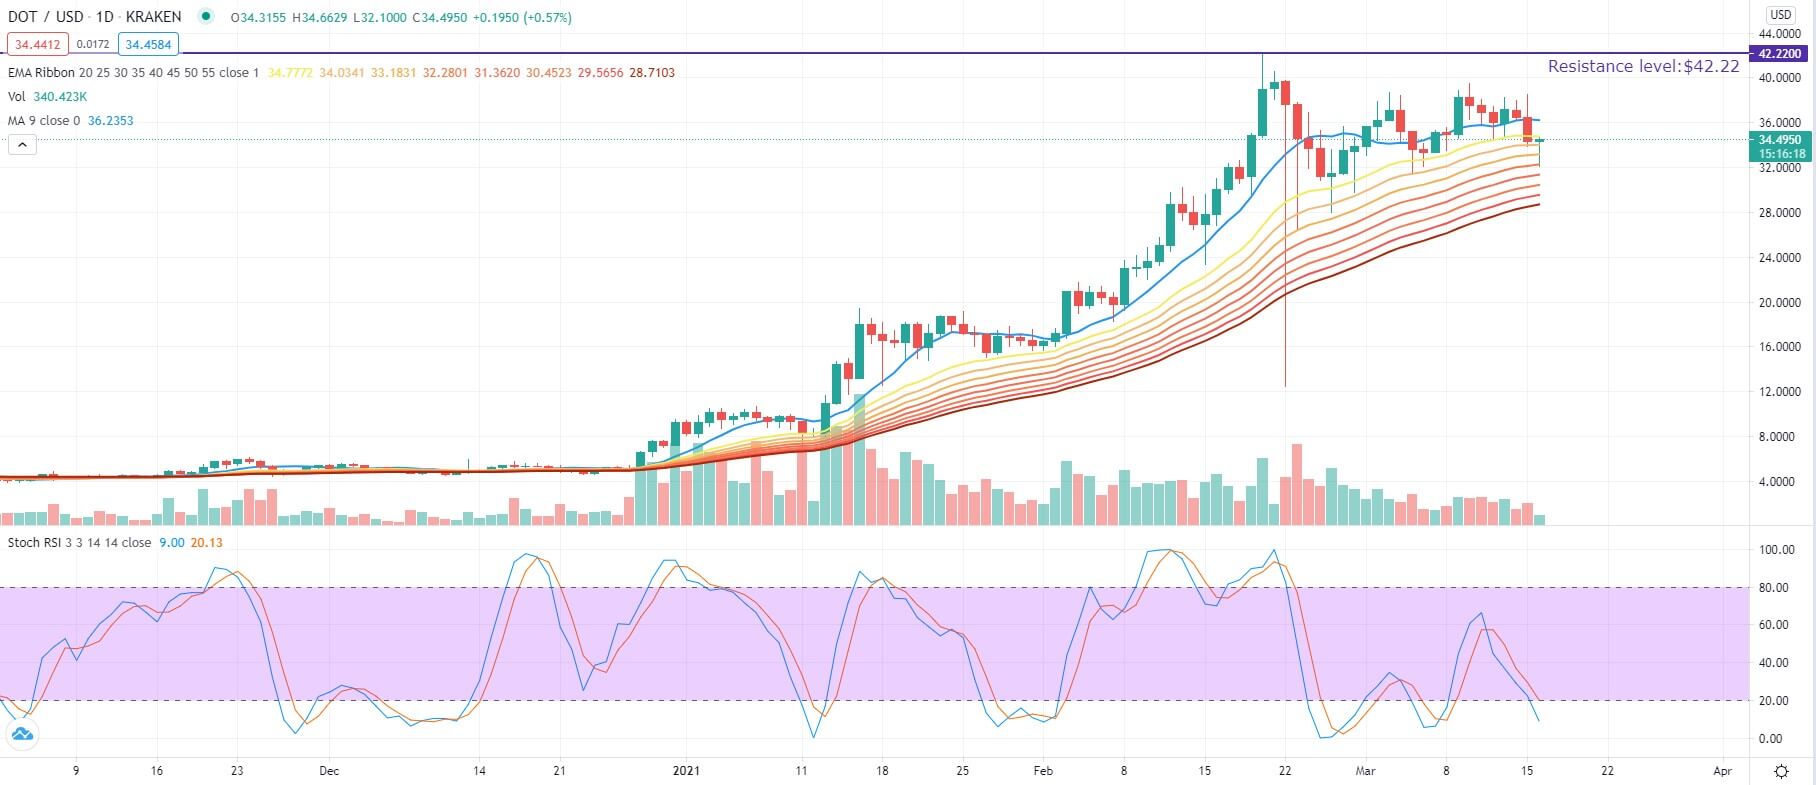
Source: DOT/USD Daily via TradingView
Although the bulls have tried their best to defend the critical support level of the 20-day Moving Average ($34.77) in the past few days, they have not succeeded. It proves that there are no more buying orders to support Polkadot's rise to its next psychological barrier of $38. At the time of writing, Polkadot (DOT) dropped by 4.81% with 24 hours and is trading at $34.40.
The flattening moving average distribution indicates that the bulls may lose control. If the price cannot stand over the 20-day Exponential Moving Average(20-EMA), short-term traders may be eager to sell their DOT holdings. This may cause the DOT/USD currency to fall even further and test the 50-day Exponential Moving Average (50-EMA), which is approximately pinpointed at $29.57.
The first resistance zone for DOT to test will be the $40 level zone. If it can successfully break through this level, the next uptrend will be triggered for DOT and the bulls will aim to retouch DOT's all-time high of $42.22. If it surpasses this level within the increasing trading volume, then DOT will usher in a new round of bullish momentum, aiming for the psychological mark of $50.
From a technical perspective, the stochastic RSI indicator fell into the oversold area and the yellow D-line approached the $20 level. The blue K-line and the yellow D-line have turned downwards and have merged to form a bearish cross, which may make it difficult for the bulls to initiate an upward breakthrough.
Image source: Shutterstock
Is Cardano (ADA)'s Addition to the Bloomberg Terminal a Bullish Signal?