Bitcoin Creates a new ATH of $69K

The price of Bitcoin once again hit a new high of $69,000 at UTC time following Ether hitting $4,868 earlier today.

The US Bureau of Labor released data on inflation earlier in the morning which showed that the core inflation rate was the highest in 30 years.
The inflation data supported the argument that cryptocurrency is a hedge against rising cost pressures. Bitcoin and Ethereum both hit new highs.
Source: FRED-CPI data highlights record 30-year high inflation rate

Although the bulls did not hold on to the new high for a long time, after a brief impact on the high, traders began to take profits and the shorts occupied the market.
At the time of writing, according to Coinmarketcap, bitcoin dropped by 3.84% in 24 hours and BTC was trading at around $64,505.85.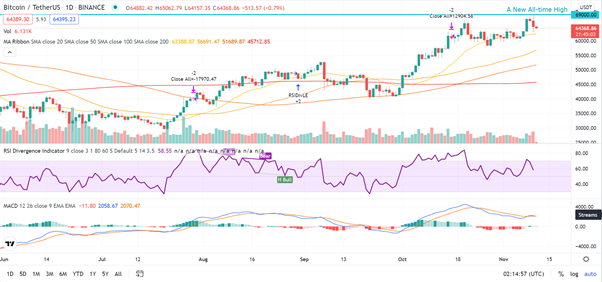
Source: BTC/USDT Daily via TradingView
Judging from the daily candlestick chart, after experiencing yesterday’s surge, bitcoin (BTC) is currently undergoing a callback and bears are persistently pushing BTC prices down.
The bears have pushed the price of Bitcoin all the way back to $62,700, and it has now rebounded to $64K.
From the perspective of technical analysis, it is a normal phenomenon where investors take profits after setting a new historical record, and the price needs to retest the support level to support the future trend of cryptocurrency.
After October 20, Bitcoin suffered relatively considerable losses after touching a record-high of $67000, so the all-time high will be a key psychological barrier for Bitcoin as it struggles to retest.
If the bulls can push the decisive closing price above $67,000, then the bullish momentum may prompt BTC to reach a new high of $75,000.
The transaction price of BTC/USDT is much higher than the Exponential Moving Average ribbon. However, the flattening moving average and the narrower MACD index show that the upward trend of Bitcoin may be gradual.
The MACD index shows that the blue MACD line is downward and has intersected with the yellow Signal line. This is a signal that forms a short-term bear market crossover, even though both lines are above the zero axes. But still, there is likely to form a bearish crossover.
The stochastic Relative Strength Index is below the overbought zone of 80, which is the bearish side of the oscillator. If BTC falls below the $60,000 level, it will trigger a lot of selling, in which case BTC/USDT will test the 50 day-exponential moving average of $56692.96 and attempt to flip it into a support level.
Image source: Shutterstock
Bitcoin’s Taproot Upgrade Launch in Three Days, Smart Contract Capabilities to be Unlocked?