DOT Price Analysis March 4, 2021: Will Bulls Manage to Push Polkadot (DOT) Back to its All-Time High of $42?

According to data from CoinMarketCap, Polkadot has surged in value, replacing XRP as the sixth-largest cryptocurrency by market cap. Polkadot has performed very well in the past, setting a new all-time high (ATH) of $42.22 on February 20.

With the previous increase in the U.S.10 year bond yield rate and the price correction of Bitcoin, the entire cryptocurrency market has shown various degrees of retracement, and Polkadot (DOT) is no exception. Since February 22, the price of DOT has fallen from $39.64 to $31.21, a drop of more than 21%.
However, what is amazing is that in the past 7 days, DOT has risen by more than 18.71% and has recovered some of the losses suffered over the past week, with its price surging over above $36.
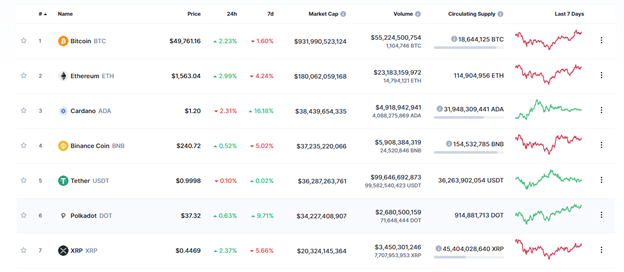
Source: Coinmarketcap
DOT Price Analysis
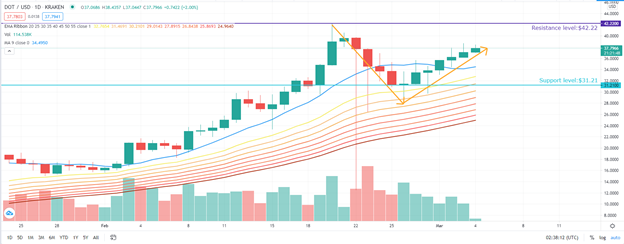
Source: DOT/USD via TradingView
From the daily candlestick chart, since February 20th, the Polkadot (DOT) hit a record high of about $42.22. Since then, it has been in a downward state, but it is still maintaining above the crucial psychological support line of $30. DOT's chart for the last five days has shown a green candlestick, which indicates that Polkadot has broken through the downtrend trend and rebounded higher. From a graphic point of view, DOT's trend shows a V-shaped reversal, and the bulls are working hard to push the price to a higher level.
The rise of the Moving Average and the long arrangement of the Exponential Moving Average ribbon indicate that the bulls have the advantage. DOT is still in a strong upward trend and may have a large possibility to hit the $40 and $42.22 pressure levels in the upcoming days.
At the time of writing, DOT is trading at $37.77, which is much higher than the support level of $35 and the 9-day Moving Average ($34.49).
Investors still need to be aware that although the bulls take charge of the market, the power of the bears should not be underestimated. From the small Doji pattern received on February 2 and the inverse hammer pattern shown on February 3, it can be seen that the bears are trying to suppress the price pushed up by the bulls. Therefore, if the price continues to rise, more selling power will be encountered.
The near-term resistance is about $38.69, the highest price of yesterday. If the bulls succeed in breaking the resistance level of $38.69, the price may above $40.00. The next key resistance will then be the $42.00 level.
If the DOT price fails to rise to $38.50 or above $39.00, there may be a short-term downward correction. The first key support to look out far will then be near the 9-day Moving Average of $34.50.
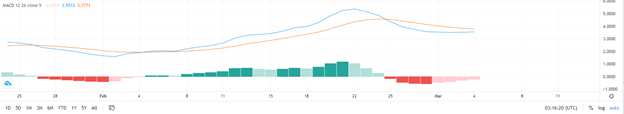
Source: DOT/USD via TradingView
For the MACD chart, we can see that the MACD of DOT/USD is gaining momentum in the bullish zone. The MACD blue line is approaching the red signal line and the direction has been bent upward. Both lines are above the zero axes.
Image source: Shutterstock
Ethereum (ETH) Price Analysis - March 3, 2021