Searching for: "


Analysis
"
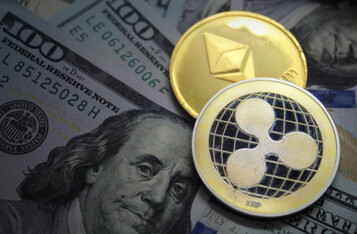
Ethereum (ETH) and Ripple (XRP) Price Analysis
Price analysis for Ethereum and XRP amidst the ongoing crypto rallies
Bitcoin Price and Crypto Market Analysis: Opportunities or Risks Ahead?
Analysis of why the Bitcoin and crypto market going up and potential opportunities and risks ahead.
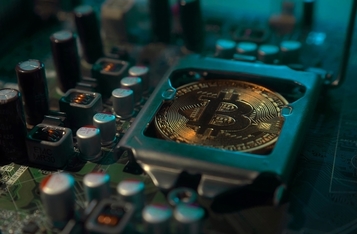
PrimeXBT Analysis: Bitcoin Hash Rate Sets New ATH, Fundamentals Scream Buy The Dip
In stocks, company profit margins and operating expenses are top priorities in fundamental analysis. Fundamental analysis in forex currencies could involve looking at each nation's GDP or country's political health. Commodity fundamental analysis looks at supply, demand, and environmental factors.
Litecoin Price Analysis Indicates LTC Will Surge Over $200
The Litecoin community grows more excited as LTC surges towards its all-time high of $360.Our technical analysis indicates bullish price movements to come for the altcoin.
DeFi Token Price Analysis: COMP, SNX, and UNI
This week in crypto, a DeFi Token Price analysis of COMP, SNX and UNI taking into account the prediction of technical indicators and the overall crypto market.
Analyzing a16z's Investment Strategies and Portfolio Outcomes
Explore a16z's investment strategies, portfolio outcomes, and the factors influencing the profitability of their investments in the crypto sector.
AAVE Price Prediction: Target $215-225 by Mid-January 2025 as Technical Indicators Signal Bullish Momentum
AAVE price prediction shows upside potential to $215-225 within 4-6 weeks as MACD histogram turns bullish and price holds above key $190 support level.
AAVE Price Prediction: Targeting $215-225 Breakout Within 3-4 Weeks
AAVE price prediction shows bullish momentum building with MACD histogram at 3.39 and RSI neutral at 55. Technical analysis targets $215-225 range by early January 2026.
AAVE Price Prediction: Target $215-225 by Year-End 2025 as Technical Indicators Signal Recovery
AAVE price prediction targets $215-225 range within 3-4 weeks as MACD bullish histogram and neutral RSI create favorable setup for Aave recovery from current $187 levels.
AAVE Price Prediction: Targeting $205-$208 Rally Within 2 Weeks
AAVE price prediction shows bullish momentum building toward $205 short-term target, with technical indicators supporting upside despite neutral RSI at 52.14.
AAVE Price Prediction: $205 Target Within 2 Weeks Despite Current Bearish Sentiment
AAVE price prediction suggests a recovery to $205 in 2 weeks despite current weakness at $183.30, with technical analysis showing bullish MACD momentum emerging.
AAVE Price Prediction: Targeting $195-$205 Breakout Within 7 Days as Bulls Regain Control
AAVE price prediction suggests imminent breakout to $195-$205 range within one week, supported by bullish MACD momentum and RSI recovery from oversold levels.
AAVE Price Prediction: Targeting $224-$240 Range in Next 7-14 Days After 13% Rally
AAVE shows bullish momentum with 13.21% daily gains. Technical analysis suggests potential move to $224-$240 range as MACD histogram turns positive and price breaks above key resistance levels.
AAVE Price Prediction: $185-195 Target Within 2 Weeks as Technical Momentum Shifts Bullish
AAVE price prediction suggests upward movement to $185-195 range over next 2 weeks, with bullish MACD histogram supporting recovery from oversold conditions.
AAVE Price Prediction: $210-$220 Target Within 30 Days Despite Recent 11% Drop
AAVE price prediction shows potential 27-33% upside to $210-220 range by year-end, supported by bullish MACD histogram and oversold RSI conditions at $165 support level.
AAVE Price Prediction: Targeting $240-$310 Range as Technical Momentum Builds for December 2025
AAVE price prediction suggests upside to $240-$310 range over next 4-6 weeks as bullish MACD histogram signals potential reversal from current $187 levels.
AAVE Price Prediction: $216 Target by December 2025 as Technical Recovery Emerges
AAVE price prediction points to $216.75 target within 5 days as oversold conditions and bullish MACD histogram signal potential 16% rally from current $186.56 levels.
AAVE Price Prediction: Recovery to $208-$246 Expected Within 4 Weeks as Oversold Conditions Signal Bounce
AAVE price prediction targets $208-$246 recovery over next month as technical indicators show oversold bounce potential from current $176 support level.
AAVE Price Prediction: Recovery to $180-190 Expected by December 2025
AAVE price prediction shows potential recovery to $180-190 range within 4-6 weeks, despite current bearish sentiment. Technical indicators suggest oversold bounce ahead.
AAVE Price Prediction: $214 Target by December 2025 Despite Current Weakness
AAVE price prediction shows potential recovery to $214 within 4-6 weeks, though immediate downside risk to $120 exists. Technical analysis reveals oversold conditions may spark bounce.
AAVE Price Prediction: Recovery Rally to $208-261 Expected Within 5 Days Despite Current Weakness
AAVE price prediction suggests recovery from oversold conditions could drive token from $164.98 to $208-261 range by November 24, 2025.
AAVE Price Prediction: Recovery Target $208 Within One Week Despite Current Oversold Conditions
AAVE price prediction points to $208 recovery target within one week as technical indicators show oversold bounce potential from current $170.80 level.
AAVE Price Prediction: Target $208 Short-Term Despite Current Bearish Momentum
AAVE price prediction shows potential recovery to $208 within one week, though current technical indicators suggest caution with bearish MACD and oversold conditions.
AAVE Price Prediction: Recovery Rally to $226-$246 Expected Within 4-6 Weeks
AAVE price prediction shows potential 24-36% upside to $226-$246 range as oversold conditions and $25B TVL growth support near-term recovery from current $182 levels.
AAVE Price Prediction: Recovery to $226-246 Target by December 2025 Despite Current Weakness
AAVE price prediction targets $226-246 recovery within 4-6 weeks as technical indicators suggest oversold bounce potential despite current bearish momentum at $183.86.
AAVE Price Prediction: $246 Target Within 2 Weeks as Technical Indicators Signal Bullish Momentum
AAVE price prediction shows potential rally to $246 in the short term, with medium-term Aave forecast targeting $340-$370 range based on technical analysis.
AAVE Price Prediction: $256 Target Within 30 Days as Technical Indicators Signal Recovery
AAVE price prediction points to $256 recovery target by December 2025, with current oversold conditions and analyst consensus supporting bullish Aave forecast.
AAVE Price Prediction: Testing $240 Breakout with $280 Medium-Term Target Despite Bearish Momentum
AAVE price prediction shows potential recovery to $240-280 range driven by $50M buyback, but bearish MACD signals caution below $195 support level.
AAVE Consolidates Near $232 as DAO Treasury Revamp Momentum Fades Amid Mixed Market Signals
AAVE price holds $232.02 following last week's 21% surge from treasury-backed economic revamp, but faces headwinds as momentum indicators turn bearish despite Bitcoin's continued strength above ...
AAVE Tests Lower Bollinger Band at $215 as DeFi Token Seeks Technical Recovery
Aave (AAVE) trades at $214.98, up 2.8% daily, as the DeFi protocol token attempts to bounce from oversold technical conditions near key support levels.
AAVE Tests Critical Support at $209 as Treasury Revamp Momentum Fades Following 21% Rally
Aave price retreats to $209.45 (-8.6%) as traders take profits following the DAO's treasury-backed economic revamp announcement that drove a massive 21% surge earlier this week.
AAVE Trading Update: v4 Launch Announcement Sparks Rally Despite Mixed Technical Signals
AAVE trades at $273.55 (+3.55%) as v4 launch news and governance improvements drive momentum, though key resistance levels remain challenging for bulls.
AAVE Price Analysis: Token Falls to $264 as Governance Changes Signal Long-Term Focus
AAVE trades at $264.60 (-1.08% daily) near Bollinger Band support following governance emission cuts. Technical indicators show mixed signals despite bullish long-term outlook.
AAVE Price Analysis: Key Support at $270 as Protocol Reduces Token Emissions
AAVE trades at $270.17 (-2.57% in 24h) near critical Bollinger Band support as governance proposes reducing daily emissions from 390 to 300 AAVE tokens.
AAVE Price Holds $278 Support as Protocol Upgrades Signal Long-Term Strength
AAVE trades at $278.54 with minimal 24h movement as governance reduces emissions and Q4 upgrades promise enhanced protocol efficiency for DeFi lending.
AAVE Price Struggles Near $270 as RSI Signals Oversold Territory
AAVE trades at $270.63 with RSI at 35.22, suggesting potential bounce from oversold levels despite governance emission reduction proposal.
AAVE Price Drops 11% as Governance Changes Signal Protocol Shift
AAVE trades at $262.41 after an 11% daily decline, with technical indicators showing oversold conditions while governance proposals aim to enhance protocol sustainability.
** AAVE Price Analysis: DeFi Token Tests $297 Support as Governance Changes Loom
** AAVE trades at $296.65 (-0.44% daily) as governance proposes emission cuts. Technical indicators show mixed signals with RSI at 45 suggesting consolidation ahead.
AAVE Price Drops 3.4% as Technical Indicators Flash Mixed Signals
Aave (AAVE) trades at $297.19 after declining 3.42% in 24 hours, with RSI at neutral 45.30 suggesting potential consolidation ahead for the DeFi protocol token.
AAVE Price Holds Strong at $307 Despite Governance Changes and Technical Crossroads
AAVE trades at $307.89 with mixed signals as governance proposes emission cuts while technical indicators show neutral momentum in consolidation phase.
AAVE Price Analysis: Strong Bullish Momentum at $309 Despite Governance Changes
AAVE trades at $308.77 with 5.12% daily gains as governance proposes winding down LEND migration contract, reallocating $100M to ecosystem reserves.
AAVE Price Analysis: Key Support at $289 as Bearish Momentum Builds
AAVE trades at $292.72 (-0.24% today) near critical support levels. Technical indicators show bearish momentum despite analyst predictions of $355 recovery target.
AAVE Price Holds Above $298 As Protocol Hits $3 Trillion Deposits Milestone
AAVE trades at $298.10 with mixed signals as the protocol celebrates $3 trillion in deposits while governance proposes emission cuts for sustainability.
AAVE Price Hovers Near $300 as Governance Proposal Aims to Boost Protocol Health
AAVE trades at $299.82 (-2.79% daily) while facing resistance at $310. Recent governance proposal to reduce emissions could strengthen protocol economics.
AAVE Price Struggles Below $310 As Bearish Momentum Builds Despite Strong Long-Term Trend
AAVE price falls 3.21% to $308.76 amid weakening momentum signals, though the token maintains its position above key support levels in a volatile crypto market.
AAVE Bulls Test $318 Resistance as Technical Indicators Show Mixed Signals
Aave (AAVE) trades at $317.99 with modest 1.04% daily gains, facing key resistance at $350 while RSI remains neutral at 53.70 amid consolidation phase.
AAVE Price Surges 3.6% to $314 as Safety Module Proposal Strengthens Protocol Health
AAVE trades at $314.83, up 3.61% in 24h, as governance proposal to reduce emissions aims to improve protocol financial health while $3 trillion deposit milestone reinforces DeFi dominance.
AAVE Price Hits $303.50 as DeFi Protocol Reaches Historic $3 Trillion Milestone
AAVE trades at $303.50 (+2.18%) following Aave's achievement of $3 trillion in deposits and Soneium blockchain integration, despite emerging security concerns.
AAVE Price Consolidates at $300 as $3 Trillion TVL Milestone Fuels Long-Term Bullish Outlook
AAVE trades at $300.35 (-1.46% in 24h) near crucial support levels as Aave protocol achieves historic $3 trillion TVL, signaling institutional confidence despite mixed technical signals.
AAVE Price Consolidates Near $300 Support as Development Progress Sustains Bullish Outlook
AAVE trades at $300.24 with mixed signals as development milestones support long-term bullish sentiment despite short-term technical headwinds.
AAVE Price Consolidates at $301 as Development Progress Boosts Long-Term Outlook
AAVE trades at $301.04 with mixed signals - development updates provide bullish fundamentals while technical indicators show neutral momentum in current consolidation phase.
Aave (AAVE) Holds Above $300 as Development Progress Counters Market Weakness
AAVE price trades at $310.33 despite 3.47% daily decline, with strong fundamentals and V4 development progress supporting long-term outlook amid neutral RSI conditions.
AAVE Price Analysis: Strong Bullish Momentum Continues at $319 Despite Technical Headwinds
AAVE trades at $319.47 (+0.87%) as development updates and treasury strength drive positive sentiment, though MACD signals suggest near-term caution for traders.
AAVE Price Surges 5.51% to $321.78 as Development Milestones Drive Bullish Momentum
AAVE trades at $321.78 with 5.51% daily gains, supported by V4 development progress and strong technical indicators showing continued bullish strength above key moving averages.
AAVE Price Analysis: DeFi Token Holds $312 as V4 Development Accelerates
AAVE trades at $312.27 (+0.87%) as Aave Labs advances V4 development and protocol deposits surge 41.6% month-over-month, signaling strong fundamentals.
AAVE Price Analysis: DeFi Token Consolidates Above $300 Amid Mixed Technical Signals
AAVE trades at $319 with bearish momentum emerging despite bullish trend. RSI neutral at 52.56 signals potential direction break ahead for Aave holders.
AAVE Price Recovers to $322 as DeFi Giant Shows Mixed Technical Signals
AAVE trades at $322.36 with 2% daily gains despite governance concerns, as technical indicators suggest potential consolidation ahead for the DeFi protocol.
AAVE Price Dips to $313 Despite Strong Technical Position and Protocol Growth
AAVE trades at $313.61 (+1.64% in 24h) as governance concerns overshadow V3 Aptos launch and robust treasury health, creating mixed signals for traders.
AAVE Price Drops to $308 as Governance Uncertainty Weighs on DeFi Giant
AAVE trades at $308.03 (-3.30% in 24h) as governance rumors and bearish momentum indicators signal potential weakness despite strong protocol fundamentals.
AAVE Price Drops to $315 as Governance Uncertainty Overshadows 19% Rally
AAVE trades at $315.17 after mixed week of whale accumulation and governance FUD, with technical indicators showing conflicting signals for traders.
Aave (AAVE) Breaks Above $300 as DAO Funding Proposal Shows Bullish Technical Setup
AAVE price surges 4.98% to $307.18 amid strong bullish momentum, with RSI neutral and key resistance at $340.49 as Aave DAO proposes strategic funding update.
** AAVE Price Drops 5.54% to $315.63 Despite DeFi Rally - Technical Analysis Shows Mixed Signals
** AAVE trades at $315.63 after a 5.54% daily decline from its recent $329.64 peak, while technical indicators suggest bullish momentum remains intact despite short-term weakness.
AAVE Price Holds Above $294 Despite Mixed Signals and Market Volatility
AAVE trades at $294.76 with bullish momentum indicators conflicting with recent liquidation concerns, creating key trading opportunities near critical support levels.
AAVE Price Surges Above $300 as Bulls Battle Upper Resistance Despite Recent Volatility
AAVE trades at $304.59 with strong bullish momentum as technical indicators show recovery potential despite last week's 23% decline amid record fundamentals.
Aave (AAVE) Surges to $305 as TVL Hits Record $26.47 Billion High
AAVE trades at $305.10 (+0.95% today) following record-breaking TVL milestone, with technical indicators showing strong bullish momentum near resistance levels.
AAVE Price Surges 5.91% as Technical Indicators Flash Bullish Momentum
AAVE climbs to $300.89 with strong technical signals emerging across multiple indicators. RSI neutral positioning suggests more upside potential ahead.
AAVE Price Analysis: Neutral RSI at $264 Signals Potential Reversal Opportunity
AAVE trades at $264.02 with +3.08% daily gains as RSI hits neutral 42.69, suggesting oversold conditions may be easing for the DeFi protocol token.
AAVE Price Drops 2.12% as DeFi Token Tests Critical Support at $245
Aave trades at $256.27 after declining 2.12% in 24 hours, with AAVE RSI at 38.71 signaling potential oversold conditions as the token approaches key support levels.
AAVE Price Rallies to $261.93 as V4 Development Milestone Boosts DeFi Confidence
AAVE trades at $261.93 (+1.78%) as Aave V4 reaches feature-complete status and protocol TVL surpasses $30B, though technical indicators suggest mixed signals ahead.
AAVE Price Drops Below Key Moving Averages as Technical Indicators Flash Warning Signals
AAVE trades at $257.12 with bearish momentum building. Technical analysis reveals concerning signals as price approaches critical support levels near $245.
AAVE Price Tests $249 Support Amid Retreat from Recent Highs
AAVE trades at $253.26 (-1.39%) as bulls defend key support levels following impressive 95% monthly gains driven by Aave V4 development progress.
AAVE Price Plunges 3.89% as Technical Indicators Flash Warning Signals
AAVE trades at $258.66 after dropping 3.89% in 24 hours, with RSI at oversold levels and bearish momentum building across multiple timeframes.
AAVE Price Falls Below Key Support as Bears Target $263 Amid Technical Weakness
AAVE trades at $277.71 (-1.77% in 24h) with RSI signaling oversold conditions and immediate support at $263.57 under pressure from selling momentum.
AAVE Price Tests Critical $274 Support Despite DeFi Leadership
AAVE trades at $274.89 (-5.07%) testing key support levels as whale withdrawals counter bullish fundamentals and $50B TVL milestone.
AAVE Price Retreats to $292 Despite 95% Monthly Surge as Whales Accumulate
AAVE trades at $292.77 (-4.02% in 24h) after testing $285 support, while whale activity and shrinking exchange supply fuel bullish momentum despite short-term bearish signals.
AAVE Price Tests $285 Support Despite 95% Monthly Surge and $50B TVL Milestone
AAVE trades at $289.08 (-3.61% today) as whales accumulate 257K tokens worth $17.2M while technical indicators show mixed signals near key support levels.
AAVE Price Struggles at $295 as Technical Indicators Signal Mixed Momentum
AAVE trades at $295.79 with weakening bullish signals despite overall strong trend, as RSI sits neutral and MACD shows bearish divergence.
AAVE Price Breaks Above $298 as $50B TVL Milestone Powers Recovery Despite Bearish Signals
AAVE trades at $298.42 (+4.67%) after surging on record $50B total value locked, but technical indicators show mixed signals with RSI neutral at 50.42.
AAVE Price Analysis: $285 Support Test After TVL Surge to $50 Billion
AAVE trades at $285.26 with bearish momentum despite TVL reaching $50B milestone. Key technical levels suggest potential downside to $269 support.
AAVE Price Analysis: Token Shows Resilience at $292 Despite Mixed Market Signals
AAVE trades at $291.98 (+0.35% daily) with technical indicators showing neutral momentum while fundamentals remain strong with $50B TVL and V4 upgrade progress.
AAVE Price Analysis: $323 Hold Despite TVL Surge and V4 Upgrade Momentum
AAVE trades at $323.23 (-0.78% daily) as $50B TVL milestone and V4 upgrade support bullish structure despite profit-taking pressure.
AAVE Price Holds Above $330 Despite Profit-Taking Pressure as Technical Indicators Signal Bullish Momentum
AAVE trades at $331.77 with +2.57% daily gains despite recent profit-taking. RSI at 66.97 and strong moving average support suggest continued upside potential.
ADA Price Prediction: Cardano Eyes $0.50 Recovery After Testing $0.42 Support Zone
ADA price prediction targets $0.50 in the near term as Cardano holds critical support at $0.42, with analysts forecasting potential recovery to $0.90 range by month-end.
ADA Price Prediction: Cardano Eyes $0.52 Break Above 50-Day MA Within 2 Weeks
ADA price prediction shows bullish momentum building as Cardano trades near upper Bollinger Band at $0.46, targeting $0.52 resistance break for 13% upside within two weeks.
ADA Price Prediction: Cardano Targets $0.47-$0.52 by Year-End 2025 Despite Current Consolidation
ADA price prediction shows potential 9-21% upside to $0.47-$0.52 range by December 31st, with bullish MACD momentum supporting break above $0.45 resistance level.
ADA Price Prediction: Cardano Eyes $0.48 Break Before Year-End Rally to $0.55
ADA price prediction shows potential 27% upside to $0.55 by January 2026, with immediate resistance at $0.48 serving as key breakout level for Cardano's next move.
ADA Price Prediction: Cardano Eyes $0.50 Breakout Despite Mixed Signals Through December 2025
ADA price prediction suggests potential bounce to $0.50-$0.62 range if bulls reclaim $0.47 resistance, though current bearish momentum keeps downside risk to $0.37 active.
ADA Price Prediction: Targeting $0.65-$1.69 Recovery Despite Current Weakness
ADA price prediction shows mixed signals with short-term targets of $0.39-$0.65 while medium-term Cardano forecast points to potential $1.69 recovery.
ADA Price Prediction: Targeting $0.62 as Midnight Launch Drives December Rally
Cardano shows bullish momentum with ADA price prediction targeting $0.62 by December 8th. Technical indicators suggest breakout potential above $0.47 resistance.
ADA Price Prediction: Cardano Eyes $0.58 by Year-End Despite Mixed Signals
ADA price prediction suggests potential 32% upside to $0.58 by December 27, 2025, though short-term bearish sentiment creates near-term headwinds around $0.43.
ADA Price Prediction: Cardano Targets $0.53-$0.70 Recovery as Oversold Conditions Signal Potential 35-80% Upside
ADA price prediction suggests recovery to $0.53-$0.70 range over next 4-8 weeks as technical indicators show oversold RSI at 28.75 and emerging bullish MACD momentum.
ADA Price Prediction: Oversold Bounce Target $0.58 by Mid-December 2025
Cardano trades oversold at $0.38 with RSI at 26.55, targeting $0.58 resistance bounce within 2 weeks as MACD shows early bullish divergence signals.
ADA Tests Critical $0.39 Support as Oversold Momentum Signals Potential Bounce
Cardano trades at $0.42 amid broader crypto weakness, with RSI at 31.38 suggesting oversold conditions as ADA price approaches key technical support levels.
ADA Price Prediction: Cardano Eyes $0.70 Recovery Despite Current Weakness - December 2025 Forecast
ADA price prediction points to $0.70 target by December 2025 as technical indicators suggest oversold bounce potential from current $0.42 levels.
ADA Price Prediction: Cardano Targets $0.77 by December 2025 as Technical Indicators Signal Recovery
ADA price prediction points to $0.77 target by December 2025 as Cardano recovers from oversold conditions with bullish MACD momentum emerging at current $0.43 levels.
ADA Price Tests Key Support at $0.43 as Bitcoin's Seven-Month Low Pressures Altcoins
Cardano (ADA) trades at $0.43 with 2.1% daily gains as Bitcoin's drop to seven-month lows creates market uncertainty, while Singapore Exchange futures launch provides some offsetting optimism.
ADA Price Tests Annual Lows at $0.42 as Oversold Conditions Signal Potential Relief Rally
Cardano trades at $0.42 with RSI at 29, marking oversold territory as technical indicators suggest potential bounce from critical support levels amid quiet news cycle.
ADA Price Prediction: Cardano Eyes $0.61 Breakout Despite Short-Term Bearish Pressure Through December 2025
ADA price prediction shows potential rally to $0.61 resistance, but current bearish momentum suggests consolidation around $0.42 before any meaningful upward movement materializes.
ADA Price Prediction: Cardano Eyes $0.824 Breakout Target Amid Oversold Bounce Setup
ADA trading at $0.40 shows oversold RSI at 23.59, targeting $0.461-$0.824 range over next 4 weeks as technical indicators suggest potential reversal from current lows.
ADA Drops to 52-Week Low as Tech Selloff Triggers Crypto Risk-Off Sentiment
Cardano (ADA) hit $0.41, matching its yearly low, as the broader tech stock rout and Federal Reserve uncertainty sparked a cryptocurrency market selloff with oversold RSI signaling potential bou...
ADA Price Prediction: Cardano Targets $0.66-$1.88 Recovery After Oversold Bounce from $0.41
ADA price prediction shows potential 61-359% upside from current $0.41 level, with technical analysis suggesting oversold bounce toward $0.66-$1.88 range by Q1 2026.
ADA Tests Monthly Lows at $0.47 Despite Bitcoin's Record Rally to $124K
Cardano trades at $0.47 with modest 1.6% gains as broader crypto momentum fails to lift ADA amid ongoing technical weakness and Leios upgrade uncertainty.
ADA Price Prediction: Cardano Eyes $0.62 Rebound as RSI Shows Oversold Relief Potential
ADA price prediction targets $0.62 resistance test within 2 weeks as technical indicators suggest oversold bounce from current $0.47 levels near Bollinger Band support.
ADA Price Prediction: Cardano Targets $0.62 by December with Potential $1.20 Breakout in Q1 2026
ADA price prediction shows consolidation near $0.46 support before targeting $0.62 resistance. Cardano forecast suggests potential rally to $1.20+ if key levels hold.
ADA Price Retreats to $0.48 Despite Record Staking Milestone as Technical Indicators Flash Mixed Signals
Cardano trades at $0.48 with 2.2% daily gains, but technical weakness emerges despite reaching 1.3M staking addresses as momentum indicators suggest potential downside pressure ahead.
ADA Price Prediction: Cardano Eyes $0.70 Recovery Despite Oversold Bounce Setup
ADA price prediction shows potential recovery to $0.70 within 30 days as oversold RSI at 29.64 suggests bounce from current $0.47 support level.
ADA Tests Crucial Support at $0.47 as Bearish Momentum Intensifies
Cardano price drops to $0.49 amid weak technical indicators, with ADA approaching lower Bollinger Band support as RSI signals oversold conditions in absence of major catalysts.
ADA Price Prediction: Cardano Eyes $0.53 Recovery Target Within 2 Weeks Despite Current Consolidation
ADA price prediction points to $0.53 short-term target as Cardano tests critical $0.47 support. Technical analysis reveals mixed signals with potential for 8% upside.
ADA Tests Critical $0.50 Support as Bearish Momentum Builds Despite Oversold Conditions
Cardano trades at $0.50 amid technical weakness, with ADA price testing key psychological support while momentum indicators signal oversold conditions in absence of major catalysts.
ADA Price Prediction: Targeting $0.37-$0.85 Range Through December 2025
ADA price prediction shows mixed signals with bearish momentum suggesting $0.37 downside risk, while technical bounce could target $0.85 by late November.
ADA Price Prediction: Cardano Targets $0.85 by December 2025 Amid Technical Recovery
ADA price prediction shows potential 63% upside to $0.85 within 4-6 weeks as Cardano approaches oversold bounce territory despite recent bearish pressure.
ADA Tests Key Support at $0.54 as Crypto Market Weakness Persists
Cardano trades at $0.54 after 1.1% decline, approaching critical support levels amid broader crypto market softness and technical selling pressure.
ADA Price Prediction: Targeting $0.70-$0.82 by December 2025 Amid Technical Consolidation
ADA price prediction shows potential upside to $0.70-$0.82 range by December 2025, with current technical indicators suggesting consolidation before breakout attempt.
ADA Price Tests Key $0.59 Pivot as Cardano Shows Early Signs of Technical Recovery
Cardano (ADA) price advances 2.6% to $0.59 as technical indicators suggest potential momentum shift, though major resistance levels remain overhead for the altcoin.
ADA Rebounds 4% to $0.58 as Cardano Tests Key Support Despite Hoskinson's DeFi Criticism
Cardano recovers to $0.58 after Charles Hoskinson blamed community for limited DeFi adoption, while technical indicators show mixed signals at critical support zone.
ADA Price Prediction: Cardano Eyes $0.70 Recovery by December Despite Current Weakness
ADA price prediction shows potential 25% upside to $0.70 target despite trading at $0.56. Technical indicators suggest bullish momentum building for Cardano forecast.
ADA Price Prediction: Cardano Eyes $0.69 Breakout Targeting $0.85 by December 2025
ADA price prediction shows bullish momentum building as Cardano tests $0.58 resistance. Technical analysis points to $0.69 breakout targeting $0.85 within 4-6 weeks.
ADA Price Prediction: Cardano Targets $0.70-$0.86 by December 2025 Despite Near-Term Weakness
ADA price prediction shows mixed signals with short-term downside to $0.52 but medium-term Cardano forecast targeting $0.70-$0.86 recovery by year-end 2025.
Cardano Whale Accumulation Fails to Prevent ADA Price Decline Amid Bitcoin Weakness
ADA trades at $0.53 despite 50M token accumulation by large holders over 48 hours, as Bitcoin's decline drags broader crypto market lower in oversold territory.
ADA Price Prediction: Cardano Eyes $0.69 Recovery Target Within 2 Weeks Despite Bearish Momentum
ADA price prediction points to potential $0.69 recovery target as Cardano trades near Bollinger Band support at $0.53, with critical $0.49 level determining direction.
ADA Price Prediction: Targeting $0.70-$0.86 Recovery by December 2025
Cardano technical analysis suggests ADA could reach $0.70-$0.86 within 4-8 weeks, with immediate resistance at $0.69. Current oversold conditions present strategic entry opportunity.
ADA Tests Critical $0.59 Support as $2.3B Liquidity Exit Weighs on Cardano Price
Cardano trades at $0.59 after losing $2.3 billion in liquidity over four days, with technical indicators suggesting potential recovery from oversold conditions.
ADA Price Prediction: Cardano Eyes $1.00 Target as Whale Accumulation Signals Medium-Term Breakout
ADA price prediction shows bullish momentum building with whale accumulation driving targets to $1.00 medium-term, supported by technical indicators signaling reversal.
ADA Tests Critical Support at $0.61 as $2.3B Liquidity Drain Pressures Cardano Bulls
Cardano (ADA) holds $0.61 support after losing over $2.3 billion in liquidity across four days, with technical indicators suggesting potential bounce or deeper correction ahead.
ADA Price Prediction: Cardano Eyes $0.74 Breakout Target Within 2 Weeks
ADA price prediction shows potential rally to $0.74 resistance level as MACD histogram turns bullish. Cardano forecast suggests 21% upside if key $0.65 level breaks.
ADA Tests Lower Bollinger Band Support as Momentum Indicators Flash Mixed Signals
Cardano trades at $0.60 with minimal 0.7% gains as technical analysis reveals ADA positioned near critical support levels amid neutral market sentiment and oversold conditions.
ADA Price Prediction: Cardano Eyes $0.70 Breakout Target Within 2 Weeks
ADA price prediction suggests consolidation around $0.61 before targeting $0.70. Cardano forecast indicates bullish momentum building despite neutral RSI at 37.15.
ADA Price Prediction: Cardano Eyes $0.82 Breakout with $1.88 Medium-Term Target
ADA price prediction shows potential rally to $0.82 critical level within 1 week, with bullish W-pattern targeting $1.88 if resistance breaks successfully.
ADA Price Prediction: Cardano Eyes $0.82 Breakout Target as Technical Indicators Signal Mixed Momentum
ADA price prediction points to $0.67-$0.69 range in November with key resistance at $0.824. Bullish MACD divergence suggests potential upside if Fibonacci level breaks.
ADA Price Prediction: Cardano Eyes $0.88 Breakout After Testing $0.64 Support
ADA price prediction targets $0.88 resistance level within 2 weeks as Cardano consolidates above key support. Technical analysis suggests 37% upside potential if bulls defend $0.60.
ADA Tests Key Support at $0.64 as Crypto Markets Consolidate Below Moving Averages
Cardano trades at $0.64 following a 0.87% decline, testing critical support levels as technical indicators signal potential downside pressure in absence of major catalysts.
ADA Price Prediction: Cardano Eyes $0.824 Breakout Target by November 2025
Current ADA price prediction points to consolidation near $0.68 with potential breakout to $0.824 within 4 weeks if bullish momentum returns.
ADA Tests Critical Support at $0.65 as Bearish Momentum Builds Despite Bullish Trend
Cardano trades at $0.65 after a 3% decline, with technical indicators showing bearish momentum despite maintaining an overall bullish trend structure.
ADA Price Breaks Above 7-Day Moving Average as Cardano Shows Technical Recovery Signs
Cardano (ADA) trades at $0.67 with 6.91% daily gains as technical indicators suggest potential momentum shift despite broader market uncertainty.
Cardano Tests Support at $0.63 as ADA Price Consolidates Below Key Moving Averages
ADA price holds steady at $0.63 with modest 1.1% gains while technical indicators signal consolidation phase below critical resistance levels amid broader crypto market stability.
ADA Tests Critical Support at $0.63 as Cardano Technical Analysis Reveals Oversold Conditions Amid Broader Crypto Weakness
Cardano drops 3% to $0.63, testing lower Bollinger Band support with RSI at 33.64 signaling potential oversold bounce as institutional volume remains elevated on Binance.
ADA Tests Critical $0.67 Support as Hydra 1.0 Launch Meets Bitcoin Correlation Pressure
Cardano trades at $0.67 amid 4.5% daily decline, testing key support despite positive Hydra Node 1.0 release and Brave Browser integration catalysts.
Cardano Consolidates Below Key Moving Averages as ADA Tests Critical Support Zone
ADA trades at $0.82 down 0.97% in 24 hours, hovering above the psychological $0.75 support level while facing resistance from the 20-day moving average at $0.83.
Cardano Consolidates Near $0.82 as Bulls Test Key Resistance Amid Neutral RSI
ADA trades at $0.82 with modest 1.13% daily gains, testing critical $0.83 pivot level while technical indicators suggest sideways consolidation continues.
ADA Drops 5.5% as Technical Support Fails Despite Bullish Long-Term Positioning
Cardano's ADA price fell to $0.82 after breaking below $0.83 support, though the token maintains 10.8% gains above its 200-day moving average.
ADA Shows Neutral Momentum Above Key Moving Averages Despite Limited Volume
Cardano trades at $0.87 with modest 0.92% daily gains, sitting above all major moving averages while technical indicators suggest consolidation ahead of potential breakout.
Cardano Consolidates at Key Technical Juncture as ADA Tests Critical Support Zone
ADA trades at $0.86 following modest 0.39% daily gain, hovering near 50-day moving average while technical indicators suggest neutral momentum ahead of potential breakout.
ADA Consolidates Above Key Support as Technical Indicators Signal Neutral Momentum
Cardano trades at $0.86 with modest 0.80% daily gains, testing critical resistance near $0.94 while maintaining position above 200-day moving average at $0.74.
ADA Faces Mixed Signals as Grayscale ETF Application Counters Technical Weakness
Cardano trades at $0.80 amid conflicting forces as Grayscale's spot ETF application sparks optimism while technical indicators suggest continued bearish pressure.
Cardano Tests Key Support at $0.80 as Technical Indicators Signal Neutral Territory
ADA trades at $0.80 with modest 0.90% daily gains while technical indicators show mixed signals, testing critical support levels amid range-bound action.
ADA Price Analysis - September 29, 2025
** ADA trades at $0.80 amid conflicting signals - recent ETF speculation drove 15.7% gains, but technical indicators show underlying bearish pressure with key support breakdown.
Cardano (ADA) Price Slides to $0.77 as Bears Target Key Support Levels
ADA price drops 2.01% to $0.77, testing critical support as technical indicators flash mixed signals with RSI at 38.4 showing oversold conditions approaching.
Cardano (ADA) Tests Critical Support as Bears Take Control Despite Institutional Backing
ADA trades at $0.77 (-2.88% in 24h) near key support levels, with technical indicators showing mixed signals despite recent Grayscale fund approval.
Cardano (ADA) Price Falls Below $0.80 Support as Trading Volume Drops 36%
ADA trades at $0.79 after breaking key support, with bearish technical signals emerging despite recent Openbank adoption news.
ADA Price Analysis: Cardano Tests Lower Bollinger Band Support at $0.82
ADA trades at $0.82 with neutral RSI at 42.9 as Cardano approaches critical support levels amid bearish momentum signals from MACD indicators.
Cardano (ADA) Drops to $0.82 as Bears Push Through Key Support Levels
ADA trades at $0.82 after breaking below crucial $0.87-$0.90 support zone, with technical indicators suggesting further downside risk despite positive adoption news.
Cardano (ADA) Drops 8.6% as Bears Test $0.79 Support Level
ADA price falls to $0.82 amid bearish momentum, with technical indicators suggesting further downside risk as Cardano approaches critical support levels.
Cardano (ADA) Consolidates Near $0.90 as Bulls Eye $1.02 Resistance Break
ADA price trades at $0.90 with bullish momentum building. Technical indicators suggest potential breakout above key resistance levels in coming sessions.
Cardano (ADA) Holds $0.90 Support Zone as Technical Indicators Signal Bullish Momentum
ADA trades at $0.90 with bullish MACD signals emerging. Technical analysis shows strong support at key levels while resistance targets $0.95-$1.00 range.
Cardano (ADA) Surges After SEC Approves Grayscale Fund - Price Eyes $1.02 Resistance
ADA price climbs to $0.91 (+0.89%) following SEC approval of Grayscale fund inclusion, with technical indicators showing strong bullish momentum toward key resistance levels.
Cardano (ADA) Surges 4.7% as Openbank Integration Boosts Adoption
ADA rallies to $0.91 with strong bullish momentum as Europe's largest digital bank integrates Cardano for 2 million customers, breaking key resistance levels.
Cardano (ADA) Hovers at $0.87 as Technical Indicators Signal Potential Breakout
ADA price trades at $0.87 with bullish MACD momentum despite neutral RSI, while recent SEC clarity and institutional partnerships provide positive backdrop for traders.
Cardano (ADA) Holds $0.86 Support As Market Cap Race Intensifies
ADA price trades at $0.86 with neutral RSI at 50.64 as Cardano climbs to ninth-largest crypto position, while LEIOS upgrade progress fuels technical optimism.
ADA Price Breaks Key Resistance at $0.86 as Cardano LEIOS Protocol Enters Review
ADA trades at $0.86 despite 5.79% daily decline, with bullish MACD signals and strong support at $0.78 amid positive Ouroboros LEIOS development news.
Cardano (ADA) Tests $0.95 Resistance as LEIOS Upgrade Accelerates Development
ADA price trades at $0.92 despite 2.97% daily decline. Technical indicators show bullish momentum while Cardano's 24/7 development initiative drives optimism.
Cardano (ADA) Breaks Above $0.93 as Cup-and-Handle Pattern Targets $1.00
ADA price surges 3.95% to $0.93 with bullish momentum building as technical analysts spot classic cup-and-handle formation pointing toward $1.00.
Cardano (ADA) Surges Past $0.89 as LEIOS Development Accelerates
ADA price climbs 0.51% to $0.89 amid continuous development momentum and federal blockchain speculation, with technical indicators showing strong bullish trend.
Cardano (ADA) Holds Above $0.89 as LEIOS Development Accelerates
ADA price trades at $0.89 (+0.81% daily) with bullish momentum building as Cardano launches 24/7 global development for LEIOS upgrade
Cardano (ADA) Surges 3.94% as Full Decentralization Milestone Attracts Institutional Interest
ADA trades at $0.89 with strong bullish momentum as Cardano achieves complete decentralization, while technical indicators suggest further upside potential.
Cardano (ADA) Holds $0.84 as Bulls Eye Strong Resistance at $1.02
ADA price maintains bullish momentum at $0.84 with 2% daily gains, while technical indicators suggest potential breakout above key resistance levels.
Cardano (ADA) Holds $0.83 Despite Governance Milestone and ETF Optimism
ADA price trades at $0.83 with neutral momentum as Cardano achieves full decentralization while Grayscale ETF approval odds reach 87% ahead of October deadline.
Cardano (ADA) Tests Key Support at $0.82 as Decentralization Milestone Offsets Market Weakness
ADA trades at $0.82 (-1.05% in 24h) near critical support levels, with full decentralization achievement and Fed rate cut signals battling technical headwinds.
Cardano (ADA) Price Consolidates Near $0.82 as Technical Indicators Show Mixed Signals
ADA trades at $0.82 with neutral RSI at 46.80, while Cardano technical analysis reveals potential support test ahead as momentum indicators turn bearish.
ADA Price Holds Above Support at $0.82 as Technical Indicators Flash Mixed Signals
Cardano trades at $0.82 after a 1.61% daily decline. ADA RSI shows neutral momentum while key support levels remain intact for potential recovery.
Cardano (ADA) Faces Mixed Signals as Chang Hard Fork Approaches - Technical Analysis
ADA trades at $0.83 with neutral RSI at 48.96 as traders weigh upcoming Chang hard fork against bearish MACD signals and recent scaling milestone achievements.
Cardano (ADA) Drops 1.3% as Bears Test $0.78 Support Level
ADA trades at $0.82 with RSI at 46.90 showing neutral momentum. Key support at $0.78 faces pressure despite recent ETF optimism and upcoming Chang hard fork.
Cardano (ADA) Price Falls 3.5% Despite Bullish Whale Activity - Technical Analysis Shows Key Support Test
ADA price drops to $0.80 (-3.53% in 24h) as technical indicators flash mixed signals while whales accumulate over 130 million tokens, setting up potential breakout scenario.
Cardano (ADA) Price Fights Key Resistance at $0.83 Amid Chang Hard Fork Progress
ADA price trades at $0.83 facing resistance despite bullish Node 9.1.0 progress and rising ETF approval odds to 87%. Technical indicators show mixed signals.
Cardano (ADA) Consolidates at $0.83 as Leios Launch and ETF Approval Fuel Long-term Optimism
ADA price holds steady at $0.83 (+0.33%) despite mixed technical signals, while Cardano's Leios scaling milestone and 87% ETF approval odds create bullish backdrop.
Cardano (ADA) Price Drops 4.6% as U.S. Government Blockchain Exclusion Triggers Selling Wave
ADA trades at $0.83 after falling below key $0.90 support, with technical indicators showing mixed signals amid recent government blockchain initiative exclusion.
Cardano (ADA) Consolidates Below $0.90 as Bulls Face Critical Resistance Test
ADA trades at $0.85 (-1.82%) despite August's 10% rally, with mixed signals as the token approaches key resistance levels while regulatory clarity boosts sentiment.
Cardano (ADA) Retreats After Breaking $1 Barrier Despite Whale Accumulation
ADA trades at $0.91 after a 5.91% daily drop, pulling back from its recent breakthrough above $1 amid continued institutional interest and whale activity.
Cardano (ADA) Hits $0.95 After 10% Rally - Whale Accumulation Drives Price Surge
ADA trades at $0.95 following whale accumulation of 200M+ tokens and SEC staking clarity, with technical indicators showing strong bullish momentum despite recent pullback.
Cardano (ADA) Pullback at $0.91 After Triangle Breakout - Resistance Test in Focus
ADA trades at $0.91 (-3.40% today) after breaking multi-month triangle pattern. Key resistance at $1.02 becomes critical test for continuation.
Cardano (ADA) Consolidates Near $1 After Breaking Multi-Month Triangle Pattern
ADA price trades at $0.93 following yesterday's surge to $0.9990, with technical indicators showing overbought conditions but strong bullish momentum intact.
Cardano (ADA) Hits $0.96 After 14% Daily Surge – Can Bulls Break $1 Resistance?
ADA rallies 14.23% to $0.96 as Cardano's RSI signals overbought conditions above 72, with key resistance at $1 ahead following treasury vote momentum.
Cardano (ADA) Breaks Key $0.80 Resistance: Bulls Target $1.30 as Community Approves $71M Upgrade
ADA surges 8.56% to $0.84, breaking above crucial $0.80 threshold with RSI at 62 and MACD showing bullish momentum following community's $71M upgrade approval.
Cardano (ADA) Price Retreats to $0.78 After Breaking $0.80 Resistance
ADA trades at $0.78 (-5.28% in 24h) as profit-taking emerges following last week's bullish breakout above key resistance levels, with technical indicators showing mixed signals.
Cardano (ADA) Surges Past $0.82 as Bulls Target $0.90 Resistance
ADA trades at $0.82 (+1.43% daily) after breaking $0.75 resistance, with technical indicators suggesting continued bullish momentum toward $0.90 target.
Cardano (ADA) Breaks $0.80 Resistance as $71M Community Upgrade Fuels Bullish Momentum
ADA trades at $0.81 with 0.97% daily gains after breaking key resistance levels. Community-approved $71M upgrade package and technical breakouts signal potential rally ahead.
Cardano (ADA) Holds Strong Above $0.80 as Bulls Eye Next Resistance Level
ADA trades at $0.80 (+0.68% daily) with technical indicators showing bullish momentum following $71M upgrade approval and recent 11.80% weekly surge.
Cardano (ADA) Surges 7.76% as Community Approves $71M Development Package
ADA price climbs to $0.79 following community approval of massive funding proposal and whale accumulation signaling potential $1.00 target ahead.
Cardano (ADA) Shows Mixed Signals at $0.74 - Key Resistance Test Ahead
ADA price trades at $0.74 with 2.70% daily gains, but technical indicators reveal conflicting signals as Cardano approaches critical resistance levels.
ADA Price Drops 4.3% as Cardano Tests Critical Support at $0.68
Cardano (ADA) trades at $0.72 after a 4.3% decline, with technical indicators showing bearish momentum as the token approaches key support levels.
** Cardano (ADA) Eyes $2 Target Despite Mixed Signals at $0.73
** ADA trades at $0.73 with 2.5% daily gains as technical patterns suggest bullish breakout potential while momentum indicators show conflicting signals.
Cardano (ADA) Drops 8.3% as Bears Test Critical Support at $0.71
ADA price falls to $0.72 amid bearish momentum, testing key support levels while technical indicators signal oversold conditions may present opportunity.
Cardano (ADA) Price Falls to $0.77 Despite Starstream Upgrade Success
ADA trades at $0.77 (-3.58% in 24h) as technical indicators show mixed signals despite successful Starstream upgrade implementation boosting network functionality.
Cardano (ADA) Price Slides 5% Despite Strong Bullish Trend - Key Levels to Watch
ADA price drops to $0.79 (-5.16%) in 24h trading despite maintaining strong bullish trend above key moving averages, with RSI neutral at 56.44
Cardano (ADA) Tests $0.80 Support as Bulls Face Resistance Near $0.94
ADA price drops 3.82% to $0.80 amid mixed technical signals, with RSI holding neutral territory while MACD shows bearish momentum divergence.
Cardano (ADA) Tests $0.94 Resistance After ETF Surge – Will Bulls Break Through?
ADA trades at $0.83 after Grayscale's ETF application sparked a 15.7% rally. Technical indicators show mixed signals as Cardano approaches key resistance levels.
Cardano (ADA) Eyes $0.94 Resistance After ETF Speculation Drives 15.7% Rally
ADA trades at $0.82 following Grayscale's ETF application catalyst. Technical indicators show bullish momentum with key resistance at $0.94 ahead.
Cardano (ADA) Price Retreats to $0.80 as ETF Euphoria Cools Down
ADA price dips 2.77% to $0.80 despite recent ETF speculation surge, with technical indicators suggesting potential bullish continuation above key support levels.
ADA Price Holds $0.80 Despite 3% Daily Drop - Cardano Technical Analysis Points to Bullish Momentum
ADA price trades at $0.80 following a -3.12% decline, but technical indicators suggest underlying bullish momentum as Cardano maintains key support levels.
Cardano (ADA) Rallies to $0.88 as Institutional Adoption Fuels 15% Weekly Surge
ADA price surges to $0.88 amid institutional adoption and cross-chain integration plans, though RSI signals overbought conditions at 82.84
ADA Price Surges 3% to $0.85 as Cardano Foundation Reports $659M in Assets
ADA trades at $0.85 with bullish momentum despite overbought RSI conditions. EMURGO's payment card announcement and strong financial transparency drive investor confidence.
Cardano (ADA) Surges 15% on Institutional Adoption and Cross-Chain Integration Plans - Technical Analysis Shows Strong Bullish Momentum
Cardano rockets 15% as EMURGO launches Cardano Card, Tokeo Wallet plans XRP integration, and Foundation reveals $659M in assets. RSI at 79 signals potential continuation.
Cardano (ADA) Surges to $0.83 Amid EMURGO Card Launch and Cross-Chain Partnerships - July 2025 Analysis
ADA hits $0.83 with strong bullish momentum as EMURGO announces Cardano Card for real-world payments and Tokeo Wallet plans XRP Ledger integration.
Cardano (ADA) Surges Amid Strategic Partnerships and Institutional Confidence
Cardano (ADA) gains momentum with a 15% price surge to $0.86, driven by partnerships, increased adoption, and bullish technical indicators. Here's what you need to know.
Cardano (ADA) Surges on Partnerships, Institutional Adoption, and Technical Upgrades
Cardano (ADA) gains momentum with a 15% price surge, driven by strategic partnerships, institutional-grade upgrades, and adoption milestones. Here’s what’s next for ADA.
Cardano (ADA) Surges with Institutional Inflows and DeFi Growth: Price Eyes $1 Breakout
Cardano (ADA) is gaining traction with a 30% price surge, institutional adoption, and a bullish technical outlook. Discover how ADA's advancements and roadmap position it for growth.
Cardano (ADA) Gains Momentum: Institutional Interest, Partnerships, and Bullish Signals
Cardano (ADA) rallies with institutional interest, key partnerships, and bullish technical signals. Network upgrades and ecosystem growth position ADA for a potential breakout.
Cardano (ADA) Surges Amid Bullish Momentum, Institutional Interest, and Key Partnerships
Cardano (ADA) rallies 19.57% in a week, driven by bullish technicals, institutional adoption, and partnerships with NASA and UNDP. Experts eye $1.83 as the next target.
Cardano (ADA) Eyes Breakout as Institutional Interest and Technical Indicators Align
Cardano (ADA) is gaining momentum with a 5.92% daily surge to $0.73. Institutional interest, network upgrades, and bullish technical indicators hint at a potential breakout.
Cardano (ADA) Surges 12.82%: Is It Time to Buy or Brace for Volatility?
** Cardano's (ADA) price has climbed to $0.71, up 12.82% in 24 hours. With weak bullish momentum and critical resistance at $0.84, is ADA poised for a breakout or pullback?

Four Reasons Why Cardano’s ADA Price is Surging
Cardano’s cryptocurrency ADA has been on a tear this month, doubling in price since the start of February—here are four reasons why the ADA price is surging.
ADA Price Surges to $0.50 as Cardano Inches Closer to DeFi with Mary Hard Fork
The ADA token price is up nearly 50% this week as Cardano inches closer to DeFi following the blockchain’s successful Mary hard fork upgrade.
ADA Price Surges Over 100% As Cardano Goguen Update Set For March
The ADA price surged by over 100% this week and with Cardano’s Goguen update and functional smart contract integration set for March, ADA’s price rally looks far from over
Bitcoin Adoption in Africa Sees Massive Surge as P2P Volumes Hit All-Time Highs
Crypto analyst Kevin Rooke has revealed that Bitcoin is having a field day as peer to peer (P2P) volumes are hitting all-time highs (ATHs) as a 2.5-fold surge has been experienced since March. Some of the African nations leading the pack include Kenya, South Africa, Nigeria, and Ghana, as the Bitcoin being traded weekly has exceeded $1 million.
Examining the Costs of AI Video Generation Platforms: A Comprehensive Breakdown
Analyze the costs of AI video generation platforms like Leonardo.AI, DeepAI, and InVideo. Learn about plans, features, and pricing to make an informed choice.
NVIDIA Unveils AI-Powered Log Analysis System with Multi-Agent Architecture
NVIDIA introduces a self-corrective AI log analysis system using multi-agent architecture and RAG technology, enhancing debugging and root cause detection for QA and DevOps teams.
Mindgrasp: Everything You Need to Know
Mindgrasp is an AI platform aiding in document analysis, summarization, and learning, with unique features that set it apart from Otter.ai, Quillbot, and Homeworkify.
NVIDIA Uses Generative AI to Streamline CVE Analysis at an Enterprise Scale
NVIDIA is leveraging generative AI to streamline the process of scanning and patching software vulnerabilities at an enterprise scale.
ALGO Price Prediction: Technical Setup Points to $0.15 Target by January 2025
Algorand technical analysis reveals oversold conditions with ALGO price prediction targeting $0.15 recovery by January 2025 amid mixed analyst forecasts.
ALGO Price Prediction: Targeting $0.16-0.19 Recovery Despite Current Weakness - December 2025 Forecast
ALGO price prediction suggests potential 33-58% upside to $0.16-0.19 range despite current bearish momentum, with critical support at $0.12 determining direction.
ALGO Price Prediction: Targeting $0.16-$0.19 Recovery Within 30 Days as Technical Indicators Signal Bullish Reversal
ALGO price prediction suggests a potential 14-36% upside to $0.16-$0.19 range within 30 days, driven by oversold RSI conditions and emerging MACD bullish divergence.
ALGO Price Prediction: Targeting $0.16-$0.19 Recovery Within 2-4 Weeks as Technical Indicators Signal Oversold Bounce
ALGO price prediction shows potential 23-46% upside to $0.16-$0.19 targets as oversold RSI and bullish MACD divergence suggest near-term recovery from current $0.13 support.
ALGO Price Prediction: Targeting $0.16-$0.19 Within 4 Weeks as Technical Recovery Signals Emerge
ALGO price prediction points to 14-36% upside potential with targets at $0.16-$0.19 as bullish MACD momentum and oversold conditions suggest recovery from current $0.14 levels.
ALGO Price Prediction: $0.16 Target as Technical Recovery Takes Shape - December 2025 Forecast
ALGO price prediction targets $0.16 in the near term as oversold conditions and bullish MACD divergence signal potential 23% upside from current $0.13 levels.
ALGO Price Prediction: Targeting $0.18-$0.19 Recovery by January 2025
Algorand shows signs of technical recovery with ALGO price prediction suggesting potential 28-36% gains to $0.18-$0.19 range amid bullish MACD momentum and oversold conditions.
ALGO Price Prediction: $0.19 Target Within 30 Days as Technical Recovery Emerges
ALGO price prediction suggests potential 36% upside to $0.19 within 30 days as bullish MACD momentum and oversold RSI conditions align for Algorand's technical recovery.
ALGO Price Prediction: Oversold Bounce to $0.14 Expected Within 1 Week
ALGO price prediction targets $0.14 recovery within one week as RSI hits oversold levels at 29.93, with medium-term Algorand forecast ranging $0.12-$0.17.
ALGO Price Prediction: Algorand Eyes $0.18 Recovery Despite Technical Weakness - December 2025 Forecast
ALGO price prediction shows potential bounce to $0.18 resistance despite current bearish momentum, with medium-term Algorand forecast targeting $0.25-$0.49 range by year-end.
ALGO Price Prediction: $0.19-$0.24 Target by Year-End as Technical Recovery Signals Emerge
ALGO price prediction shows potential 27-60% upside to $0.19-$0.24 range as MACD histogram turns bullish and analysts eye technical recovery momentum for Algorand.
ALGO Price Prediction: Targeting $0.19-$0.24 Range by December 2025 Amid Technical Recovery Signals
Algorand technical analysis reveals bullish momentum building with MACD histogram turning positive. ALGO price prediction targets $0.19-$0.24 range in coming weeks.
ALGO Price Prediction: Targeting $0.176 by December 2025 Despite Bearish Momentum
ALGO price prediction suggests a potential 25% upside to $0.176 within 30 days, though current bearish momentum and $0.13 support test create near-term risks.
ALGO Price Prediction: $0.19 Target by December 2025 Despite Current Bearish Momentum
Algorand faces mixed signals with RSI at 30.59 and strong analyst targets of $0.30. Current support at $0.13 critical for bullish reversal toward $0.19-$0.23 range.
ALGO Price Prediction: $0.30 Target by December 2025 Despite Current Technical Weakness
ALGO price prediction shows bullish potential to $0.30 by year-end despite trading at $0.14. Algorand forecast suggests 114% upside if key resistance breaks.
ALGO Price Prediction: Targeting $0.165 Breakout Within 7 Days Despite Near-Term Bearish Momentum
ALGO price prediction suggests potential recovery to $0.165 resistance despite current bearish signals, with critical $0.14 support determining direction.
ALGO Price Prediction: Targeting $0.17-$0.21 Recovery by December 2025
ALGO price prediction shows potential 13-40% upside to $0.17-$0.21 range within 4-6 weeks, despite current bearish momentum signals requiring break above $0.16 resistance.
ALGO Price Prediction: Targeting $0.21 by December 2025 Despite Current Bearish Momentum
ALGO price prediction suggests a recovery to $0.21 within 4-6 weeks, despite current technical weakness, as multiple analysts maintain bullish medium-term forecasts.
ALGO Price Prediction: Targeting $0.21 Recovery Within 30 Days Despite Recent Volatility
ALGO price prediction shows potential recovery to $0.21 resistance level within one month, supported by emerging bullish MACD momentum despite current consolidation phase.
ALGO Price Prediction: Targeting $0.21 Breakout Within 30 Days Despite Current Weakness
ALGO price prediction shows potential recovery to $0.21 resistance level within one month, despite current 8.47% daily decline to $0.16 support zone.
ALGO Price Prediction: Targeting $0.21 Breakout Within 30 Days Despite Neutral Momentum
ALGO price prediction analysis reveals a potential move to $0.21 resistance within the next month, with current technical indicators showing mixed signals at the $0.18 pivot level.
ALGO Price Prediction: Targeting $0.23 by November 14th Despite Current Bearish Signals
Despite strong sell signals, ALGO price prediction models suggest potential recovery to $0.23 within a week, with long-term targets reaching $0.38 by year-end.
ALGO Price Prediction: Targeting $0.24-0.28 Breakout Within 4 Weeks Despite Mixed Signals
ALGO price prediction shows potential 33-55% upside to $0.24-0.28 range as bullish MACD momentum builds, though analysts remain divided on short-term direction.
Algorand Technical Analysis: ALGO Tests Key Support at $0.19 Amid Broader Crypto Weakness
ALGO price drops 2.8% to $0.19 as technical indicators signal neutral momentum while broader cryptocurrency markets face selling pressure in absence of major catalysts.
ALGO Price Recovers 6.4% Despite Bitcoin's Weekly Decline as Oversold Conditions Drive Technical Bounce
Algorand price climbs to $0.19 as technical indicators signal oversold bounce, outperforming broader crypto market amid Bitcoin's continued weakness below $108K resistance.
ALGO Tests $0.18 Support as Fed Rate Hike Weighs on Risk Assets
Algorand price trades at $0.18 amid broader crypto selloff following Federal Reserve's 0.25% rate increase, with technical indicators suggesting further downside risk.
ALGO Tests Lower Bollinger Band at $0.18 as Bitcoin Downturn Weighs on Crypto Markets
Algorand trades at $0.18 after Bitcoin's 5% weekly decline pressures altcoins, with ALGO price testing critical technical support levels amid mixed ecosystem signals.
ALGO Trading Update: Algorand Shows Signs of Recovery Despite Recent 8.8% Weekly Decline
ALGO price currently sits at $0.21 with a 2.78% daily gain, as technical indicators suggest potential support level formation despite broader weekly losses.
ALGO Price Drops 1.75% as Technical Indicators Flash Mixed Signals
Algorand trades at $0.20 after declining 1.75% in 24 hours, with ALGO RSI at 34.28 suggesting potential oversold conditions while momentum indicators remain bearish.
ALGO Price Falls 4% as Algorand Tests Critical Support at $0.21
Algorand (ALGO) trades at $0.21 after a 4.08% decline, with technical indicators showing bearish momentum as the token approaches key support levels.
Algorand (ALGO) Technical Analysis: Testing Critical Support at $0.20 as Bearish Momentum Builds
ALGO price trades at $0.22, down 0.05% in 24h, with technical indicators signaling potential breakdown below key support levels as bearish momentum accelerates.
ALGO Price Tests Lower Support at $0.22 as Technical Indicators Signal Caution
Algorand trades at $0.22 with bearish momentum emerging as ALGO RSI sits at 37.98 and price approaches critical support levels on declining volume.
ALGO Price Drops 8.94% as Algorand Tests Key Support at $0.20
Algorand (ALGO) trades at $0.21 after an 8.94% decline, approaching critical support levels with bearish momentum indicators signaling potential further weakness.
ALGO Price Holds Critical $0.24 Support as Algorand Shows Mixed Technical Signals
Algorand (ALGO) trades at $0.24 amid neutral momentum indicators, with key resistance at $0.26 and support holding at $0.22 in sideways market action.
ALGO Price Retreats to $0.23 as Technical Indicators Show Mixed Signals
Algorand trades at $0.23 after a 2.61% daily decline, with ALGO RSI at 46.35 suggesting neutral momentum while MACD hints at potential bullish divergence.
ALGO Price Analysis: Algorand Shows Mixed Signals at $0.24 Support Zone
ALGO trades at $0.24 (-1.10% daily) with bullish MACD momentum conflicting with neutral RSI. Key resistance at $0.26 could determine next move for Algorand.
ALGO Price Soars 5.66% as Algorand Technical Analysis Shows Strong Bullish Momentum
Algorand (ALGO) trades at $0.25 with 5.66% daily gains. Technical indicators signal continued upside potential as ALGO approaches key resistance levels.
ALGO Price Holds $0.23 as Technical Indicators Signal Mixed Momentum for Algorand
Algorand trades at $0.23 (-1.27%) as technical analysis reveals neutral RSI and emerging bullish MACD signals amid key resistance at $0.26.
ALGO Price Shows Bullish Momentum Despite Quiet News Week - Technical Analysis
Algorand trades at $0.24 with 4.02% daily gains as ALGO RSI sits neutral at 48.11, while MACD histogram signals emerging bullish momentum for traders.
ALGO Price Falls to $0.23 as Trading Volume Drops Despite Weekly Gains
Algorand (ALGO) trades at $0.23 after a 5.11% daily decline, though technical indicators suggest potential bullish momentum despite reduced market conviction.
ALGO Price Consolidates at $0.24 as Algorand Shows Mixed Technical Signals
Algorand trades at $0.24 after a 3.82% decline, with ALGO RSI at neutral 50.95 while MACD histogram signals potential bullish momentum ahead.
ALGO Price Surges 3.95% as Algorand Technical Analysis Reveals Strong Bullish Momentum
Algorand (ALGO) trades at $0.25 with bullish signals emerging as technical indicators suggest potential breakout above key resistance levels.
ALGO Price Holds $0.24 Support as Algorand Shows Mixed Technical Signals
Algorand trades at $0.24 with slight 0.87% daily gain, while technical indicators reveal neutral RSI and emerging bullish momentum despite limited trading volume.
ALGO Price Holds Above $0.24 as Bullish Momentum Indicators Signal Potential Reversal
Algorand trades at $0.24 (+2.19% daily) with MACD histogram turning positive and key support levels intact, suggesting bullish continuation potential.
Algorand (ALGO) Price Holds $0.24 as User Adoption Surges 34%
ALGO trades at $0.24 (+0.63% daily) with neutral RSI at 48.02. Monthly active users hit yearly high while technical indicators suggest sideways consolidation ahead.
ALGO Price Analysis: Algorand Trades at $0.23 as Mixed Technical Signals Paint Complex Picture
ALGO price sits at $0.23 with 1.25% gains, but technical indicators show conflicting signals as Algorand hovers between key support and resistance levels.
ALGO Price Analysis: Algorand Shows Mixed Signals at $0.23 Support Level
Algorand (ALGO) trades at $0.23 with bullish long-term trend but bearish momentum indicators suggesting caution for short-term traders.
Algorand (ALGO) Price Tests Critical $0.23 Support as Technical Indicators Signal Mixed Momentum
ALGO trades at $0.23 amid neutral RSI signals and descending pennant formation, with traders eyeing potential volatility ahead as momentum indicators show bearish divergence.
ALGO Price Holds Steady at $0.23 Amid Partnership News and Technical Uncertainty
Algorand trades at $0.23 with 1.39% daily gains following XBTO partnership announcement, while technical indicators show mixed signals for ALGO's near-term direction.
Algorand (ALGO) Tests Critical $0.23 Support as Bearish Pennant Signals Volatility Ahead
ALGO price hovers at $0.23 after recent bearish signals, with descending pennant pattern suggesting potential breakout volatility by mid-September.
ALGO Price Holds $0.23 as Algorand Shows Mixed Technical Signals
ALGO trades at $0.23 with 2.05% daily gains despite bearish momentum indicators. Technical analysis reveals key resistance at $0.28 with neutral RSI at 44.
Algorand (ALGO) Tests Critical $0.22 Support as Bears Target Lower Levels
ALGO trades at $0.23 (-1.30% daily) near crucial support levels, with technical indicators flashing mixed signals as traders watch for pennant breakout
Algorand (ALGO) Faces Support Test at $0.24 as Technical Indicators Signal Mixed Outlook
ALGO price trades at $0.24 (-0.42% today) with RSI neutral at 44 and key support levels being tested as momentum indicators show bearish divergence.
Algorand (ALGO) Holds $0.23 Support as Traders Eye Pennant Breakout
ALGO trades at $0.24 after defending key support levels, with technical indicators showing mixed signals as a pennant pattern approaches resolution in mid-September.
Algorand (ALGO) Price Tests $0.23 Support as Descending Pennant Pattern Forms
ALGO trades at $0.23 amid bearish reversal signals, with traders watching a descending pennant pattern that could trigger volatility by mid-September.
Algorand (ALGO) Shows Recovery Signs Despite 6.73% Daily Drop - Critical Support Test at $0.24
ALGO trades at $0.24 after a 6.73% decline, but bullish indicators suggest potential recovery as the token tests key support levels near Bollinger Band lows.
Algorand (ALGO) Consolidates Near $0.25 as RSI Signals Neutral Territory
ALGO price holds steady at $0.25 despite slight 24h decline, with technical indicators showing mixed signals as traders watch key support at $0.24.
ALGO Price Analysis: Algorand Shows Mixed Signals Despite 4.7% Daily Decline
ALGO trades at $0.25 after 4.68% drop, but technical indicators suggest consolidation phase with bullish undertones as RSI holds neutral territory.
ALGO Price Surges 3.67% as Algorand Shows Strong Bullish Momentum
ALGO trades at $0.27 with bullish technicals across multiple timeframes. Algorand shows strong momentum above key moving averages with clear resistance targets ahead.
ALGO Price Surges 4.64% as Algorand Technical Analysis Shows Strong Bullish Momentum
ALGO price climbs to $0.29 with bullish MACD signals and RSI in neutral territory. Algorand testing key resistance levels after breaking above multiple moving averages.
ALGO Price Fights Back to $0.25 Despite Tether USDT Withdrawal Announcement
Algorand (ALGO) trades at $0.25 after recovering from Tether's USDT cessation news, showing resilience with technical indicators suggesting potential upside momentum.
ALGO Price Surges 3% as Bullish Technical Signals Point to $0.30 Breakout
Algorand (ALGO) trades at $0.27 with strong momentum indicators suggesting potential rally to immediate resistance at $0.30 as RSI remains in neutral territory.
ALGO Price Recovers to $0.26 Despite Tether USDT Withdrawal Concerns
Algorand trades at $0.26 after recovering from Tether's USDT withdrawal announcement, with technical indicators showing mixed signals as bulls defend key support levels.
Algorand (ALGO) Price Eyes $0.2880 Resistance After 5% Recovery Rally
ALGO trades at $0.27 with bullish momentum after recovering from Tether USDT withdrawal news. Technical indicators suggest upside potential despite recent profit-taking.
Algorand (ALGO) Rallies 4.6% Despite Tether USDT Withdrawal – Can Bulls Break $0.31 Resistance?
ALGO trades at $0.24 with 4.6% daily gains as bulls fight back against Tether's USDT withdrawal announcement, testing crucial resistance levels ahead.
ALGO Price Recovers to $0.25 as Algorand Bulls Fight Back Despite Tether USDT Withdrawal
Algorand trades at $0.25 (+5.25% in 24h) as bulls attempt recovery following Tether's USDT withdrawal announcement, with technical indicators showing mixed signals.
ALGO Price Tests Critical $0.22 Support as Tether Withdrawal Looms
Algorand trades at $0.24 (-0.80%) as USDT withdrawal concerns weigh on sentiment, but technical indicators suggest potential bullish breakout ahead.
ALGO Price Tests Critical $0.24 Support as Tether Exit Weighs on Algorand
Algorand trades at $0.24 (-0.84%) as USDT withdrawal creates headwinds, but technical indicators suggest potential recovery ahead of roadmap release.
ALGO Price Tests $0.26 Support as Algorand Bulls Fight Technical Resistance
Algorand trades at $0.26 (+1.50% daily) amid mixed signals as USDT withdrawal concerns clash with emerging bull flag pattern ahead of roadmap unveiling.
ALGO Price Drops 6% as Algorand Faces Technical Resistance at $0.27
ALGO trades at $0.25 (-6.09% daily) with RSI at 48.86 signaling neutral momentum, while recent Tether USDT withdrawal creates near-term headwinds for Algorand.
ALGO Price Faces Key Support Test at $0.27 Despite Recent 30% Rally Fading
Algorand trades at $0.27 after a 6.13% decline, testing critical support levels while technical indicators show mixed signals following last week's impressive surge.
ALGO Price Drops 5.34% Despite Strong Bullish Trend - Key Support at $0.18
Algorand (ALGO) trades at $0.27 after a 5.34% decline, but technical indicators suggest underlying bullish momentum remains intact with strong support levels ahead.
ALGO Price Rebounds 3.24% Despite Recent Market Correction - Technical Analysis Shows Mixed Signals
Algorand (ALGO) trades at $0.28, up 3.24% in 24h, recovering from recent decline to $0.2675. Technical indicators show neutral RSI but bearish MACD momentum ahead.
Algorand (ALGO) Breaks Above $0.27 as Bullish Momentum Builds
ALGO price surges 5.39% to $0.27 amid strong bullish signals, with technical indicators suggesting further upside potential despite mixed momentum readings.
ALGO Price Retreats to $0.26 Despite Strong Network Growth and Exchange Integrations
Algorand trades at $0.26 after pulling back from recent highs, while technical indicators show mixed signals amid major platform integrations and upcoming USDT withdrawal.
ALGO Price Analysis: Algorand Shows Bullish Momentum Despite Recent Consolidation at $0.27
ALGO trades at $0.27 with strong technical indicators pointing to continued upside after recent 30% surge driven by network upgrades and staking expansion.
ALGO Price Surges 30% Despite Tether Exit Concerns - Technical Analysis Shows Overbought Conditions
Algorand (ALGO) trades at $0.29 after a 30% surge to $0.32, driven by staking expansion and network upgrades, though RSI indicates overbought conditions.
Algorand Price Surges 30% - ALGO Tests Key $0.34 Resistance After Binance Staking Launch
ALGO trades at $0.30 (+3.43% today) with RSI at 74, showing overbought conditions as network upgrades and new staking opportunities drive bullish momentum toward resistance.
Algorand (ALGO) Surges 33% Following Technical Breakout and Major Exchange Staking Launch
ALGO breaks multi-month resistance with 33% surge, driven by staking launches on Binance and Crypto.com plus Wormhole integration. Technical analysis reveals strong bullish momentum.
Algorand (ALGO) Surges 30% Following Major Exchange Staking and Wormhole Integration
ALGO rallies over 30% to $0.29 as Binance and Crypto.com launch staking services while Wormhole integration enhances cross-chain capabilities despite Tether withdrawal.
Algorand (ALGO) Surges Amid Network Growth and Staking Expansion: Price Outlook for 2025
Algorand (ALGO) surged 30% following network upgrades and new staking opportunities on Binance and Crypto.com. Despite challenges like Tether’s USDT withdrawal, the outlook remains bullish.
Algorand (ALGO) Surges with Fedwire Adoption and DeFi Growth: Is $0.35 Next?
Algorand hits a 4-month high of $0.30, driven by Fedwire’s ISO 20022 adoption and DeFi momentum. Will bullish technicals sustain the breakout or lead to a pullback?
Algorand (ALGO) Soars Amid Fedwire Adoption and DeFi Surge but Faces Short-Term Price Pressure
Algorand (ALGO) reached a 4-month high, fueled by Fedwire’s ISO 20022 adoption and DeFi growth. However, analysts predict slight short-term price declines.
Algorand (ALGO) Surges 30% Amid Staking, Cross-Chain Growth, and Technical Breakout
Algorand (ALGO) gains 30% as staking launches on Binance and Crypto.com, Wormhole integration boosts interoperability, and technical indicators signal bullish momentum.
Algorand (ALGO) Surges Over 30% Amid Staking Launch, Network Growth, and Technical Breakout
Algorand (ALGO) has surged 30%+ this week, fueled by increased network activity, staking launches on major exchanges, and a bullish technical trend.
Algorand (ALGO) Gains Momentum Amid Staking Launch and Technical Growth
Algorand (ALGO) sees bullish momentum with staking launch on Binance and Crypto.com, cross-chain integration, and short-term price gains. Analysts remain cautiously optimistic amid market volatility.
Algorand (ALGO) Gains Momentum: Staking Expansion, Interoperability Boost, and Market Insights
Algorand (ALGO) sees positive momentum with staking launched on Binance and Crypto.com, Wormhole integration improving multi-chain transfers, and a price climb to $0.22.
Glassnode's Weekly Altcoin Insights: Navigating Crypto's Volatile Frontier
Glassnode releases its 25th edition of The Altcoin Vector, offering expert analysis on altcoin market trends and high-conviction setups.
Glassnode Unveils In-Depth Analysis in 'The Altcoin Vector #23'
Glassnode releases the 23rd edition of 'The Altcoin Vector', providing professional insights into altcoin markets and high-conviction setups.
Glassnode Unveils Latest Altcoin Insights in Weekly Report
Glassnode's latest report offers professional insights into altcoin markets, highlighting high-conviction setups and volatility analysis for informed trading decisions.
Glassnode Delivers Insightful Analysis in Altcoin Vector Report
Glassnode's Altcoin Vector #28 offers professional insights into the altcoin market, highlighting high-conviction setups and market analysis, according to their latest report.
Weekly Insights Highlight Altcoin Market Dynamics
Explore the latest altcoin market trends with Glassnode's professional-grade insights, focusing on high-conviction setups in the crypto space.
Glassnode's Altcoin Vector Offers Insight into Crypto's Volatile Frontier
Glassnode's Altcoin Vector #29 provides professional-grade insights into the altcoin market, identifying high-conviction setups and offering exclusive weekly reports for crypto enthusiasts.
Glassnode Offers Insights into Altcoin Market Trends
Glassnode's latest report highlights high-conviction setups in altcoin markets, providing professional-grade insights into crypto's volatile frontier.
Altcoin Market Insights: High-Conviction Setups in Focus
Explore the latest insights into altcoin markets with Glassnode's report, highlighting high-conviction setups and professional-grade analysis on crypto's most volatile frontier.
Glassnode's Altcoin Vector Report Offers In-Depth Market Analysis
Glassnode's latest Altcoin Vector report delivers professional-grade insights into the altcoin market, highlighting high-conviction setups and offering comprehensive analysis on Bitcoin, Ethereum, and DeFi.
Top 3 Coins to Watch this Week: BTC, LUNA, and MANA
With the market still looking weak, here are the top three coins to pay attention to this week.
APT Price Prediction: Aptos Eyes $2.35-$2.60 Recovery Despite Bearish Sentiment Through January 2025
APT price prediction shows potential 40-55% upside to $2.35-$2.60 range as oversold RSI and bullish MACD histogram signal near-term recovery from current $1.68 levels.
APT Price Prediction: Oversold Bounce Targets $2.35-$2.60 Within 2 Weeks
APT price prediction shows potential 32-46% upside to $2.35-$2.60 range as RSI at 31.56 indicates oversold conditions, but critical $1.82 support must hold.
APT Price Prediction: Oversold Bounce to $2.35-$2.60 Target Within 14 Days
APT price prediction shows potential 34-48% bounce from oversold RSI levels, targeting $2.35-$2.60 resistance zone as bulls attempt recovery from 52-week lows.
APT Price Prediction: Recovery to $2.35-$2.60 Expected Within 7-14 Days
APT price prediction shows oversold RSI at 28.18 signals potential bounce to $2.35-$2.60 range, though bearish momentum persists with key resistance at $2.39.
APT Price Prediction: Oversold Bounce to $2.60 Target Within 2 Weeks
APT price prediction shows potential recovery from oversold RSI of 23.98, targeting $2.60-$2.90 resistance zone as Aptos tests critical $1.71 support level.
APT Price Prediction: Oversold Bounce to $2.92 Target Within 2-3 Weeks
APT price prediction shows potential rebound from oversold RSI of 29.88 to test $2.92 resistance, with critical support at $1.81 determining direction.
APT Price Prediction: Oversold Bounce to $2.60-$2.90 Expected Within 2 Weeks
Aptos shows oversold RSI at 30.03 with analyst targets ranging $1.60-$2.26. Technical analysis suggests potential bounce to $2.60-$2.90 range before testing major resistance.
APT Price Prediction: Aptos Eyes $1.67-$2.26 Range as Oversold Conditions Signal Potential Reversal
APT price prediction shows bearish targets of $1.67-$2.26 in the next 1-2 weeks, but oversold RSI at 24.44 suggests potential bounce toward $2.92 resistance level.
APT Price Prediction: Oversold Bounce to $2.40-$2.60 Expected Within 2 Weeks
Aptos (APT) trades at $1.83 with RSI at 21.07 signaling extreme oversold conditions. Technical analysis suggests bounce to $2.40-$2.60 range likely within 2 weeks.
APT Price Prediction: Oversold Bounce Targets $2.50-$2.80 Within 7-14 Days
APT price prediction shows oversold RSI at 28.85 indicating potential bounce to $2.50-$2.80 range. Aptos forecast suggests recovery from 52-week lows with key resistance at $2.39.
APT Price Prediction: $2.50-$2.80 Recovery Target Within 2 Weeks as Oversold Conditions Signal Bounce
APT price prediction targets $2.50-$2.80 recovery over next two weeks as RSI oversold conditions and Bollinger Band positioning suggest potential bounce from current levels.
APT Price Prediction: Oversold Bounce to $2.50-$2.80 Expected Within 1-2 Weeks
APT price prediction shows potential recovery from oversold levels at $2.28, targeting $2.50-$2.80 range as RSI bounces from 29.75. Critical support holds at $2.19.
APT Price Prediction: Bearish Momentum Targets $2.12 by Late November 2025
APT price prediction shows bearish momentum continuing with technical indicators pointing to $2.12 target by November 24, 2025, as RSI hits oversold territory.
APT Price Prediction: Bearish Short-Term to $2.26, Recovery Potential to $3.50 by December 2025
APT price prediction shows bearish momentum targeting $2.26 support, but Aptos forecast suggests recovery potential to $3.50-$4.00 range if key resistance breaks.
APT Price Prediction: Targeting $3.20-$3.35 Recovery Within 2-3 Weeks Despite Near-Term Consolidation
APT price prediction points to $3.20-$3.35 upside target over 2-3 weeks as MACD shows early bullish divergence, though immediate consolidation around $2.80 expected before breakout.
APT Price Prediction: Aptos Eyes $3.32 Target Amid Mixed Technical Signals - November 2025 Forecast
APT price prediction targets $3.32 short-term based on algorithmic analysis, while technical indicators show neutral RSI at 41.83 with emerging bullish MACD momentum despite broader bearish pressures.
APT Price Prediction: Targeting $3.50-$4.00 Recovery Over Next 30 Days Despite Near-Term Weakness
APT price prediction points to potential 22-40% upside to $3.50-$4.00 range within 30 days as technical indicators signal oversold bounce, though immediate resistance at $3.51 poses challenge.
APT Price Prediction: Targeting $3.50-$4.00 Recovery by December 2025
APT price prediction points to $3.50-$4.00 medium-term target as MACD shows bullish momentum despite recent 5.33% decline. Critical support at $2.39.
APT Price Prediction: Target $3.50-$4.00 by Late November Despite Current Bearish Pressure
APT price prediction shows potential recovery to $3.50-$4.00 range within 2-3 weeks as MACD histogram turns bullish, though immediate support at $2.39 remains critical.
APT Price Prediction: Targeting $3.50 by November 2025 Despite Short-Term Bearish Headwinds
APT price prediction points to $3.50 upside potential by late November, though immediate bearish pressure could test $2.45 support levels first.
APT Price Prediction: Targeting $3.54 Within 10 Days Despite Mixed Technical Signals
Aptos forecast shows potential for 18% upside to $3.54 in the near term, while analysts debate whether APT can break above $3.65 resistance or fall to $2.48 support levels.
APT Price Prediction: Target $2.48 Short-Term as Bearish Pressure Intensifies Through December 2025
APT price prediction points to $2.48 target within 1-2 weeks as technical indicators and analyst consensus suggest continued downside pressure through December 2025.
APT Tests Multi-Month Low at $3.18 as Oversold Conditions Build Amid Crypto Market Weakness
Aptos price hits $3.18 support level with RSI at 31, down 4.6% in 24h as technical indicators suggest potential bounce from oversold territory amid broader market pressure.
APT Tests 52-Week Low at $3.18 as Technical Indicators Signal Oversold Conditions
Aptos (APT) trades at its 52-week low of $3.18, up 1.1% today, as RSI hits 30 and price approaches lower Bollinger Band support amid weak market sentiment.
APT Price Tests 52-Week Low at $3.20 as Bitcoin Decline Pressures Altcoin Market
Aptos (APT) trades at $3.20, marking its 52-week low, as Bitcoin's broader market decline continues to weigh on alternative cryptocurrencies across the sector.
Aptos Market Alert: APT Consolidates Below Key Moving Averages Amid Mixed Signals
APT price trades at $4.25 (+3.71%) as Aptos faces critical resistance near $4.78 while technical indicators show neutral momentum in tight consolidation pattern.
Aptos (APT) Hovers Near Support at $4.11 as Bears Test Key Levels
APT price stabilizes at $4.11 with neutral RSI signals, but technical indicators suggest potential downside risk as the token trades near critical support zones.
APT Price Drops 4.4% as Aptos Tests Critical Support at $4.12
APT price falls to $4.12, testing key support levels while technical indicators suggest oversold conditions may present buying opportunities for risk-tolerant traders.
APT Price Struggles Below Key Moving Averages as Bearish Momentum Builds
APT trades at $4.33 with bearish MACD signals and RSI at 44.94. Technical indicators suggest further downside risk toward $4.11 support levels.
APT Price Hovers Near Support as Aptos Shows Mixed Technical Signals at $4.30
Aptos (APT) trades at $4.30 with neutral momentum, testing key support levels while RSI suggests potential oversold bounce opportunity for traders.
APT Price Drops 8.5% as Aptos Tests Critical Support at $4.18
Aptos (APT) trades at $4.27 after an 8.5% daily decline, with technical indicators showing mixed signals as the token approaches key support levels.
APT Price Holds Above $4.60 as Technical Indicators Flash Mixed Signals
Aptos (APT) trades at $4.67 with modest 0.49% gains as RSI sits neutral at 56.51, while MACD shows bullish momentum despite approaching resistance levels.
Aptos (APT) Breaks Above Key Moving Averages as Bullish Momentum Builds
APT price hits $4.69 with 0.80% daily gains, breaking above multiple SMAs while RSI signals neutral zone with room for upside potential ahead.
APT Price Analysis: Aptos Shows Weak Bullish Momentum at $4.65 Resistance
APT trades at $4.65 (+1.20% in 24h) with RSI at 56.09 in neutral zone. Technical indicators suggest potential breakout above $4.78 resistance level.
APT Price Surges 4.92% as Aptos Rallies Toward $4.75 Resistance After Expo 2025 Momentum
APT price climbs to $4.62 (+4.92%) as technical indicators show bullish momentum while traders eye the $4.75 resistance level following Expo 2025 partnership news.
Aptos (APT) Price Analysis: Neutral Consolidation at $4.39 Amid Mixed Technical Signals
APT price trades sideways at $4.39 with neutral momentum indicators suggesting potential breakout direction depends on key support and resistance levels.
Aptos (APT) Struggles at $4.40 Despite Recent All-Time High - Key Levels to Watch
APT trades at $4.40 (+1.85% in 24h) but faces resistance despite hitting $12.66 ATH on September 13th. Neutral RSI and mixed signals suggest consolidation ahead.
APT Price Analysis: Aptos Shows Mixed Signals at $4.40 Support Test
APT trades at $4.40 after a 4.2% decline, testing critical support levels while technical indicators reveal conflicting bullish and bearish signals for traders.
APT Price Faces Resistance at $4.75 as Aptos Technical Indicators Flash Mixed Signals
APT price trades at $4.60 (-2.04% in 24h) near Bollinger Bands upper resistance while ecosystem integrations drive underlying bullish momentum despite analyst warnings.
APT Price Breaks Above Bollinger Bands as Aptos Ecosystem Integrations Drive Bullish Momentum
APT trades at $4.71 (+4.32% daily) with technical indicators showing bullish divergence. Recent NEAR cross-chain integration and Aave milestone fuel optimism despite neutral trend.
APT Price Targets $4.80 Resistance as Aptos Shows Weak Bullish Momentum
Aptos (APT) trades at $4.50 with 0.74% daily gains, testing upper Bollinger Band resistance while RSI remains neutral at 53, signaling potential breakout ahead.
Aptos (APT) Hovers Near Neutral Territory as Bulls and Bears Battle at $4.48
APT price trades at $4.48 with 2% daily gains, but technical indicators show mixed signals as Aptos faces key resistance at $4.82 in choppy market conditions.
APT Price Holds Steady at $4.47 Despite Bullish Ecosystem Developments
Aptos trades at $4.47 (+1.89%) as technical upgrades and partnerships boost ecosystem growth, while APT RSI signals neutral momentum with key resistance at $4.82.
APT Price Consolidates at $4.33 as Aptos Shows Mixed Technical Signals
Aptos (APT) trades at $4.33 with +2% daily gains, but technical indicators reveal conflicting signals as the token remains below key moving averages.
APT Price Hovers at $4.26 as Aptos Shows Mixed Technical Signals
Aptos (APT) trades at $4.26 with modest 0.90% daily gains, but technical indicators reveal conflicting signals as RSI remains neutral while MACD shows bearish momentum.
Aptos (APT) Price Drops 3% as Technical Indicators Flash Mixed Signals
APT trades at $4.21 after a 3.02% decline, with RSI at 42.77 suggesting neutral momentum while key support levels remain intact at $4.05-$4.11.
APT Price Holds $4.33 as Aptos Tests Critical Support Levels
APT trades at $4.33 with modest 0.93% gains, but technical indicators suggest caution as the token approaches key support zones near $4.05-$4.11.
APT Price Consolidates at $4.27 as Aptos Shows Neutral Technical Signals
APT price remains flat at $4.27 with neutral RSI at 44.39, while key support at $4.05 and resistance at $4.95 define critical trading levels for Aptos.
Aptos (APT) Price Analysis: Neutral Momentum at $4.32 Despite Expo 2025 Partnership Boost
APT trades at $4.32 with neutral technical signals as Expo 2025 partnership drives adoption gains against bearish exchange flow indicators.
Aptos (APT) Faces Bearish Pressure Despite Technical Upgrades - Price Analysis at $4.34
APT trades at $4.34 with mixed signals as recent scalability upgrades clash with bearish market sentiment and negative technical momentum indicators.
APT Price Analysis: Aptos Faces Bearish Pressure Despite Technical Upgrades at $4.23
APT trades at $4.23 (-2.40%) as recent technical upgrades clash with bearish market momentum. Key support at $4.14 under pressure.
APT Price Hovers Near $4.33 as Aptos Shows Mixed Technical Signals
Aptos (APT) trades at $4.33 with neutral momentum as technical indicators show conflicting signals between support at $4.18 and resistance at $5.15.
APT Price Drops 1% as Aptos Tests Critical Support at $4.18
Aptos (APT) trades at $4.27 with bearish momentum signals emerging. Key support at $4.18 holds while RSI shows neutral conditions at 43.27.
Aptos (APT) Price Struggles Below $4.50 as Technical Indicators Signal Bearish Momentum
APT trading at $4.32 (-2.51% in 24h) faces mounting selling pressure despite recent exchange listing and technical milestones on the blockchain network.
Aptos (APT) Struggles at $4.42 as Token Unlock Creates Selling Pressure
APT trades at $4.42 (+0.34%) despite recent 4% decline and $54M token unlock event. Technical indicators show bearish momentum with key support at $4.05.
APT Price Analysis: Aptos Holds Above $4.50 Amid Neutral Market Signals
APT trades at $4.60 after a 5.33% daily decline, with technical indicators showing mixed signals as Aptos battles key support levels around $4.05.
APT Price Rallies 3% as Aptos Shows Weak Bullish Momentum Above Key Support
APT price climbs to $4.82 with 3.12% gains as Aptos technical analysis reveals neutral RSI and bullish MACD divergence, testing critical resistance levels.
Aptos (APT) Price Drops 6.4% After $52M Token Unlock Despite Recent Bullish Momentum
APT trades at $4.74 after falling 6.38% following an 11.31 million token unlock worth $52.1 million, testing key support levels despite neutral RSI readings.
Aptos (APT) Surges 6% as Bulls Regain Control Above $5
APT price climbs to $5.12 with strong momentum indicators signaling potential continuation of bullish trend despite approaching key resistance levels.
APT Price Rallies 3.75% as Aptos Shows Mixed Technical Signals Above $4.75
Aptos (APT) trades at $4.75 with 3.75% daily gains, but technical indicators suggest cautious optimism as APT faces key resistance near $5.00.
APT Price Hovers Near $4.58 as Aptos Shows Mixed Technical Signals
Aptos trades at $4.58 with neutral momentum as APT RSI sits at 48.95, while technical indicators suggest potential volatility ahead for traders.
Aptos (APT) Holds Above $4.70 Despite Impending $52M Token Unlock
APT trades at $4.75 with weak bullish momentum as markets brace for 11.31M token unlock tomorrow, potentially offsetting recent institutional gains.
Aptos (APT) Faces Correction After Reaching $4.70 Despite RWA Milestone
APT currently trades at $4.70 after a 3.37% daily decline, testing key support levels following recent institutional demand surge that drove 7% weekly gains.
APT Price Surges 6.7% as Aptos Shows Bullish Momentum Above Key Moving Averages
APT price climbs to $4.82 with strong volume of $37M on Binance. Technical indicators signal potential continuation as MACD turns bullish despite neutral RSI.
APT Price Shows Mixed Signals as Aptos Trades at $4.49 Amid Neutral Technical Setup
Aptos (APT) trades at $4.49 with 5.65% daily gains, but technical indicators paint a complex picture with bearish momentum despite recent bullish price action.
APT Price Analysis: Aptos Struggles Near $4.22 as Bears Control Key Levels
APT trades at $4.22 with neutral momentum despite 0.55% daily gains. Technical indicators show mixed signals as Aptos tests critical support zones.
APT Price Analysis: Aptos Shows Neutral Momentum at $4.18 Amid Technical Consolidation
APT trades at $4.18 with -2.74% daily decline. Technical indicators show neutral RSI at 36.74 while Aptos approaches key support levels around $4.05.
Aptos (APT) Price Struggles Near $4.25 as Bearish Momentum Builds
APT price trades at $4.25 (+1.65% daily) but technical indicators show bearish momentum with RSI at 36.70 and price approaching lower Bollinger Band support levels.
APT Price Shows Consolidation Near $4.19 as Technical Indicators Signal Potential Reversal
Aptos (APT) trades at $4.19 with neutral momentum as RSI approaches oversold territory and price action consolidates near key support levels.
APT Price Drops 2.7% as Aptos Tests Critical Support at $4.11
Aptos (APT) trades at $4.17 after a 2.66% decline, with technical indicators showing oversold conditions as the token approaches key support levels.
APT Price Drops 5.47% as Aptos Tests Critical Support Near $4.19
Aptos (APT) trades at $4.32 after a 5.47% decline, with technical indicators suggesting oversold conditions as the token approaches key support levels.
APT Price Struggles at $4.61 as Technical Indicators Flash Mixed Signals
Aptos (APT) trades at $4.61 with 1.14% daily gains, but bearish MACD and RSI below 50 suggest caution despite recent recovery attempts from key support levels.
APT Price Drops 3.5% as Aptos Tests Critical Support at $4.45
Aptos (APT) trades at $4.50 after a 3.49% decline, with technical indicators showing bearish momentum as the token approaches key support levels.
APT Price Drops 4% as Bearish Technical Signals Override Recent Bullish Momentum
Aptos (APT) trades at $4.68 after a 3.96% decline, with technical indicators showing weakening momentum despite last week's 3% surge driven by bullish analysis.
APT Price Consolidates Near $4.78 as Aptos Shows Weak Bullish Signals
Aptos (APT) trades at $4.78 with minimal 24h movement. Technical indicators suggest consolidation phase with neutral RSI at 45.90 and mixed momentum signals.
APT Price Rallies 5.11% as Aptos Tests Critical $4.77 Support Level
APT price surged 5.11% to $4.77 amid neutral RSI signals, with key resistance at $5.66 and strong support holding at $4.36 for potential breakout.
APT Price Faces $4.36 Support Test as Technical Indicators Flash Mixed Signals
Aptos (APT) trades at $4.54 after a 5.68% daily decline, testing key support levels despite recent WBTC integration boosting network adoption.
Aptos (APT) Price Drops 6.56% Despite Recent Bullish Momentum - Technical Analysis
APT trades at $4.67 after a 6.56% decline, testing support levels despite earlier 9% gains. Technical indicators suggest mixed signals for short-term direction.
APT Price Surges 3% as Aptos Technical Analysis Reveals Strong Bullish Momentum
Aptos (APT) trades at $5.45 with a 3.08% daily gain as technical indicators signal continued upward momentum despite approaching key resistance levels.
Aptos Price Surges 1.87% as APT Tests Key Resistance at $5.61
APT price climbs to $5.40 with bullish momentum building, but faces critical resistance test that could determine next directional move for Aptos traders.
Aptos (APT) Technical Analysis: Weak Bullish Trend Emerges Despite Limited Market Activity in July 2025
APT trades at $5.29 with weak bullish signals as technical indicators show mixed momentum. RSI at 64.74 suggests potential for continued upside movement.
Aptos (APT) Breaks Out of Falling Wedge Pattern: Analysts Target $13.5 Rally Despite Recent Pullback
APT surged 8.09% breaking multi-month falling wedge, but faced 3.33% pullback. Technical indicators remain bullish with analysts eyeing $13.5 target amid token unlock event.
Aptos (APT) Surges Amid Institutional Growth and RWA Expansion: Price Holds Above $5
Aptos (APT) gains momentum with institutional adoption and RWA growth, holding above $5. Key technical indicators suggest bullish momentum despite market risks.
Aptos (APT) Gains Momentum: Price Holds Above $5 Amid Adoption and Institutional Growth
Aptos (APT) surges above $5 with a 5.1% daily increase, driven by institutional adoption, RWA growth, and bullish market trends. Explore key insights and price outlook.
Aptos (APT) Gains Institutional Momentum Amid Mixed Market Signals
Aptos (APT) sees strong institutional adoption and RWA tokenization, driving growth despite bearish price predictions and token unlocks. Is APT headed for a rebound?
Aptos (APT) Gains Momentum with Institutional Adoption and RWA Growth Amid Token Unlock
Aptos (APT) is on the rise with institutional adoption and a surge in real-world asset (RWA) tokenization. Despite a recent token unlock, APT shows strong growth potential.
Aptos (APT) Gains Momentum with Institutional Adoption and RWA Growth Amid Token Unlock Event
Aptos (APT) surges in institutional adoption as its RWA TVL climbs 56%, boosted by strategic partnerships and a token unlock event. Explore market trends and trading insights.
Aptos (APT) Surges in Institutional Adoption Amid Token Unlock Event: What Traders Should Know
Aptos (APT) sees soaring adoption in real-world assets (RWA) and major partnerships, but a token unlock of 11.31M APT may cause short-term volatility. Read on for insights.
Aptos (APT) Technical Analysis: Wyoming Stablecoin Partnership Fuels Bullish Momentum at $4.60
Aptos (APT) trades at $4.60 with +1.23% gains as Wyoming selects it for WYST stablecoin. Technical indicators show neutral RSI at 49.01 with key resistance at $5.30. Is now the time to buy APT?
ARB Price Prediction: Targeting $0.24 Recovery Within 2 Weeks After $0.19 Support Test
ARB price prediction suggests a potential dip to $0.19 support before recovering to $0.24 target within two weeks, based on bullish MACD momentum and key resistance levels.
ARB Price Prediction: Targeting $0.24-$0.31 Recovery Despite Near-Term Weakness Through January 2025
ARB price prediction shows potential 9-41% upside to $0.24-$0.31 range if $0.22 support holds, though short-term bearish pressure may test $0.17 levels first.
ARB Price Prediction: Arbitrum Eyes $0.31 Recovery Target as Technical Indicators Signal Potential 41% Upside
ARB price prediction points to $0.31 medium-term target with 41% upside potential if $0.22 support holds, while technical analysis shows mixed signals for December recovery.
ARB Price Prediction: Targeting $0.24-$0.26 Recovery Within 2 Weeks
Arbitrum shows signs of bottoming near $0.21 with bullish MACD momentum emerging. ARB price prediction suggests recovery to $0.24-$0.26 range by late December 2025.
ARB Price Prediction: Targeting $0.24 Recovery by Mid-December 2025 Despite Near-Term Weakness
ARB price prediction suggests a potential recovery to $0.24 within two weeks, though immediate downside risk to $0.19 support remains as Arbitrum battles oversold conditions.
ARB Price Prediction: Targeting $0.25-$0.27 Recovery by January 2026 Despite Near-Term Bearish Pressure
ARB price prediction shows potential 13-22% upside to $0.25-$0.27 by January 2026, though short-term weakness may test $0.19 support first.
ARB Price Prediction: Targeting $0.28-$0.31 Rally After Testing $0.22 Support
ARB price prediction shows potential 27-41% upside to $0.28-$0.31 range if current $0.22 support holds, with bullish MACD divergence supporting recovery thesis.
ARB Price Prediction: Oversold Bounce to $0.24 Target Within 2 Weeks
ARB price prediction shows oversold RSI at 29.94 signaling potential bounce to $0.24 resistance, while analyst forecasts remain bearish with $0.153-$0.196 targets.
ARB Price Prediction: December Recovery Target $0.28-$0.31 Amid Technical Oversold Bounce
Arbitrum shows oversold RSI at 31.18 with bullish MACD divergence targeting $0.28-$0.31 recovery by late December, but must hold $0.19 critical support.
ARB Price Prediction: Targeting $0.31 Resistance with $0.22 Pivot Hold Through December 2025
ARB price prediction shows potential 41% upside to $0.31 if current $0.22 support holds, with technical indicators suggesting cautious optimism for December recovery.
ARB Price Prediction: Targeting $0.19-$0.31 Range as Technical Indicators Signal Mixed Outlook Through December 2025
ARB price prediction shows bearish analyst consensus at $0.15-$0.21, but technical momentum hints at potential recovery toward $0.31 resistance if $0.22 pivot holds.
ARB Price Prediction: Targeting $0.31 Resistance Break by December 2025
ARB price prediction shows mixed signals with analyst targets ranging from $0.166-$0.215. Technical analysis suggests potential move to $0.31 if current support holds.
ARB Price Prediction: Oversold Bounce to $0.24 Expected Before December Drop to $0.16
ARB price prediction shows potential relief rally to $0.24 from extreme oversold levels, but medium-term Arbitrum forecast targets $0.16 amid bearish momentum.
ARB Price Prediction: Oversold Bounce to $0.24 Expected Within 7 Days
ARB price prediction shows potential recovery to $0.24 after extreme oversold conditions. Technical analysis suggests short-term bounce despite bearish analyst forecasts.
ARB Price Prediction: Targeting $0.20-$0.25 Range With Potential Break to $0.30 by December 2025
Arbitrum shows mixed signals at $0.22 support. ARB price prediction suggests consolidation between $0.20-$0.25 with potential December breakout targeting $0.30.
ARB Price Prediction: Targeting $0.185 by November 21st Amid Bearish Technical Setup
ARB price prediction points to $0.185 downside target within days as technical indicators flash bearish signals with 73% negative sentiment and extreme fear conditions.
ARB Price Prediction: Targeting $0.35-$0.43 Recovery After Testing $0.20 Support
ARB price prediction suggests short-term decline to $0.20 support before potential recovery to $0.35-$0.43 range driven by ecosystem growth and oversold conditions.
ARB Price Prediction: Testing Critical $0.23 Support - Next Move Could Define Direction Through December
Arbitrum faces crucial test at $0.23 support with mixed signals. Short-term target $0.235-$0.255, but token unlock risk could push ARB lower to $0.21 range.
ARB Price Prediction: Targeting $0.255 Recovery Despite Current Weakness - Technical Rebound Expected by End November
ARB price prediction shows potential recovery to $0.255 in the next 7-10 days as oversold conditions and bullish divergence signals suggest accumulation phase beginning.
ARB Price Prediction: Bearish Outlook Targets $0.235 Support as Downtrend Continues Through December 2025
ARB price prediction shows continued bearish pressure with analysts targeting $0.235 in the short term, while technical analysis suggests potential drop to $0.23 support level.
ARB Price Prediction: Targeting $0.35-$0.43 by December 2025 Amid Token Unlock Pressure
ARB price prediction suggests potential rally to $0.35-$0.43 range by December 2025, but November 16 token unlock could trigger near-term correction to $0.23 support.
ARB Price Prediction: Targeting $0.43 by December 2025 Amid Mixed Technical Signals
ARB price prediction points to $0.43 medium-term target despite near-term consolidation risk around $0.23 support as Arbitrum forecast shows diverging analyst views.
ARB Tests Critical Support at $0.31 as Bearish Momentum Builds Amid Broader Crypto Selloff
Arbitrum price drops 3.6% to $0.31 as technical indicators signal continued downward pressure, with RSI at 36 and MACD showing bearish divergence in absence of major catalysts.
ARB Price Stabilizes at $0.31 After $19B Crypto Liquidation Event Triggers Market-Wide Sell-Off
Arbitrum (ARB) trades at $0.31 following massive liquidation event that rocked crypto markets, as traders assess technical damage and potential recovery signals.
ARB Price Drops to $0.31 as $20B Crypto Liquidation Event Triggers Market-Wide Selloff
Arbitrum (ARB) trades at $0.31 following massive liquidation cascade and Trump tariff announcement, testing critical support near Bollinger Band lower boundary.
Arbitrum Shows Independence as ARB Holds Above 200-Day Moving Average Despite Market Weakness
ARB trades at $0.41, down 2.16% but maintaining support above its 200-day moving average at $0.40 while broader crypto markets face pressure
Arbitrum Price Action: Technical Indicators Signal Mixed Signals Despite 1.08% Daily Gain
ARB price holds at $0.42 with modest gains while technical analysis reveals conflicting momentum signals and key support levels being tested.
ARB Price Tests Critical Support at $0.42 as Arbitrum Shows Mixed Technical Signals
Arbitrum (ARB) trades at $0.42 with -1.70% daily decline. Technical analysis reveals oversold conditions near Bollinger Band support, but momentum indicators remain bearish.
Arbitrum (ARB) Tests Lower Support at $0.42 as Bears Take Control
ARB price drops 5.12% to $0.42, approaching critical support levels with RSI at 34.37 signaling potential oversold conditions for the layer-2 token.
ARB Price Hovers Near Support at $0.44 as Bearish Momentum Builds
Arbitrum (ARB) trades at $0.44 with bearish MACD signals, though RSI suggests oversold conditions may present buying opportunities for patient traders.
ARB Price Drops to $0.43 After 92.65M Token Unlock - Arbitrum Technical Analysis
ARB trades at $0.43 (-0.65% daily) following major token unlock. RSI at 36.31 signals oversold conditions while price tests critical support levels.
ARB Price Drops 11% as Arbitrum Faces Token Unlock Pressure
ARB trades at $0.44 after an 11.29% decline, with technical indicators suggesting further downside risk following the recent 92.65 million token unlock event.
ARB Price Analysis: Arbitrum Shows Mixed Signals at $0.50 Support Level
ARB trades at $0.50 with neutral RSI at 48.14, showing consolidation near key support as bearish MACD signals conflict with overall bullish trend structure.
ARB Price Drops 3.9% as Arbitrum Tests Critical Support at $0.47
Arbitrum (ARB) trades at $0.50 after a 3.9% decline, testing key support levels while technical indicators show mixed signals in neutral territory.
Arbitrum (ARB) Holds $0.52 Despite Major Token Unlock as Bulls Eye $0.58 Resistance
ARB price maintains $0.52 support level following 92.65M token unlock, with technical indicators suggesting potential rally toward $0.58 resistance zone.
ARB Price Surges 5.19% Despite Major Token Unlock - Technical Analysis Points to Continued Strength
Arbitrum (ARB) trades at $0.52 with 5.19% daily gains, showing resilience after 92.65 million token unlock. Technical indicators suggest bullish momentum continues.
ARB Price Tests Critical Support at $0.49 as Technical Indicators Signal Mixed Momentum
ARB price trades at $0.49 with bearish MACD signals despite maintaining position above 200-day moving average, creating crucial trading setup for Arbitrum investors.
Arbitrum (ARB) Faces Selling Pressure as 92.65M Token Unlock Hits Markets
ARB trades at $0.49 (+1.02%) with neutral RSI at 47.47 as major token unlock introduces potential selling pressure despite positive Ethereum ETF inflows.
Arbitrum (ARB) Faces Token Unlock Pressure Despite Trading 30% Above Predictions
ARB price sits at $0.50 after a 6.23% decline, with 92.65 million tokens set to unlock tomorrow creating potential selling pressure despite bullish fundamentals.
ARB Price Holds Above $0.50 Despite 4% Daily Decline as Bulls Eye Key Resistance
Arbitrum trades at $0.53 after a 4.12% decline, but technical indicators show mixed signals with ARB RSI neutral and strong support levels intact below.
** ARB Price Surges 5.90% as Arbitrum Faces Major Token Unlock This Weekend
** Arbitrum trades at $0.55 with strong bullish momentum, but 92.65 million ARB tokens set to unlock September 16 could create selling pressure for traders.
Arbitrum (ARB) Eyes $0.62 Resistance as Technical Indicators Flash Bullish Signals
ARB trades at $0.52 (+1.04%) with strong bullish momentum emerging as Arbitrum technical analysis reveals oversold conditions and key resistance tests ahead.
Arbitrum (ARB) Price Holds $0.52 Despite Token Unlock Pressure - Technical Analysis Shows Mixed Signals
ARB trades at $0.52 with neutral RSI at 53.57 as traders weigh upcoming 92.65M token unlock against strong ecosystem growth and Robinhood partnership rumors.
Arbitrum (ARB) Price Faces Critical Test as Token Unlock Looms Despite Technical Strength
ARB trades at $0.52 with 3.75% daily gains, but upcoming September 16 token unlock creates selling pressure concerns that could override bullish technical signals.
Arbitrum (ARB) Price Faces Mixed Signals as Token Unlock Looms Amid Partnership Speculation
ARB trades at $0.49 (-0.12% daily) as Robinhood partnership rumors drive optimism while September 16 token unlock creates selling pressure
ARB Price Holds $0.50 Support as Arbitrum Shows Mixed Signals Despite Strong Bullish Trend
ARB trades at $0.50 with +0.71% daily gains. Arbitrum's RSI sits neutral at 49.97 while technical indicators show conflicting momentum signals for traders.
Arbitrum (ARB) Price Analysis: Token Unlock Concerns Overshadow Robinhood Partnership Buzz
ARB trades at $0.49 (-3.61% in 24h) as upcoming 92.65M token unlock on Sept 16 creates selling pressure despite recent Robinhood partnership rumors driving 30% gains.
ARB Technical Analysis Shows Mixed Signals as Arbitrum Price Holds Above Key Support
ARB price trades at $0.50 with neutral momentum indicators, while technical analysis reveals Arbitrum positioned between critical support and resistance levels.
Arbitrum (ARB) Price Breaks Above $0.50 as Bulls Target Key Resistance
ARB price surges 2.59% to $0.50 with strong momentum indicators suggesting potential breakout above critical resistance levels in the coming sessions.
ARB Price Struggles at $0.49 as Arbitrum Faces Mixed Technical Signals
Arbitrum (ARB) trades at $0.49 with -2.70% decline amid neutral RSI and bearish MACD divergence, testing critical support levels near $0.47.
ARB Price Analysis: Arbitrum Shows Mixed Signals at $0.50 Support Level
ARB trades at $0.50 with neutral RSI at 50.69, showing bearish MACD divergence while maintaining position above 200-day moving average in consolidation phase.
ARB Price Surges 2.15% to $0.51 as Arbitrum Technical Indicators Signal Mixed Momentum
Arbitrum (ARB) trades at $0.51 with 2.15% daily gains, showing neutral RSI at 51.53 while MACD suggests bearish momentum despite overall bullish trend structure.
Arbitrum (ARB) Consolidates at $0.49 as Neutral RSI Signals Potential Breakout
ARB price trades at $0.49 with neutral RSI of 49.75, suggesting consolidation phase. Technical indicators show mixed signals as Arbitrum hovers near pivot point.
ARB Price Drops 4.46% as Arbitrum Tests Critical Support at $0.49
ARB price currently trading at $0.50, down 4.46% in 24h. Technical indicators show mixed signals as Arbitrum approaches key support levels around $0.43.
ARB Price Holds Above $0.50 as Arbitrum Shows Mixed Technical Signals
Arbitrum (ARB) trades at $0.52 with modest 1.57% gains, displaying neutral RSI and bullish long-term trend despite near-term momentum concerns.
Arbitrum (ARB) Holds $0.52 Despite Token Unlock Pressure - Technical Analysis Shows Mixed Signals
ARB trades at $0.52 with -2.85% daily decline following massive token unlock. Technical indicators suggest neutral momentum despite recent selling pressure.
ARB Price Surges 9.4% as Arbitrum Technical Analysis Shows Strong Bullish Momentum
ARB trades at $0.53 with 9.43% daily gains as technical indicators signal continued upside potential toward $0.58 resistance level.
Arbitrum (ARB) Breaks Six-Month Consolidation - Can Bulls Push Above $0.58 Resistance?
ARB trades at $0.53 after breaking multi-month consolidation. Technical indicators show bullish momentum despite 4.43% daily decline ahead of token unlock.
Arbitrum (ARB) Surges 15.72% to $0.56 Despite Token Unlock Pressure
ARB price hits $0.56 with 15.72% daily gains as technical indicators turn bullish, but 92.65M token unlock on August 16 creates near-term headwinds for momentum.
Arbitrum (ARB) Surges 7% to $0.47 Ahead of Major Token Unlock
ARB price climbs to $0.47 with 7% daily gains as PayPal adoption provides bullish momentum, but 92.65M token unlock looms on August 16
Arbitrum (ARB) Price Tests $0.44 Support as 92.65M Token Unlock Looms
ARB price holds $0.44 despite 4.42% daily decline, facing critical test with massive token unlock scheduled August 16 worth $41.9M threatening further downside.
ARB Price Surges 0.68% as Arbitrum Technical Analysis Shows Strong Bullish Momentum
ARB price hits $0.46 with bullish MACD signals and RSI at 60.28. Arbitrum approaches key resistance at $0.49 as technical indicators suggest continued upward momentum.
ARB Price Holds Above Key Support Despite Minor Decline - Bullish Momentum Intact
Arbitrum (ARB) trades at $0.46 with bullish MACD signals and strong positioning above critical support levels, offering strategic entry opportunities for traders.
Arbitrum (ARB) Surges 9.3% to $0.46 as Robinhood Partnership Rumors Drive Bullish Momentum
ARB price climbs 9.3% to $0.46 amid speculation about Robinhood partnership and rising TVL, while technical indicators show bullish momentum with RSI at 60.83
Arbitrum (ARB) Rebounds 7.51% to $0.42 Despite Token Unlock Concerns
ARB price recovers to $0.42 with 7.51% gains as technical indicators show mixed signals ahead of major token unlock. PayPal adoption provides bullish catalyst.
ARB Price Analysis: Arbitrum Shows Weak Bullish Momentum at $0.39 Despite Mixed Technical Signals
ARB trades at $0.39 with 2.98% daily gains, but technical analysis reveals conflicting signals as Arbitrum's RSI sits neutral while MACD shows bearish momentum.
ARB Price Drops 5% as Arbitrum Tests Critical Support at $0.37
ARB price declined 4.95% to $0.37, approaching key support levels as technical indicators signal neutral-to-bearish momentum in the Layer 2 token.
Arbitrum (ARB) Tests Key Support at $0.36 as Mixed Signals Cloud Price Outlook
ARB price rallies 3.83% to $0.39 but faces resistance near $0.51. Technical indicators show conflicting signals as Arbitrum hovers near critical support levels.
Arbitrum (ARB) Shows Bullish Signal Despite Near-Term Weakness at $0.38
ARB price holds at $0.38 with 0.54% daily gains, while technical indicators suggest mixed signals as Arbitrum trades near Bollinger Band support levels.
Arbitrum (ARB) Price Retreats to $0.37 Despite PayPal Network Adoption Boost
ARB trades at $0.37 after 4% decline, testing critical support despite recent PayPal adoption driving earlier surge to $0.45. Technical indicators suggest mixed outlook.
ARB Price Falls 6% as Arbitrum Tests Critical Support at $0.41
Arbitrum (ARB) drops to $0.41 amid bearish momentum, with technical indicators showing mixed signals as the token approaches key support levels.
ARB Price Consolidates at $0.44 After 18% Rally as Arbitrum TVL Doubles Polygon's
ARB trades at $0.44 following an 18% surge that broke key resistance, while Arbitrum's TVL surpassing $2.5 billion signals potential for further upside momentum.
Arbitrum (ARB) Price Drops 4.7% to $0.43 Despite Strong Weekly Performance
ARB trades at $0.43 after declining 4.7% today, testing key support levels while maintaining bullish momentum from recent $0.49 highs despite token unlock pressures.
** Arbitrum (ARB) Maintains $0.45 Despite Token Unlock as PayPal Integration Drives Bullish Momentum
** ARB trades at $0.45 with strong bullish signals despite 92.65M token unlock. PayPal's PYUSD expansion to Arbitrum network fuels institutional confidence.
Arbitrum (ARB) Surges 7.16% to $0.45 Despite Massive Token Unlock Looming
ARB price climbs to $0.45 with 7.16% daily gains as PayPal adoption news offsets concerns over 92.65M token unlock scheduled for August 16, 2025.
ARB Price Falls 5% Despite Strong Bullish Trend - Key Support at $0.32 in Focus
Arbitrum (ARB) trades at $0.42 after a 5.15% daily drop, but technical indicators suggest the overall bullish trend remains intact with RSI in neutral territory.
Arbitrum Price Rallies to $0.49 Despite ARB Token Unlock Pressure
ARB price reaches $0.49 with 76.53 RSI signaling overbought conditions as PayPal adoption news counters recent 92.65M token unlock selling pressure.
Arbitrum Price Surges 6% Despite Token Unlock Selling Pressure - Key Resistance at $0.51
ARB trades at $0.49 with 6.14% daily gains, showing resilience after 92.65M token unlock. Technical indicators flash overbought signals as price tests critical resistance.
Arbitrum (ARB) Analysis: Token Unlock Creates Pressure While Gemini Partnership Drives Adoption
ARB faces mixed signals as 92.65M token unlock introduces selling pressure, but Gemini's tokenized stocks listing and Latin America expansion boost adoption prospects.
Arbitrum (ARB) Surges Despite Token Unlock: Technical Analysis Shows Strong Bullish Momentum at $0.46
Arbitrum defies 92.65M token unlock pressure with 16% surge and $2.5B TVL growth. Technical indicators signal continued upside potential despite short-term headwinds.
Arbitrum (ARB) Rides Market Momentum Amid Token Unlock and Strategic Growth
Arbitrum (ARB) surged 16% to a $2B market cap despite stablecoin outflows, but a token unlock introduces selling pressure. Explore technical analysis and future outlook.
Arbitrum (ARB) Gains Momentum Amid PayPal Integration and RWA Surge Despite Security Challenges
Arbitrum (ARB) sees bullish momentum with PayPal's PYUSD integration and rising real-world asset tokenization, offsetting the impact of GMX exploits and token unlocks.
Arbitrum (ARB) Price Analysis Amid Token Unlock, Security Challenges, and Growing Adoption
Arbitrum (ARB) faces mixed market dynamics as token unlocks, security exploits, and adoption news collide. Explore its price trends, trading signals, and future outlook.
Arbitrum (ARB) Weekly Analysis: Price Surge, Security Challenges, and Market Outlook
Arbitrum (ARB) faces a mixed week with a 16% price surge, institutional adoption, and TVL growth to $2.5B, offset by major security breaches and an upcoming 92.65M token unlock.
Arbitrum (ARB) Weekly Update: Market Surges, GMX Exploit Resolved, and Expanding Global Adoption
Arbitrum (ARB) saw a dynamic week with a $2 billion market cap milestone, LatAm expansion, and a GMX exploit resolution. Explore price trends, adoption growth, and trading signals.
Arbitrum (ARB) Price Surges Amid LatAm Expansion, TVL Growth, and Security Concerns
Arbitrum (ARB) gains momentum with a 16% rally, LatAm expansion, and TVL hitting $2.5 billion. However, recent exploits raise security concerns, tempering bullish sentiment.
Arbitrum (ARB) Gains Momentum Amid LatAm Expansion, TVL Growth, and Security Concerns
Arbitrum (ARB) sees growth through LatAm initiatives, increased TVL, and Robinhood partnerships. However, security breaches pose risks despite bullish technical indicators.
Arbitrum (ARB) Price Analysis: Is the Recent 5.93% Surge Signaling a Bullish Breakout?
Arbitrum (ARB) is up 5.93% in 24 hours, trading at $0.36. With RSI near 57 and Bollinger Bands indicating strong upward momentum, is ARB poised for a breakout?
Arkham Intelligence Introduces 'First Funders' Feature for Enhanced Wallet Analysis
Arkham Intelligence's new 'First Funders' feature reveals the original funding source for EVM Non-Contract Accounts, aiding in wallet analysis and tracking.
Aster (ASTER) Faces Continued Price Struggles Around $1, Risking Further Decline
Aster (ASTER) remains under pressure near $1, with potential for further decline as technical weaknesses persist, according to CoinMarketCap.
Crypto ATM Market Expected to Hit $1.88B by 2028 with CAGR of 59.2%
The crypto ATM market is anticipated to reach $1.88 billion by 2028, according to a report by US-based consulting firm Grand View Research Inc.
ATOM Price Prediction: Cosmos Eyes $2.75 Recovery Within 6 Weeks Despite Current Weakness
ATOM price prediction shows potential recovery to $2.32 short-term and $2.75 medium-term, but critical $2.14 support must hold for bullish Cosmos forecast.
ATOM Price Prediction: Target $2.32 Short-Term, $2.75 Medium-Term Despite Neutral Momentum
ATOM price prediction shows potential recovery to $2.32 within 2 weeks, followed by $2.75 target in 4-6 weeks if critical $2.14 support holds amid mixed signals.
ATOM Price Prediction: Cosmos Eyes $1.90 Before Potential Recovery to $2.75 by January 2025
ATOM price prediction shows further downside to $1.90 support before potential bounce. Cosmos forecast suggests recovery to $2.75 target within 4-6 weeks if key levels hold.
ATOM Price Prediction: $2.30 Recovery Target Within Two Weeks Despite Bearish Headwinds
ATOM price prediction shows potential recovery to $2.30 short-term despite bearish pressure, with critical $2.14 support determining Cosmos direction through December 2025.
ATOM Price Prediction: Cosmos Eyes $2.30 Recovery Despite Bearish Undertones Through December 2025
ATOM price prediction suggests potential recovery to $2.30 short-term, though medium-term Cosmos forecast remains cautious with $1.98-$2.24 range expected through December.
ATOM Price Prediction: $2.37 Target in Focus as Cosmos Eyes 7% Rally Despite Technical Headwinds
ATOM price prediction suggests potential bounce to $2.37 despite current bearish momentum, with critical support at $2.14 determining short-term direction for Cosmos.
ATOM Price Prediction: Cosmos Eyes $3.20 Recovery After Testing Critical $2.14 Support
ATOM price prediction shows potential 35% upside to $3.20 within 4-6 weeks as Cosmos bounces from oversold levels, but must hold $2.14 support for bullish continuation.
ATOM Price Prediction: Recovery to $3.25-$3.50 Range Within 4-6 Weeks
ATOM price prediction targets $3.25-$3.50 recovery within 4-6 weeks as oversold conditions and bullish MACD divergence suggest potential 40-45% upside from current levels.
ATOM Price Prediction: Recovery to $2.90-$3.14 Expected by January 2025 Despite Near-Term Weakness
ATOM price prediction shows oversold conditions at $2.26 could trigger rebound to $2.90-$3.14 range within 4-6 weeks, though immediate downside risk to $1.98 remains active.
ATOM Price Prediction: Oversold ATOM Eyes $2.50 Recovery Target Within 2 Weeks
ATOM price prediction shows potential bounce to $2.50 from oversold RSI levels at 27.70, though bearish momentum persists. Cosmos forecast depends on breaking $2.45 resistance.
ATOM Price Prediction: $3.16 Target by December with Bullish Momentum Building
ATOM price prediction shows potential 25% upside to $3.16 resistance level within 2-4 weeks as technical indicators signal emerging bullish momentum despite recent bearish sentiment.
ATOM Price Prediction: Recovery to $3.16 Expected as Cosmos Tests Critical Support at $2.38
ATOM price prediction shows potential 25% upside to $3.16 resistance if current $2.38 support holds, with Cosmos forecast indicating mixed signals in November.
ATOM Price Prediction: Cosmos Eyes $2.28 Decline Before Potential Recovery to $2.55
ATOM price prediction shows mixed signals with analyst targets ranging from $2.28 to $2.51. Technical analysis suggests near-term weakness before potential bounce.
ATOM Price Prediction: Cosmos Eyes $3.20 Breakout Target in December 2025
ATOM price prediction shows potential 30% upside to $3.20 resistance level, with bearish risk below $2.35 support. Mixed analyst forecasts create trading opportunity.
ATOM Price Prediction: Cosmos Set for 25% Rally to $3.20 Despite Near-Term Weakness
ATOM price prediction suggests a recovery to $3.20 within 4 weeks despite current bearish pressure, with key support at $2.35 critical for bulls.
ATOM Price Prediction: Targeting $3.20 Breakout with $10+ Medium-Term Potential Through December 2025
ATOM price prediction shows immediate resistance at $3.20 with analyst targets ranging from $3.00 short-term to $10.86 medium-term as Cosmos forecast remains bullish.
ATOM Price Prediction: Targeting $3.20 Breakout Within 2 Weeks Amid Mixed Technical Signals
ATOM price prediction points to potential $3.20 resistance test within two weeks, though bearish momentum could drag Cosmos toward $2.35 support if bulls fail to materialize.
ATOM Price Prediction: Targeting $3.15 by December 2025 Despite Current Weakness
ATOM price prediction suggests a recovery to $3.15 within 4 weeks as technical indicators show early bullish momentum despite recent 2.58% decline.
ATOM Price Prediction: $4.46 Target by December 2025 as Cosmos Breaks Key Resistance
ATOM price prediction targets $4.46 in the medium term as technical analysis shows bullish momentum building despite current consolidation near $2.89 support levels.
ATOM Price Prediction: Targeting $4.71 Rally Despite Current Weakness - 30% Upside by December 2025
ATOM price prediction shows potential 64% rally to $4.71 despite bearish signals, with critical $3.40 resistance break needed for Cosmos forecast bullish continuation.
ATOM Price Prediction: Targeting $4.71 by December 2025 Despite Near-Term Consolidation
ATOM price prediction points to $4.71 short-term target with potential medium-term rally to $10.86 range despite current neutral RSI and bearish moving averages.
ATOM Price Prediction: Targeting $3.25-$4.56 by December 2025 Despite Short-Term Consolidation
ATOM price prediction shows potential 50% upside to $4.56 within 4-6 weeks, though immediate consolidation around $2.89 expected before breakout above $3.37 resistance.
ATOM Price Prediction: Cosmos Eyes $4.50 Recovery Target as Technical Indicators Signal Bullish Reversal
ATOM price prediction shows potential 50% upside to $4.50 in next 4-6 weeks as MACD turns bullish and price holds critical $2.35 support level.
ATOM Price Prediction: Targeting $4.56 by Year-End with $3.37 Immediate Resistance Test
ATOM price prediction shows bullish momentum with 17.93% daily gains. Technical analysis targets $4.56 by December 2025, with immediate resistance at $3.37 to break first.
ATOM Price Prediction: Oversold Cosmos Eyes $3.50 Recovery Target by December 2025
ATOM price prediction shows potential 35% upside to $3.50 as oversold RSI signals bounce from key support, though break below $2.35 could trigger deeper correction.
ATOM Price Prediction: Oversold Bounce to $3.80 Target Within 2 Weeks
ATOM price prediction shows potential 50% recovery to $3.80 as RSI hits extreme oversold levels at 26.40, setting up technical bounce from current $2.52 support zone.
ATOM Price Prediction: $3.33 Target Within 4-6 Weeks as Technical Indicators Signal Recovery
ATOM price prediction points to $3.33 medium-term target as bullish MACD divergence and support at $2.85 create favorable setup for Cosmos recovery over next month.
ATOM Price Prediction: $3.33 Target by December 2025 Despite Current Bearish Pressure
ATOM price prediction points to $3.33 recovery target within 4-6 weeks as technical indicators show early bullish divergence despite current weakness at $2.96 support levels.
ATOM Price Prediction: Cosmos Eyes $3.50 Breakout Target by December 2025
ATOM price prediction shows potential for 18% upside to $3.50 within 6 weeks, but bearish momentum could push Cosmos to $2.75 support if current levels fail.
ATOM Price Prediction: Cosmos Targets $11.31 by Year-End Despite Short-Term Bearish Pressure
ATOM price prediction shows mixed signals with immediate bearish pressure toward $3.20, but medium-term Cosmos forecast points to $11.31 recovery target within 2-3 months.
ATOM Price Prediction: $4.17 Target in 30 Days as Cosmos Shows Bullish Momentum
ATOM price prediction points to $4.17 medium-term target with bullish MACD momentum emerging. Cosmos technical analysis reveals key breakout potential above $3.42.
ATOM Price Prediction: $4.15 Target Within 4 Weeks as Cosmos Eyes Breakout
ATOM price prediction suggests a potential 30% upside to $4.15 within one month, with technical indicators showing oversold conditions despite bearish momentum signals.
ATOM Price Prediction: Targeting $4.35 Resistance Break Could Drive 30% Rally
ATOM price prediction shows potential for $4.35 breakout targeting $5.38 high, but bearish momentum suggests near-term weakness to $3.01 support first.
ATOM Tests $3.20 Support Zone as $19B Crypto Liquidation Event Pressures Altcoins
Cosmos (ATOM) trades at $3.23 after declining 1.95% in 24 hours, facing technical pressure following the crypto market's worst liquidation event that erased $400 billion in total value.
Cosmos ATOM Tests $3.16 Support as Broader Crypto Market Weakness Persists
ATOM price trades at $3.16 down 0.9% as cryptocurrency maintains stability despite broader market headwinds, with technical indicators suggesting consolidation phase continues.
ATOM Tests Lower Bollinger Band Support at $3.16 as Cosmos Shows Technical Oversold Signals
Cosmos (ATOM) trades at $3.16 after declining 3.07% in 24 hours, with technical indicators suggesting potential reversal as price approaches oversold territory near Bollinger Band support.
ATOM Price Drops 2.7% as Binance Security Incident Sparks Market-Wide Crypto Concerns
Cosmos (ATOM) trades at $3.18 amid broader crypto market uncertainty following yesterday's Binance trading glitch that saw major altcoins briefly drop to zero.
Cosmos ATOM Tests Key Support at $4.10 Amid Bearish Technical Signals
ATOM trades at $4.10 with modest 0.74% gains as technical indicators signal continued bearish pressure below key moving averages at $4.35-$4.47 resistance zone.
ATOM Tests Key Support as Bears Maintain Control Below Moving Averages
Cosmos ATOM trades at $4.06 with bearish momentum as price remains below all major moving averages, testing critical $3.94 support level.
ATOM Technical Breakdown: Critical Support Test Could Define Next Major Move
ATOM price trades at $4.13 with neutral RSI signaling potential reversal as Cosmos approaches key support levels that could determine the next significant price direction.
ATOM Price Tests Lower Bollinger Band Support at $4.05 as Bearish Momentum Builds
Cosmos (ATOM) trades at $4.05 (-1.79% daily) near critical support levels as technical indicators flash mixed signals for the interchain protocol.
ATOM Price Drops 2.74% as Cosmos Tests Critical Support at $4.03
Cosmos (ATOM) trades at $4.08 after falling 2.74% in 24 hours, with RSI at 34.67 signaling potential oversold conditions as the token approaches key support levels.
ATOM Price Struggles Below $4.30 as Technical Indicators Flash Mixed Signals
Cosmos (ATOM) trades at $4.22 with bearish MACD but neutral RSI suggesting potential consolidation phase ahead for traders.
ATOM Price Drops 3% as Cosmos Tests Critical Support at $4.03
Cosmos (ATOM) trades at $4.17 after a 2.96% decline, with technical indicators suggesting potential oversold bounce from key support levels.
Cosmos (ATOM) Drops 7.3% as Technical Indicators Signal Bearish Momentum
ATOM price falls to $4.17 amid weak technical signals, with RSI at 36.53 suggesting potential oversold conditions may emerge soon for Cosmos traders.
Cosmos (ATOM) Price Consolidates Near $4.50 as Technical Indicators Signal Mixed Momentum
ATOM price holds steady at $4.50 with modest 0.36% daily gains while technical analysis reveals neutral RSI conditions and key resistance approaching at $4.89.
Cosmos (ATOM) Price Drops 3.5% as Technical Indicators Signal Mixed Outlook
ATOM trades at $4.48 with bearish momentum emerging despite overall bullish trend structure remaining intact for Cosmos blockchain token.
Cosmos (ATOM) Tests Key Resistance as Technical Indicators Flash Mixed Signals
ATOM price holds steady at $4.64 (+1.51%) with bullish momentum indicators suggesting potential breakout above $4.89 resistance level.
ATOM Price Breaks Above Key Moving Averages as Cosmos Shows Strong Bullish Momentum
ATOM price trades at $4.61 with 2.54% daily gains, breaking above all major moving averages while technical indicators signal continued upward momentum for Cosmos.
Cosmos (ATOM) Price Analysis: Bulls Test $4.50 Pivot as RSI Shows Neutral Territory
ATOM trades at $4.49 (+0.85% in 24h) with technical indicators suggesting consolidation phase. Key resistance at $4.89 while support holds at $4.32.
Cosmos (ATOM) Shows Bullish Momentum Despite Neutral RSI at $4.52
ATOM price holds steady at $4.52 with bullish MACD signals emerging, while technical indicators suggest potential breakout above key resistance levels.
Cosmos (ATOM) Price Analysis: Bulls Fight Back Despite 6% Decline
ATOM price drops to $4.49 (-5.87%) but technical indicators suggest potential reversal as bulls defend key support levels around $4.32.
Cosmos (ATOM) Eyes $5 Resistance as Bulls Maintain Control Despite 1.69% Daily Decline
ATOM price holds above key support at $4.78 with technical indicators showing mixed signals as the token approaches critical resistance near $4.89 in today's session.
Cosmos (ATOM) Breaks Above Key Resistance as Bulls Target $5 Milestone
ATOM price surges 3.91% to $4.83, breaking above Bollinger Band resistance with strong momentum indicators signaling potential continuation toward $4.97 target.
Cosmos (ATOM) Price Shows Bullish Momentum Despite Slight Daily Decline
ATOM trades at $4.62 with bullish MACD signals emerging, while Cosmos technical analysis reveals strong support above $4.00 despite 0.32% daily drop.
Cosmos (ATOM) Price Surges 2.66% as Technical Indicators Flash Bullish Signals
ATOM trades at $4.67 with bullish momentum building. Technical analysis reveals strong upward pressure as Cosmos breaks above key moving averages with RSI in neutral territory.
Cosmos (ATOM) Shows Bullish Triangle Pattern With $5.26 Target Despite Recent 27% Decline
ATOM trades at $4.60 (+1.57% today) as technical analysis reveals symmetrical triangle pattern suggesting potential 30% breakout to $5.262 target level.
ATOM Price Holds $4.49 as Cosmos Shows Mixed Technical Signals
Cosmos (ATOM) trades at $4.49 with slight 0.74% daily gains. Technical analysis reveals neutral RSI at 49.48 while MACD shows bearish momentum, creating mixed signals for traders.
Cosmos (ATOM) Price Consolidates at $4.45 Amid Mixed Technical Signals
ATOM trades at $4.45 with 1.55% daily gains, showing neutral RSI at 47.99 while battling key resistance levels in sideways market action.
Cosmos (ATOM) Price Slides 2.87% as Bears Test $4.27 Support Level
ATOM trades at $4.37 after a 2.87% daily decline, with technical indicators showing neutral RSI at 45.62 and key support at $4.27 under pressure.
ATOM Price Analysis: Cosmos Breaks Above Key Support Despite Weak Momentum
ATOM price holds $4.44 as neutral RSI and bearish MACD signal mixed technical outlook for Cosmos traders seeking entry points.
Cosmos (ATOM) Price Tests $4.40 Support as Bears Take Control
ATOM price drops 0.50% to $4.41 amid neutral RSI signals, with key support at $4.27 becoming critical for maintaining bullish structure.
Cosmos (ATOM) Price Analysis: Neutral RSI Suggests Consolidation Phase Ahead
ATOM trades at $4.48 with neutral technical signals. RSI at 48.53 indicates potential sideways movement as Cosmos tests key support levels around $4.27.
Cosmos (ATOM) Price Struggles at $4.41 as Technical Indicators Signal Mixed Outlook
ATOM trades at $4.41 with bearish momentum indicators despite neutral RSI, as traders watch key support at $4.27 for potential breakdown signals.
Cosmos (ATOM) Price Analysis: Testing Support at $4.41 Amid Bearish Momentum
ATOM price trades at $4.41 (-3.04%) with RSI at 46.24 in neutral zone. Technical indicators suggest continued weakness as Cosmos tests key support levels.
Cosmos (ATOM) Price Holds $4.54 as Technical Indicators Signal Mixed Momentum
ATOM price trades at $4.54 with neutral RSI at 49.59, showing consolidation above 200-day MA while MACD signals bearish momentum in near-term trading.
Cosmos (ATOM) Price Hovers at $4.51 as Technical Indicators Signal Mixed Momentum
ATOM trades at $4.51 with -1.61% daily decline. Technical analysis shows neutral RSI at 48.85 while MACD suggests bearish momentum ahead.
ATOM Price Holds Above Key Support as Cosmos Shows Mixed Technical Signals
ATOM trades at $4.58 with neutral RSI at 50.28. Cosmos technical analysis reveals bullish MACD momentum despite recent 0.39% decline and approaching key resistance levels.
Cosmos (ATOM) Shows Bullish Momentum With RSI Neutral at $4.63
ATOM price trades at $4.63 with +1.42% daily gains. Technical indicators suggest bullish trend continuation as Cosmos breaks above key moving averages.
ATOM Price Drops 5% as Cosmos Tests Critical Support at $4.38
Cosmos (ATOM) trades at $4.42 after a 5% decline, with technical indicators showing bearish momentum as the token approaches key support levels.
Cosmos (ATOM) Price Holds $4.47 as Neutral Momentum Tests Key Support Levels
ATOM trades at $4.47 with neutral RSI at 48.20, testing critical support near $4.01 while bulls eye resistance at $4.95 for potential breakout momentum.
Cosmos (ATOM) Price Tests Key Support at $4.52 Despite 6.44% Daily Decline
ATOM price drops to $4.52 amid 6.44% decline, but technical indicators suggest potential bullish reversal as RSI holds neutral territory at 49.42.
Cosmos (ATOM) Breaks Above $4.90 as Bullish Momentum Builds
ATOM price surges 3.96% to $4.90, approaching key resistance at $4.95 with strong technical indicators signaling continued upward momentum ahead.
Cosmos (ATOM) Surges 16% Weekly as Coinbase Support Drives Bulls to $4.70
ATOM trades at $4.70 (+3.83% daily) after 16% weekly gains, supported by Coinbase ecosystem adoption and bullish technical momentum breaking key resistance levels.
ATOM Price Faces Pressure at $4.53 as Cosmos Shows Mixed Technical Signals
ATOM trades at $4.53 (-2.54% today) with neutral RSI but bullish MACD momentum as Coinbase ecosystem news provides fundamental support amid volatility.
ATOM Price Surges to $4.65 as Cosmos Breaks Key Resistance Despite Late-Session Volatility
ATOM trades at $4.65 (+0.41%) after institutional demand drove price above critical resistance, though late-hour reversals signal continued volatility ahead.
ATOM Price Holds Above $4.60 Despite Broader Market Pressure Following Coinbase Ecosystem Boost
Cosmos (ATOM) trades at $4.63, down 1.74% in 24h, but maintains bullish technical structure after recent Coinbase dYdX integration news drove ecosystem optimism.
ATOM Price Surges 4.3% as Cosmos Breaks Key Resistance Amid Coinbase Integration**
Cosmos (ATOM) trades at $4.68, up 4.32% in 24 hours, breaking above crucial resistance levels as ecosystem gains momentum from recent Coinbase developments.**
ATOM Price Breaks Above $4.40 as Cosmos Ecosystem Gains Major Exchange Support
ATOM trades at $4.47 (+3.83%) following Coinbase's native dYdX integration announcement, with technical indicators showing neutral momentum ahead of key resistance test.
ATOM Price Rebounds to $4.29 as Cosmos Shows Recovery Signs Despite Technical Headwinds
ATOM trading at $4.29 (+3.20% in 24h) after sharp recovery from $4.13 lows, but technical indicators suggest cautious optimism amid mixed signals.
ATOM Price Drops 2.7% as Bearish Momentum Intensifies Below Key Support
Cosmos (ATOM) trades at $4.15 after a 2.7% decline, with technical indicators suggesting further downside risk as bears maintain control.
ATOM Price Struggles at $4.26 as Cosmos Faces Bearish Technical Signals
Cosmos (ATOM) trades at $4.26 with mixed signals as recent 2.43% gains clash with bearish momentum indicators and key resistance at $5.32.
ATOM Price Hovers Near $4.17 Support as Bears Maintain Control
Cosmos (ATOM) trades at $4.17, up 1.58% daily but struggling below key moving averages. Technical indicators signal bearish momentum despite recent recovery attempts.
ATOM Price Tests Critical Support at $4.04 as Bearish Momentum Builds
Cosmos (ATOM) trades at $4.10 after a 1.51% decline, hovering dangerously close to the lower Bollinger Band at $4.09 with RSI signaling potential oversold conditions.
Cosmos (ATOM) Drops to $4.18 as Bears Target Support Levels Despite Network Upgrades
ATOM trades at $4.18 (-6.63% in 24h) as selling pressure intensifies. Technical indicators signal potential bounce from key support zones ahead.
Cosmos (ATOM) Price Struggles Below $4.50 as Bears Dominate After Network Upgrade Rally
ATOM trades at $4.49 (-1.51%) as selling pressure intensifies following consolidation below $5 resistance after recent network upgrade momentum faded.
ATOM Price Tests Support at $4.51 as Cosmos Shows Mixed Technical Signals
Cosmos (ATOM) trades at $4.51 after a 3.35% decline, with RSI neutral at 45.91 but approaching oversold territory as price tests key support levels.
ATOM Price Drops 5.86% as Cosmos Tests Critical Support at $4.29
Cosmos (ATOM) trades at $4.61 after a sharp decline, with technical indicators showing mixed signals as the token approaches key support levels.
Cosmos (ATOM) Price Consolidates at $4.64 as Bulls Test Critical $5 Resistance Zone
ATOM trades at $4.64 (-3.47% today) after recent surge to $5.20 driven by network upgrade. Technical indicators show mixed signals as price consolidates below key resistance.
Cosmos (ATOM) Price Consolidates Below $5 After Recent Network Upgrade Rally
ATOM trades at $4.79 (+1.89% today) as bulls test resistance following last week's surge to $5.20 driven by major network upgrade and IBC protocol enhancements.
Cosmos (ATOM) Holds $4.70 as IBC v4 Upgrades Drive Institutional Interest
ATOM trades at $4.70 (+2.73% daily) near critical resistance after IBC v4 implementation sparked 10% surge and growing institutional adoption signals.
ATOM Price Faces Bearish Pressure at $4.58 as Cosmos Struggles Below Key Moving Averages
Cosmos (ATOM) trades at $4.58, down 3.32% in 24h, with mixed technical signals showing neutral RSI but bearish MACD momentum indicators.
Cosmos (ATOM) Tests Support at $4.75 as Bulls Eye $5.32 Resistance Breakout
ATOM trades at $4.75 after a 1.27% pullback, but bullish momentum indicators suggest potential recovery toward the $5.32 resistance level.
Cosmos (ATOM) Surges to $5.20 as Network Upgrade and IBC Focus Drive Bullish Momentum
ATOM price climbs to $5.20 (+0.95% daily) following major network upgrade completion. RSI hits overbought territory at 74.29 as interoperability pivot fuels optimism.
Cosmos (ATOM) Surges 10% on IBC Protocol Focus and Institutional Interest
ATOM price hits $5.13 (+2.60% today) as Cosmos shifts strategy to blockchain interoperability while institutional adoption drives weekly gains above 10%.
Cosmos (ATOM) Surges 4% as Network Abandons EVM for Enhanced Interoperability Focus
ATOM gains momentum following strategic pivot from EVM to IBC protocol enhancement, successful network upgrade, and strong technical indicators showing bullish trend.
Cosmos (ATOM) Rallies 4% After Abandoning EVM Strategy - Technical Analysis Shows Strong Bullish Momentum at $4.94
ATOM surges as Cosmos pivots from EVM to IBC focus. Trading at $4.94 with RSI at 69.12, technical indicators suggest continued upward momentum despite recent 3.12% pullback.
Cosmos (ATOM) Gains Momentum with Key Network Upgrades and Institutional Interest
Cosmos (ATOM) is gaining traction, fueled by a 10% weekly rally, key network upgrades, and a strategic pivot to focus on blockchain interoperability. What's next for ATOM?
Cosmos (ATOM) Gains Momentum: Network Upgrades and Bullish Technicals Drive Price Surge
Cosmos (ATOM) surges 10.31% amid IBC v4 upgrades, institutional interest, and stablecoin adoption. Technical indicators signal a bullish outlook for July 2025.
Cosmos (ATOM) Surges Amid Network Upgrades and Institutional Interest: Price Outlook for July 2025
Cosmos (ATOM) has gained momentum with a 10.31% price surge, driven by IBC v4 upgrades, stablecoin growth, and institutional interest. Analysts predict a bullish outlook for July 2025.
Cosmos (ATOM) Price Surges as Network Upgrades and Institutional Interest Boost Momentum
Cosmos (ATOM) gains 10.31% this week amid ecosystem growth, IBC v4 upgrades, and rising institutional interest. Analysts predict continued bullish momentum in July.
Cosmos (ATOM) Price Surges Amid Ecosystem Growth and Bullish Momentum
Cosmos (ATOM) gains 10.31% as network upgrades, institutional interest, and stablecoin adoption drive bullish momentum. Explore technical analysis, trading signals, and price outlook.
Cosmos (ATOM) Price Soars Amid Ecosystem Growth and Bullish Momentum
Cosmos (ATOM) surges 10.31% as its ecosystem thrives, fueled by stablecoin adoption, institutional interest, and technical upgrades. Explore the bullish outlook here.
AVAX Price Prediction: Targeting $15.50-$19 Breakout Within 30 Days
AVAX price prediction shows potential 18-45% upside to $15.50-$19 range as bullish MACD momentum builds. Key resistance at $15.27 must break for Avalanche forecast to materialize.
AVAX Price Prediction: $15.50 Target Within 4 Weeks as Technical Momentum Builds
AVAX price prediction points to $15.50 target within 4 weeks, with bullish MACD momentum and key resistance at $15.27 setting stage for potential breakout rally.
AVAX Price Prediction: $16-$19 Target Within 30 Days as Technical Indicators Turn Bullish
AVAX price prediction suggests potential 12-33% upside to $16-$19 range within 30 days, with bullish MACD momentum and key resistance at $15.27 providing breakout catalyst.
AVAX Price Prediction: $16-19 Target Within 30 Days Despite Current Consolidation
Avalanche shows oversold recovery potential with analysts targeting $16-19 in December 2025. MACD turning bullish but resistance at $15.27 critical.
AVAX Price Prediction: Targeting $16-19 Rally Within 30 Days as Technical Indicators Signal Recovery
AVAX price prediction points to $16-19 upside targets in the next 30 days as MACD momentum turns bullish and oversold conditions create buying opportunity from current $13.67.
AVAX Price Prediction: Targeting $16-19 Recovery Within 30 Days Despite Current Weakness
AVAX price prediction shows potential 20-43% upside to $16-19 range within 30 days as technical indicators signal oversold conditions and bullish MACD momentum emergence.
AVAX Price Prediction: Targeting $18.50 Recovery Within 4 Weeks Despite Current Weakness
AVAX price prediction shows potential 25% upside to $18.50 target over next month as technical indicators suggest bullish momentum building despite current consolidation.
AVAX Price Prediction: Targeting $16-19 Range as Technical Indicators Signal Recovery
AVAX price prediction shows potential for 13-34% upside to $16-19 range within 30 days, supported by bullish MACD momentum and oversold conditions despite weak trend.
AVAX Price Prediction: Targeting $15.50 by December End Despite Bearish Headwinds
AVAX price prediction shows potential recovery to $15.50 within 4 weeks despite current bearish trend, with critical support at $12.54 and key resistance at $17.69.
AVAX Price Prediction: Recovery to $19.50 Expected by January 2025 After Oversold Bounce
AVAX price prediction targets $16-19.50 recovery within 4-6 weeks as RSI oversold conditions and bullish MACD histogram signal potential reversal from current $13.02 levels.
AVAX Consolidates Below Key Moving Averages as Crypto Markets Search for Direction
Avalanche trades at $14.85 with muted volatility as AVAX price action remains constrained below the 20-day moving average amid lack of fresh catalysts driving broader crypto sentiment.
AVAX Price Prediction: Targeting $16-19 Rally Within 4 Weeks as Technical Indicators Signal Potential Reversal
AVAX price prediction shows bullish momentum building with MACD histogram turning positive and oversold conditions creating opportunity for $16-19 target range by December 2025.
AVAX Price Prediction: Targeting $16-19 Recovery Within 4 Weeks as Oversold Conditions Signal Reversal
AVAX price prediction shows potential 20% upside to $16-19 range within four weeks as technical indicators suggest oversold bounce from current $14.96 level.
AVAX Breaks Above 7-Day Moving Average as Bullish MACD Divergence Signals Potential Recovery
Avalanche trades at $14.94 with 6.5% daily gains as technical indicators show improving momentum despite trading below key resistance levels.
AVAX Tests Lower Bollinger Band as Avalanche Consolidates Above 52-Week Low Support
Avalanche (AVAX) trades at $13.98, up 1.82% as bulls defend critical support zone just above the 52-week low of $13.23 amid technical consolidation pattern.
AVAX Price Prediction: $16-19 Recovery Target Within 4 Weeks Amid Oversold Bounce
AVAX price prediction shows potential recovery to $16-19 range as RSI signals oversold conditions at 35.18, with bulls targeting $18.22 resistance break.
AVAX Price Prediction: Recovery to $18.50 Expected Within 30 Days Despite Oversold Conditions
Avalanche shows oversold RSI at 26.40 with analysts targeting $18.50 recovery despite current bearish momentum. Critical $14 support level holds key to upside breakout.
AVAX Tests 52-Week Lows at $13.27 Despite Granite Upgrade Launch
Avalanche trades at $13.27 after hitting new yearly lows, down 25% monthly despite launching technical upgrades as broader crypto markets decline alongside traditional assets.
AVAX Price Prediction: $16-19 Recovery Target by December 2025 Despite Current Oversold Conditions
AVAX price prediction shows potential recovery to $16-19 range within 4 weeks as RSI hits oversold territory at 26.67, creating strategic buying opportunity.
AVAX Tests 52-Week Lows as Granite Upgrade Fails to Lift Price Above $14.50
Avalanche's AVAX price struggles at $14.26 despite technical upgrades, with the token testing yearly lows as bearish momentum persists across crypto markets.
AVAX Price Prediction: Oversold Bounce to $18-20 Target Within 2-4 Weeks
AVAX price prediction suggests recovery to $18-20 range as oversold RSI signals potential bounce from current $14.14 level near 52-week lows.
AVAX Consolidates Near $14.78 Ahead of Critical Granite Upgrade Launch Tomorrow
Avalanche trades at $14.78 with modest 1.3% gains as traders position ahead of tomorrow's Granite upgrade, while technical indicators suggest oversold conditions near key support levels.
AVAX Price Prediction: Targeting $18-25 Recovery Despite Current Bearish Momentum Through December 2025
AVAX price prediction suggests potential recovery to $18-25 range after finding support near $14, though bearish momentum remains a near-term concern for Avalanche investors.
AVAX Drops 6% Following $30M Token Unlock as Crypto Markets Face Stock Volatility
Avalanche price trades at $15.28 after scheduled token unlock released 1.67M AVAX tokens worth $29.84M, while broader crypto correlation with traditional markets adds pressure.
AVAX Price Prediction: Targeting $18-20 Recovery by December 2025 Despite Current Weakness
AVAX price prediction shows potential recovery to $18-20 range by December 2025, with bullish MACD momentum emerging despite 55% drop from yearly highs.
AVAX Tests Critical $16 Support as 1.67M Token Unlock Pressures Price Below Key Moving Averages
Avalanche (AVAX) trades at $15.37 amid selling pressure from yesterday's scheduled token unlock, testing crucial support levels as broader crypto markets decline.
AVAX Price Prediction: $20-25 Target by December 2025 as Technical Indicators Signal Recovery
AVAX price prediction shows potential 28-60% upside to $20-25 range by year-end as bullish MACD momentum emerges despite current consolidation near $15.62 support.
AVAX Price Prediction: Avalanche Eyes $20-25 Recovery Within 2 Weeks as Technical Indicators Signal Bullish Reversal
AVAX price prediction suggests a potential 25-57% rally to $20-25 within two weeks if bulls reclaim $18.22 resistance, with technical momentum building despite recent decline.
AVAX Price Drops to $16.37 as Bitcoin Bear Market Triggers Broader Crypto Selloff
Avalanche falls 3.1% to $16.37 amid Bitcoin's 20% decline from October highs, testing critical support levels as tariff concerns weigh on crypto markets.
AVAX Price Prediction: $20 Target Within Two Weeks as Avalanche Eyes Critical Breakout
AVAX price prediction suggests a potential move to $20 in the next 1-2 weeks if bulls reclaim $18.22 resistance, with bearish risk to $15 if current support fails.
AVAX Tests Bullinger Band Middle as Technical Recovery Gains Momentum Above $18
Avalanche price climbs 3.03% to $18.02, breaking above 7-day moving average as MACD histogram shows early bullish divergence in absence of major fundamental catalysts.
AVAX Gaming Sector Recognition Boosts Price 3% as Technical Indicators Show Mixed Signals
Avalanche (AVAX) trades at $17.84, up 3% after Beetz gaming platform featured the token, while technical analysis reveals neutral momentum amid broader crypto market stability.
AVAX Price Prediction: Targeting $25-28 Rally Within 4-6 Weeks Despite Current Weakness
AVAX price prediction suggests 42-59% upside potential to $25-28 range as technical indicators show bullish momentum building despite recent 3.87% decline.
AVAX Price Prediction: Targeting $25-28 Recovery by December 2025 After Technical Breakout
AVAX price prediction shows bullish momentum building at $17.63 with technical indicators signaling potential 42-59% upside to $25-28 range within 4-6 weeks.
AVAX Price Prediction: Targeting $19.50 Recovery Within 7 Days as Technical Momentum Shifts Bullish
AVAX price prediction shows potential 10% upside to $19.50 near-term as MACD histogram turns positive and current $17.75 level holds above key support zones.
AVAX Tests Critical $16 Support as RSI Hits Oversold Territory Below 30
Avalanche trades at $16.26 down 2.46% as technical indicators flash oversold signals near key Bollinger Band support with RSI at 29.46 in absence of major catalysts.
AVAX Price Prediction: Targeting $19.50 Within 30 Days Despite Near-Term Consolidation
AVAX price prediction points to $19.50 target within 30 days as technical indicators suggest oversold bounce from current $16.50 levels despite bearish momentum signals.
AVAX Price Prediction: Targeting $32.50 Recovery After 52% Decline from Highs
AVAX price prediction shows potential 92% upside to $32.50 within 4-6 weeks as technical indicators signal bullish reversal from oversold conditions near $16.93.
AVAX Tests Lower Bollinger Band at $18.01 as Recovery Stalls Following 20% Weekly Decline
Avalanche trades at $18.01 after a 3.7% daily drop, testing critical technical support as the recent recovery momentum from October 30th lows begins to fade amid broader crypto weakness.
AVAX Price Prediction: Targeting $24-$28 Rally Within 2-4 Weeks as Oversold Conditions Signal Reversal
AVAX price prediction shows potential 27-48% upside to $24-$28 range as technical indicators and analyst consensus point to short-term recovery from oversold levels.
AVAX Tests Lower Bollinger Band as Momentum Indicators Signal Potential Reversal
Avalanche trades at $18.69 with bullish MACD divergence emerging as price approaches key technical support near $17.51, presenting potential entry opportunity for traders.
AVAX Price Prediction: Targeting $24-28 Recovery Within 2 Weeks Despite Current Oversold Conditions
AVAX price prediction shows potential 30-50% upside to $24-28 range in next 2 weeks as technical indicators signal oversold bounce from current $18.37 level.
AVAX Institutional Investment Rally Faces Bitcoin Correlation Test at $17.92
Avalanche trades at $17.92 following 10% institutional investment surge, but Bitcoin's recent downturn tests AVAX price resilience amid mixed technical signals.
AVAX Price Prediction: Targeting $24-27 Breakout Within 2-4 Weeks Despite Current Oversold Conditions
AVAX price prediction suggests a potential 33-50% upside to $24-27 range over the next month, with technical indicators showing bullish divergence despite recent weakness.
AVAX Price Prediction: $32.50 Target Within 4-6 Weeks as Technical Indicators Signal Bullish Reversal
AVAX price prediction shows potential 62% upside to $32.50 with medium-term Avalanche forecast targeting $37-$42 range as technical momentum builds.
AVAX Price Prediction: Targeting $24-26 Range Within 30 Days Amid Mixed Technical Signals
AVAX price prediction shows potential recovery to $24-26 in the next month, with immediate resistance at $22.38. Current oversold conditions suggest upside despite bearish momentum.
AVAX Price Prediction: Targeting $22-24 Recovery Within 30 Days Despite Current Bearish Momentum
AVAX price prediction suggests recovery to $22-24 range in next 30 days as oversold conditions emerge, with critical support at $19.18 pivot level.
AVAX Consolidates Near $19.45 as Institutional Investment Counters Market Volatility
Avalanche trades at $19.45 amid mixed signals as $675M institutional SPAC deal provides support against broader crypto market weakness following recent 27% decline.
AVAX Price Prediction: Targeting $31.61 Short-Term with $42 Medium-Term Upside Potential
AVAX price prediction shows bullish momentum building despite current consolidation, with analysts targeting $31.61 near-term and $42 medium-term resistance levels.
AVAX Tests Critical $20 Support as Bearish Momentum Builds Despite Bullish Long-Term Trend
Avalanche trades at $20.10 after a 3% daily decline, testing key psychological support near its pivot point as technical indicators flash mixed signals in a quiet news environment.
AVAX Finds Footing Near $20 as Traders Eye Recovery from October's Sharp Correction
Avalanche (AVAX) trades at $20.19 with modest 1% gains as technical indicators suggest potential stabilization following the token's dramatic 27% decline earlier this month.
AVAX Tests Critical $20 Support After Token Unlock Triggers 4.4% Daily Decline
AVAX price drops to $20.08 following 1.67M token unlock, testing key support as broader crypto market weakness compounds selling pressure from increased supply.
Avalanche Consolidates Below Key Resistance as MACD Signals Bearish Momentum
AVAX trades at $28.38 with slight decline amid range-bound action between $27-$36 resistance, as technical indicators point to potential downside pressure.
Avalanche Shows Mixed Signals as AVAX Consolidates Above Key Support at $28.51
AVAX trades at $28.51 with modest 1.06% daily gains, holding above 50-day moving average while facing resistance near $30 as technical indicators signal consolidation phase.
AVAX Analysis: Token Retreats 7.8% Below Key Moving Average Despite Strong 200-Day Performance
AVAX trades at $28.45 after a 4.59% daily decline, showing technical divergence as it falls below the 20-day SMA while maintaining 24.3% gains above the 200-day average.
Avalanche Faces Institutional Interest Amid Mixed DEX Performance and Technical Consolidation
AVAX trades at $29.78 with minimal 24h movement despite $31B September DEX volume milestone, as institutional backing fails to offset recent 18% weekly decline
AVAX Consolidates Near $30 After Record $31B September DEX Volume and Major Upgrade Funding
Avalanche trades at $29.74 following record-breaking September DEX activity and $250M funding for December upgrade, with technical indicators showing neutral momentum.
Avalanche Price Action: AVAX Surges on Record $31B DEX Volume and Major Institutional Investment
AVAX trades at $29.41 (+3.78%) as Avalanche's DEX volume hits $31B milestone while Hivemind Capital raises $550M for AVAX One tokenization project.
AVAX Price Faces Critical Test at $28 Support as Bearish Momentum Builds
Avalanche (AVAX) trades at $28.27 after declining 1.53% in 24 hours, with technical indicators suggesting further downside pressure despite strong bullish long-term trend.
AVAX Price Plunges 10% as Avalanche Tests Critical Support at $30.73
Avalanche (AVAX) drops to $30.73 amid bearish momentum, testing key support levels while technical indicators show mixed signals for traders.
AVAX Price Soars Past $34 as Avalanche Foundation Unveils $1B Treasury Plan
AVAX trades at $34.17 after a 10% surge driven by treasury initiatives, though RSI signals overbought conditions ahead of key resistance at $36.16.
AVAX Price Surges 9.32% as Avalanche Secures $250M Funding for Major Upgrade
AVAX trading at $34.61 with strong bullish momentum following $250M funding announcement for Avalanche9000 upgrade and Fed rate cuts supporting crypto markets.
AVAX Price Drops 6.7% Despite Bullish Technical Momentum - Support Test at $29.41
AVAX trades at $30.79 after a sharp 6.7% decline, but technical indicators suggest underlying bullish momentum remains intact with key support holding.
AVAX Price Rallies 51% Above 200-Day MA Despite 2.4% Daily Decline
Avalanche (AVAX) trades at $33.02 with strong bullish momentum intact, showing resilience near upper Bollinger Band resistance despite today's minor pullback.
AVAX Price Soars to $33.80 as Avalanche Shows Strong Bullish Momentum
AVAX trades at $33.80 with RSI hitting overbought levels at 71.67, while technical indicators signal continued bullish momentum despite short-term correction risks.
AVAX Surges 4.5% as Avalanche Technical Analysis Shows Overbought Territory at $34
Avalanche (AVAX) trades at $34.02 with a 4.52% daily gain, but technical indicators signal potential resistance ahead as RSI reaches overbought levels above 72.
Avalanche (AVAX) Surges 10% to $33 as $1 Billion Treasury Plan Ignites Rally
AVAX price soars 9.94% to $32.96 amid Avalanche Foundation's $1 billion treasury funding plan and Toyota partnership, but overbought RSI signals caution ahead.
AVAX Price Surges Above $29 Despite Daily Dip - Avalanche Foundation's $1B Plan Fuels Bullish Momentum
AVAX trades at $29.72 with strong bullish signals emerging as Avalanche Foundation plans $1B funding round while Toyota partnership adds institutional credibility
Avalanche (AVAX) Targets $31 Resistance as Toyota Partnership Powers 4.67% Rally
AVAX trades at $29.80 (+4.67%) with bullish momentum building from Toyota robotaxi partnership and strong technical indicators signaling potential breakout above key resistance.
AVAX Price Drops 5% Despite $1 Billion Foundation Investment Plans
Avalanche trades at $28.60 after a 5.24% decline, but strong institutional backing and Toyota partnership signal potential bullish reversal ahead.
Avalanche (AVAX) Eyes $31 Resistance as Toyota Partnership Sparks 30% Monthly Rally
AVAX trades at $30.19 amid overbought RSI at 70.43, with Toyota robotaxi partnership and $1B Foundation funding driving institutional momentum toward key resistance.
Avalanche (AVAX) Surges 7.7% as Toyota Partnership and $1 Billion Treasury Plans Drive Momentum
AVAX climbs to $30.78 with 7.7% daily gains as Toyota robotaxi partnership and Avalanche Foundation's $1B treasury fundraising initiative fuel bullish sentiment.
AVAX Price Breaks Above $28 as Avalanche Shows Strong Bullish Momentum
AVAX trades at $28.47 with bullish technical indicators despite 1.76% daily decline. RSI at 64.22 signals continued upward potential for Avalanche.
Avalanche (AVAX) Price Breaks $28 as Toyota Partnership Fuels 9.46% Rally
AVAX surges to $28.46 with 9.46% daily gains as Toyota robotaxi partnership and 4B transaction milestone drive bullish momentum across key technical levels.
Avalanche (AVAX) Surges 3.74% as Toyota Partnership Fuels Bullish Momentum
AVAX trades at $26.08 with strong technical signals following Toyota's blockchain robotaxi announcement. RSI shows neutral positioning while momentum builds.
Avalanche (AVAX) Price Surges 2% as Toyota Partnership Sparks Bullish Momentum
AVAX trades at $25.00 with 2% daily gains as Toyota robotaxi partnership and 493% transaction growth fuel renewed institutional interest in Avalanche blockchain.
Avalanche (AVAX) Targets $25 Breakout as Toyota Partnership Fuels Bullish Momentum
AVAX trades at $24.46 with strong whale activity and technical indicators pointing toward a potential breakout above the critical $25 resistance level.
AVAX Price Holds $24 Despite Bearish Momentum as Avalanche Tests Critical Support
AVAX trades at $24.16 with neutral RSI at 50.67, but bearish MACD signals potential downside risk toward $22.19 support level in coming sessions.
AVAX Price Tests Critical $25 Resistance as Avalanche Processes Record 2.26M Daily Transactions
AVAX trades at $24.44 (-1.25%) while testing key resistance levels. Record on-chain activity driven by Toyota partnership creates mixed technical signals for traders.
AVAX Price Eyes $27 Breakout as C-Chain Activity Surges 493%
Avalanche trades at $24.79 (+1.47%) with technical indicators pointing to potential breakout above $27 resistance amid explosive on-chain growth.
AVAX Price Faces Key Test at $25 Resistance After 26% Surge from August Lows
AVAX trades at $25.07 (+3.38% daily) as bulls test critical resistance levels. Technical indicators show mixed signals while recent rejection at $26.50 creates uncertainty.
AVAX Price Holds Above $24 Despite Mixed Technical Signals and Analyst Correction Warnings
Avalanche trades at $24.15 (+1.51%) while facing key resistance at $26. Recent analyst predictions suggest potential correction to $16 amid bearish MACD signals.
Avalanche (AVAX) Price Tests Support at $23 as Bearish Momentum Builds
AVAX trades at $23.06 after a 3.23% daily decline. Technical indicators show mixed signals with RSI neutral at 46.66 but MACD turning bearish.
AVAX Price Faces Critical Test at $26.50 Resistance as Avalanche Network Activity Surges
AVAX trades at $23.83 with mixed signals as network transactions hit 1.5M daily, but analyst warns of potential correction to $16 if resistance at $26.50 holds.
AVAX Approaches Critical $25.99 Resistance as Network Activity Surges 200%
Avalanche (AVAX) trades at $23.71 with daily transactions reaching 1.5M, setting up for potential breakout above key resistance levels.
AVAX Price Drops 2.95% Despite Network Activity Surge - Technical Analysis Shows Mixed Signals
Avalanche trades at $23.71 after declining 2.95% in 24 hours, even as daily transactions exceed 1.5 million - bearish momentum builds despite strong fundamentals.
AVAX Price Eyes Rally as Avalanche Network Hits 1.5M Daily Transactions
AVAX trades at $24.39 (-2.87%) despite network fundamentals strengthening with record transaction volumes and institutional partnerships driving Q4 optimism.
AVAX Price Drops 3.44% to $23.84 Despite Massive 468% Rally Last Week
Avalanche (AVAX) trades at $23.84 after a 3.44% decline, consolidating gains from last week's extraordinary 468% institutional-driven surge to $24.42.
** AVAX Price Holds $24.56 Despite Token Unlock Pressure - VanEck ETF Filing Boosts Institutional Interest
** Avalanche trades at $24.56 (+2.33%) as institutional backing from VanEck's ETF filing counters token unlock concerns, with technical indicators showing bullish momentum.
AVAX Price Drops 4% Despite Massive 468% Weekly Surge as Avalanche Faces Token Unlock
AVAX trades at $23.59 after a 3.95% decline, testing key support levels despite this week's extraordinary 468% rally driven by institutional adoption and network upgrades.
AVAX Price Drops 5.4% as Avalanche Tests Support at $24 Despite Bullish Momentum
Avalanche (AVAX) trades at $24.00 after declining 5.44% in 24 hours, but technical indicators suggest underlying strength with bullish MACD momentum emerging.
AVAX Price Surges 4% to $25.73 Despite Looming Token Unlock
AVAX trades at $25.73 with strong bullish momentum, but tomorrow's significant token unlock creates near-term uncertainty for Avalanche investors.
Avalanche (AVAX) Surges 7.7% to $24.77 on BlackRock Investment and ETF Speculation
AVAX trades at $24.77 after surging 7.7% in 24 hours, driven by BlackRock's $240M investment and 90% ETF approval odds by December 2025.
AVAX Price Drops 5% Despite Institutional Investment Wave and ETF Optimism
Avalanche trades at $23.11 after a 4.97% decline, testing key support levels as traders weigh upcoming token unlock against strong institutional backing.
Avalanche (AVAX) Surges 3.18% as Institutional Adoption Drives Bullish Momentum
AVAX trades at $24.04, up 3.18% daily, fueled by BlackRock's $240M investment and ETF approval hopes with 90% probability by December 2025.
AVAX Price Analysis: Avalanche Shows Mixed Signals at $23.81 Amid Technical Consolidation
Avalanche (AVAX) trades at $23.81 after a 2.10% decline, with technical indicators suggesting consolidation phase as RSI remains neutral at 55.09.
Avalanche (AVAX) Surges 3.97% as DeFi Recovery Overshadows Technical Breakdown
AVAX trades at $24.07 after a 3.97% daily gain, recovering from bearish double-top breakdown as DeFi activity surges on the Avalanche network.
Avalanche (AVAX) Price Surges 5.59% as DeFi Activity Counters Bearish Double-Top Pattern
AVAX trades at $23.24 with 5.59% daily gains as surging DeFi activity offsets earlier technical breakdown concerns, creating mixed signals for traders.
AVAX Price Holds Above $22 as Technical Indicators Signal Mixed Momentum
Avalanche (AVAX) trades at $22.07 with modest 1.61% daily gains, but technical analysis reveals conflicting signals as RSI remains neutral while MACD shows bearish divergence.
AVAX Price Tests $21.80 Support as Avalanche Faces Technical Crossroads
AVAX trades at $21.80 (+3.32%) while technical indicators signal potential reversal from oversold conditions despite recent ETF-driven rally cooling off.
AVAX Price Retreats to $21.15 Despite Bullish ETF News and Record Network Activity
Avalanche trades at $21.15 (-1.26%) as technical indicators signal potential consolidation despite recent ETF optimism and 20M daily transaction milestone.
AVAX Price Falls to $21.41 Despite $250M RWA Initiative as Technical Indicators Turn Mixed
Avalanche trades at $21.41 (-2.19%) as momentum weakens following last week's surge past $26 resistance, with AVAX RSI at 43.24 signaling neutral conditions.
AVAX Price Drops 8% to $21.95 as Bulls Face Critical Support Test
Avalanche (AVAX) trades at $21.95 after an 8% decline, testing key support levels despite recent bullish momentum from ETF anticipation and $250M RWA initiative.
AVAX Price Holds Above $23 Despite ETF Momentum as Real-World Assets Drive 47% Weekly Surge
Avalanche trades at $23.94 (-0.62% today) after surging 47% on $250M RWA initiative and ETF anticipation, with technical analysis showing mixed signals ahead.
AVAX Price Retreats to $23.77 Despite ETF Optimism and RWA Expansion Momentum
Avalanche (AVAX) trades at $23.77 after 3.96% decline, testing key support levels despite recent bullish catalysts from ETF decision and $250M RWA initiative.
AVAX Price Retreats to $24.87 Despite ETF Hopes and $250M RWA Expansion Push
Avalanche trades at $24.87 (-6.22%) as profit-taking emerges despite bullish ETF anticipation and record $250M real-world asset integration driving long-term optimism.
AVAX Price Surges to $25.72 as Avalanche ETF Decision Creates Bullish Momentum
AVAX trades at $25.72 (+1.26%) with strong technical indicators and record network activity driving momentum ahead of crucial ETF decision on July 28.
AVAX Price Breaks Above $25 Despite ETF Approval Uncertainty - Technical Analysis Shows Bullish Momentum
AVAX trades at $25.01 (+3.82%) with RSI at 66.36 as traders await VanEck ETF decision while record transaction volumes support upward momentum toward $26.53 resistance.
Avalanche (AVAX) Surges to $23.86 as ETF Decision Looms and Network Hits 20M Daily Transactions
AVAX trades at $23.86 (+0.84%) with bullish momentum building ahead of July 28 ETF decision. Record transaction volumes and strong technical indicators signal potential breakout.
Avalanche (AVAX) Price Drops 2.3% Despite Record-Breaking Network Activity
AVAX trades at $23.62 after a 2.3% daily decline, though strong institutional adoption and record 20M daily transactions signal bullish momentum ahead.
AVAX Price Surges to $24.41 as Avalanche Technical Analysis Shows Strong Bullish Momentum
Avalanche (AVAX) trades at $24.41 with bullish technicals and record 20M daily transactions driving positive sentiment amid ETF speculation.
AVAX Price Hits $25.38 as Avalanche Breaks Record with 20M Daily Transactions
AVAX surges 15% in July amid record network activity and institutional adoption, with technical indicators pointing to potential $26+ breakout.
AVAX Price Surges Past $24 as Avalanche Records 20M Daily Transactions
AVAX trades at $24.80 (+1.35%) with RSI at 74.09 signaling overbought conditions. Record transaction volumes and ETF speculation fuel bullish momentum toward $25.55 resistance.
Avalanche (AVAX) Surges 15% in July 2025: Record Transactions and ETF Speculation Drive Bullish Momentum
AVAX hits record 20M daily transactions as institutional adoption grows and ETF speculation builds. Technical indicators show strong bullish signals with potential $25+ breakout.
Avalanche (AVAX) Surges Past $23 Despite Mixed Signals: Record 20M Daily Transactions Signal Network Maturity
AVAX climbs 15% in July amid record-breaking transaction volumes and institutional adoption, though regulatory delays and security concerns create mixed market signals.
Avalanche (AVAX) Surges Amid Record Transactions and Strategic Partnerships: Bullish Momentum Ahead
Avalanche (AVAX) is gaining traction with a record 20M daily transactions, institutional partnerships, and bullish technical signals, eyeing a breakout above $25.
Avalanche (AVAX) Gains Momentum Amid Institutional Adoption and Technical Milestones
Avalanche (AVAX) sees growing institutional adoption, technical advancements, and ecosystem growth, but security concerns and regulatory delays temper bullish sentiment.
Avalanche (AVAX) Surges Amid Partnerships, ETF Hype, and Ecosystem Expansion
Avalanche (AVAX) climbs past $22 driven by partnerships, ETF speculation, and ecosystem growth. Despite challenges like security concerns, bullish momentum persists.
Avalanche (AVAX) Shows Resilience Amid New Partnerships, Technical Progress, and Market Volatility
Avalanche (AVAX) climbs past $21 as key partnerships and technical innovations bolster its ecosystem. Despite regulatory delays and security risks, AVAX retains bullish potential.
Avalanche (AVAX) Market Update: ETF Delays, Security Breaches, and Promising Developments
Avalanche (AVAX) faces a turbulent week as the SEC delays its ETF decision and security issues surface. However, technical upgrades and strategic partnerships signal long-term potential.
Avalanche (AVAX) Faces Mixed Signals Amid SEC Delays, Security Concerns, and Positive Technical Trends
Avalanche (AVAX) sees mixed momentum as the SEC delays a key ETF decision and a $42M hack raises security concerns. However, new partnerships and technical trends signal potential growth.
Avalanche (AVAX) Faces Mixed Signals Amid Regulatory Delays and Promising Partnerships
Avalanche (AVAX) wavers as the SEC delays Grayscale's ETF review and GMX is hacked for $42M. Despite setbacks, partnerships and grants offer long-term promise.
BCH Price Prediction: Bitcoin Cash Targets $650 Within Two Weeks on MACD Breakout
Bitcoin Cash shows bullish momentum with MACD divergence and RSI at 55.94. BCH price prediction targets $650 short-term with potential upside to $800-$1,000 range.
BCH Price Prediction: Bitcoin Cash Targets $625 in Next 10 Days as MACD Signals Bullish Breakout
BCH price prediction points to $625 target within 7-10 days as technical indicators align. Current Bitcoin Cash forecast suggests 10% upside potential from $568.90 levels.
BCH Price Prediction: Bitcoin Cash Eyes $625 Short-Term Target Amid Bullish Technical Setup
Bitcoin Cash shows bullish momentum with MACD divergence supporting a BCH price prediction of $625 in the next 7-10 days, with medium-term targets reaching $700-$800.
BCH Price Prediction: Bitcoin Cash Eyes $625 Breakout as Technical Indicators Signal 6% Rally
Bitcoin Cash shows bullish momentum with MACD divergence and RSI at 58.81. BCH price prediction targets $625 within 7-10 days, representing potential 6% upside from current levels.
BCH Price Prediction: Bitcoin Cash Eyes $625 Target as Technical Indicators Signal 15% Upside Potential
BCH price prediction shows strong bullish momentum with analysts targeting $625.90 short-term. Technical analysis supports continued upward trajectory from current $591.50 levels.
BCH Price Prediction: Bitcoin Cash Eyes $610 Breakout as Bulls Target 52-Week High Retest
BCH price prediction suggests potential rally to $610-$624 range within 1-2 weeks as technical indicators align bullishly near $598 resistance breakthrough.
BCH Price Prediction: $580 Target Within 2 Weeks, Long-term $4,446 Forecast
BCH technical analysis reveals bullish MACD momentum targeting $580 short-term resistance. Medium-term Bitcoin Cash forecast suggests $560-$620 range with critical $520 support level.
BCH Price Prediction: Bitcoin Cash Targets $580 Within Two Weeks as MACD Signals Bullish Momentum
Bitcoin Cash shows bullish MACD momentum despite recent decline, with analysts targeting $580 short-term and potential upside to $600-$680 range over coming months.
Bitcoin Cash Outperforms Crypto Market with 2.8% Gain as Altcoin ETF Expansion Signals Institutional Interest
BCH price climbs to $536.10 amid broader market weakness, standing as sole gainer in CoinDesk 20 Index while Franklin Templeton's ETF expansion highlights growing institutional appetite for alterna...
BCH Price Prediction: Bitcoin Cash Eyes $568 Resistance Break for Move to $592 Target
BCH price prediction shows bullish momentum with MACD histogram at 4.14. Bitcoin Cash targets $568 resistance break to reach $592 within 2 weeks.
BCH Price Prediction: Bitcoin Cash Targets $580-$620 Within 3-4 Weeks Based on Bullish MACD Signals
Bitcoin Cash shows bullish momentum with MACD histogram at 4.89 and price holding above $517 pivot support. Analysts project BCH reaching $580-$620 in the next 3-4 weeks.
BCH Gains 2.8% as Only Green Asset in CoinDesk 20 Amid Market Selloff
Bitcoin Cash (BCH) trades at $549.10, up 3.27% in 24 hours, as institutional interest grows following Grayscale's trading platform enhancement announcement.
BCH Tests Upper Bollinger Band at $540 as Bitcoin Cash Bulls Eye $568 Resistance
Bitcoin Cash trades at $540.20, up 3.6% daily, approaching upper Bollinger Band resistance with bullish MACD momentum suggesting potential breakout above key $568 level.
BCH Price Prediction: Bitcoin Cash Targets $580-$650 as Bullish Momentum Builds
BCH price prediction shows strong upside potential to $580-$650 range over next 4-6 weeks, supported by bullish MACD and breakout above key resistance levels.
BCH Price Prediction: $580 Target Within 2 Weeks as Technical Momentum Builds
Bitcoin Cash shows bullish momentum with MACD histogram turning positive and price breaking above key resistance at $530, targeting $580 in the next two weeks.
Bitcoin Cash Rallies 10.9% to $533 as Technical Recovery Outpaces Broader Crypto Market
Bitcoin Cash surges to $533.50 amid strong technical momentum, showing resilience despite recent market volatility as BCH price breaks above key moving averages.
BCH Price Prediction: $580 Target by December 2025 as Technical Momentum Builds
Bitcoin Cash shows bullish momentum with BCH price prediction targeting $580 by December 2025. Technical analysis reveals potential 16% upside from current levels.
Bitcoin Cash Tests Key Support at $497 as Crypto Markets Show Mixed Signals
Bitcoin Cash trades at $497.60 with minimal 24-hour movement as technical indicators suggest consolidation near critical support levels amid sideways crypto market action.
BCH Price Prediction: Bitcoin Cash Eyes $540 Recovery Target Within 7 Days
Bitcoin Cash shows bullish MACD momentum despite recent pullback. Technical analysis suggests BCH price prediction of $540 short-term with potential breakout to $570.
BCH Breaks Above $500 Support as Bitcoin Selloff Creates Divergence Opportunity
Bitcoin Cash trades at $528.00, up 5.6% as BCH price shows resilience against broader crypto weakness, with technical indicators suggesting continued momentum above key moving averages.
BCH Price Prediction: Bitcoin Cash Targets $550-580 in Next 30 Days Despite Near-Term Weakness
BCH price prediction shows mixed signals with analysts targeting $497-580. Technical analysis suggests consolidation before potential breakout above $500 resistance.
Bitcoin Cash Rebounds 3.9% to $503 as November Breakout Momentum Continues
Bitcoin Cash trades at $503.60, up 3.9% in 24 hours, building on last week's technical breakout above $515 resistance as broader crypto markets show mixed signals.
BCH Price Prediction: Bitcoin Cash Targets $520-$540 in December 2025 Despite Near-Term Weakness
BCH price prediction shows consolidation around $500 support before potential rally to $520-$540 range by December 2025, contingent on breaking $515 resistance level.
Bitcoin Cash Tests $488 Support as Crypto Market Faces Broad Selling Pressure
BCH price drops 3.7% to $487.90 amid technical weakness, with bears targeting key support levels as broader crypto market declines continue.
BCH Price Prediction: Targeting $530-$580 Range Within Two Weeks Despite Mixed Signals
Bitcoin Cash shows bullish analyst consensus targeting $530-$580, but technical indicators remain mixed with neutral RSI at 47.92 and bearish MACD momentum requiring careful timing.
BCH Price Prediction: Bitcoin Cash Targets $580-$650 Range Within 30 Days Despite Current Weakness
BCH price prediction suggests recovery to $580-$650 range over next month as MACD histogram shows bullish momentum despite recent 5.2% decline to $499.60.
Bitcoin Cash Breaks $518 Resistance as BCH Price Surges 1.9% Despite Market Uncertainty
Bitcoin Cash rallied 1.9% to $518, breaking key resistance levels while broader crypto markets faced headwinds. BCH price currently consolidates at $512 with bullish momentum intact.
BCH Price Prediction: Bitcoin Cash Targets $580 Within Two Weeks as Bullish Momentum Builds
BCH price prediction shows potential rally to $580 resistance level as MACD histogram turns positive and price holds above key $517 pivot support.
BCH Rallies 2.3% as U.S. Government Reopening and Trump Stimulus Plan Boost Crypto Risk Appetite
Bitcoin Cash climbs to $512.00 amid renewed market optimism following the end of the 40-day U.S. government shutdown and President Trump's proposed $2,000 stimulus package.
Bitcoin Cash Tests Key Support at $500 as Crypto Markets Show Mixed Signals
BCH price holds above $500 psychological support at $503.80, up 2.5% daily, as technical indicators suggest consolidation phase ahead of potential directional move.
BCH Price Prediction: Bitcoin Cash Eyes $580 Target Despite Short-Term Headwinds Through December 2025
BCH price prediction shows mixed signals with potential $580 upside by mid-December, but immediate risk of $431 support test if bearish momentum continues.
BCH Price Prediction: Bitcoin Cash Eyes $580-620 Breakout by December 2025
Bitcoin Cash (BCH) targets $580-620 range in the next 4-6 weeks, with immediate resistance at $580. Current technical setup suggests 13-21% upside potential.
BCH Tests Key Support at $484 as Technical Weakness Persists Amid Crypto Market Decline
Bitcoin Cash trades at $484.60, down 3.5% as BCH price tests critical support levels while broader crypto markets retreat from recent highs.
BCH Price Prediction: Bitcoin Cash Eyes $550 Recovery Despite Current Weakness - November 2025 Forecast
BCH price prediction shows potential recovery to $550-580 range within 4 weeks, though current technical indicators suggest caution with key support at $485.
BCH Price Prediction: Bitcoin Cash Eyes $580 Breakout Target Within 2 Weeks
BCH price prediction points to $580 resistance test with potential rally to $634. Bitcoin Cash forecast shows bullish MACD momentum despite 4% daily decline.
BCH Price Analysis - November 03, 2025
BCH price trades at $528.90 after declining 4.2% in 24 hours as Federal Reserve's hawkish commentary on future rate cuts creates uncertainty across cryptocurrency markets.
BCH Price Prediction: Bitcoin Cash Eyes $634 Target as Bulls Test $580 Resistance
BCH price prediction shows potential rally to $634 medium-term if bulls break $580 resistance, with current technical momentum supporting bullish continuation from $550 levels.
BCH Tests $570 Resistance as Bitcoin ETF Inflows Signal Renewed Institutional Crypto Interest
Bitcoin Cash trades at $555.80 after testing key $570 resistance, with BlackRock's $28.1B Bitcoin ETF inflows highlighting institutional demand for digital assets amid Fed uncertainty.
BCH Price Prediction: Bitcoin Cash Eyes $634 Target Despite Near-Term Headwinds Through December 2025
Bitcoin Cash forecast shows mixed signals with immediate resistance at $570-580, but technical momentum supports potential rally to $634 if bulls break key levels.
BCH Surges 16% as Fed Rate Cut Sparks Risk-On Sentiment in Crypto Markets
Bitcoin Cash climbs to $545.20 amid Federal Reserve's second 2025 rate cut and heightened derivatives activity, positioning BCH for potential breakout above key resistance levels.
BCH Price Prediction: Bitcoin Cash Eyes $580 Breakout with $713 Long-Term Target by 2030
BCH price prediction targets $580 resistance break for bullish continuation, with analysts forecasting $713.91 by 2030 despite short-term risks at $519.5 support.
BCH Price Prediction: $600-650 Target by November 2025 as Technical Setup Signals Bullish Breakout
Bitcoin Cash shows strong bullish momentum with MACD turning positive and price near upper Bollinger Band. BCH price prediction targets $600-650 range within 2-3 weeks.
BCH Price Prediction: Bitcoin Cash Targets $580-620 by November 2025 Despite Mixed Analyst Views
Bitcoin Cash shows bullish momentum with MACD histogram turning positive. BCH price prediction suggests $580-620 target range within 3-4 weeks despite current consolidation.
BCH Price Prediction: Bitcoin Cash Eyes $365-$470 Range with Bearish Bias Through November 2025
Bitcoin Cash faces downward pressure with analyst targets pointing to $364-$366 support levels, while technical indicators suggest limited upside potential near $470 resistance.
Bitcoin Cash Tests Critical $485 Pivot as Bearish MACD Divergence Signals Potential Reversal
BCH price holds $478.10 (+2.7% daily) near key pivot point as technical indicators show mixed signals with bearish momentum divergence raising caution for traders.
BCH Price Prediction: Bitcoin Cash Eyes $620-$640 by Year-End Despite Near-Term Consolidation Risk
BCH price prediction shows potential for $620-$640 targets by December 2025, though immediate consolidation toward $470-$490 levels likely before bullish breakout above $615 resistance.
Bitcoin Cash Tests Key Support at $475 as BTC Crash Below $100K Triggers Crypto Selloff
BCH price drops to $475.60 amid market-wide selling pressure following Bitcoin's sharp decline below the psychological $100,000 level, testing critical technical support zones.
Bitcoin Cash Tests Key Support at $463 as Crypto Markets Face Continued Selling Pressure
BCH price drops 2.7% to $463.10, approaching critical support levels amid broader crypto weakness and oversold technical conditions signaling potential reversal zone.
Bitcoin Cash Plunges 7.8% as Institutional Bitcoin Flows Overshadow Altcoin Markets
BCH price drops to $466.00 amid record $18B Bitcoin ETF inflows that concentrated institutional demand away from alternative cryptocurrencies like Bitcoin Cash.
Bitcoin Cash Plunges 8.2% as Federal Rate Cuts Signal Economic Headwinds
BCH price drops to $467.40 amid broader crypto selloff triggered by Bitcoin's decline below key support and Fed's unexpected rate cut resumption signaling economic concerns.
BCH Consolidates Above Key Moving Averages as Bulls Eye $615 Resistance
Bitcoin Cash trades at $589.40, up 1.64% in 24 hours, showing consolidation above critical technical support levels with bullish momentum building toward key resistance.
BCH Consolidates Above Key Moving Average Support as Technical Indicators Signal Neutral Momentum
Bitcoin Cash trades at $580.10 with modest 0.36% daily gains, holding above critical $579 50-day moving average as RSI remains neutral at 49.7 ahead of key resistance test.
Bitcoin Cash Hovers Near Key Support as BCH Tests $575 Technical Zone
Bitcoin Cash trades at $577.70 after a 2.25% decline, approaching critical support levels that could determine the next directional move for BCH traders.
BCH Technical Setup: Neutral Consolidation Above 200-Day Moving Average Signals Potential Breakout
Bitcoin Cash trades at $560.20 with minimal 24-hour movement as the cryptocurrency maintains position above key long-term support while testing near-term resistance levels.
BCH Consolidates Near $560 as Technical Indicators Signal Neutral Momentum
Bitcoin Cash trades at $559.40 with modest 0.45% daily gains as the cryptocurrency remains trapped between key moving averages, testing trader patience.
BCH Traders Watch: Network Hashrate Surge Counters Market Correction as Price Stabilizes Near $557
Bitcoin Cash trades at $556.70 amid 3% daily gains, but recent market correction overshadows record hashrate milestone. Key support levels tested.
Bitcoin Cash (BCH) Tests Lower Support as Bears Target $524 Zone
BCH price slides to $539.30 amid bearish momentum, with Bitcoin Cash technical analysis revealing oversold conditions near critical support levels.
Bitcoin Cash (BCH) Tests Support at $549 as RSI Signals Oversold Territory
BCH price drops 1.72% to $549.50 amid bearish momentum, but technical indicators suggest potential bounce from current oversold levels near Bollinger Band support.
Bitcoin Cash (BCH) Tests Lower Support at $560 as Bears Take Control
BCH price drops 0.43% to $560.30, approaching critical support levels with bearish momentum building across multiple timeframes.
Bitcoin Cash (BCH) Drops 3.86% as Technical Indicators Flash Mixed Signals
BCH price falls to $563.10 amid bearish momentum signals, while RSI suggests oversold conditions may present buying opportunities for contrarian traders.
Bitcoin Cash (BCH) Tests Key Support at $572 as Bears Target Lower Levels
BCH price drops 4.28% to $572.10, testing critical support levels while technical indicators flash mixed signals for short-term direction.
Bitcoin Cash BCH Surges Above Key Support Despite Minor Daily Dip - Network Strength Signals Bullish Momentum
BCH trades at $599.30 (-0.76% daily) but shows strong fundamentals with record hashrate and technical indicators suggesting continued uptrend momentum.
Bitcoin Cash (BCH) Hovers Near Pivot Point at $605 Amid Neutral Technical Signals
BCH price trades at $605 with mixed signals as Bitcoin Cash RSI sits in neutral territory while bullish MACD momentum suggests potential upside ahead.
Bitcoin Cash (BCH) Slides 3.23% Despite $12.73B Market Cap Milestone and Bullish Technical Breakout
BCH price drops to $611.60 amid profit-taking, but inverse head-and-shoulders pattern signals potential rally to $750 target zone.
Bitcoin Cash (BCH) Surges 7.81% to New 52-Week High at $646.30
BCH price jumps to $646.30, marking a fresh yearly high with strong bullish momentum as technical indicators signal continued upside potential.
Bitcoin Cash (BCH) Surges Past $598 as Technical Indicators Flash Bullish Signals
BCH price climbs 1.22% to $598.50 with RSI entering neutral territory and MACD showing strong bullish momentum across key resistance levels.
** BCH Price Analysis: Bitcoin Cash Shows Strong Bullish Momentum Above $590 Support
** BCH price trades at $594 with bullish technical signals emerging. Bitcoin Cash technical analysis reveals momentum building toward $630 resistance levels.
Bitcoin Cash (BCH) Holds Above $590 Despite Minor Pullback - Technical Analysis Points to Bullish Continuation
BCH price trades at $591.80 with -0.39% daily decline. Strong technical indicators suggest upward momentum remains intact despite recent consolidation.
Bitcoin Cash (BCH) Eyes $700 Target as Bulls Battle Key $634 Resistance
BCH trades at $593.70 (-1.83%) with analysts targeting $700+ if it breaks above $634.30 resistance, though whale activity remains subdued at $200M.
Bitcoin Cash (BCH) Eyes $634 Breakout as Technical Indicators Signal Bullish Momentum
BCH price trades at $604 with strong bullish signals emerging. Technical analysis suggests potential rally to $634-$700 range as momentum builds.
BCH Price Tests $590 Support as Bitcoin Cash Shows Mixed Technical Signals
Bitcoin Cash trades at $589.80 (-1.60% in 24h) with BCH RSI at neutral 53.48, while strong resistance looms at $634.30 amid conflicting momentum indicators.
Bitcoin Cash (BCH) Eyes $634 Breakout as Golden Cross Signals Bullish Momentum
BCH price trades at $586.40 (+1.58%) with golden cross formation and strong technical indicators pointing to potential $634-$700 rally in coming weeks.
Bitcoin Cash (BCH) Tests $584 Amid Technical Breakout and Tether SLP Exit
BCH trades at $584.80 (-1.63% daily) as technical analysis shows bullish breakout potential despite Tether ending USDT support on Bitcoin Cash SLP network.
Bitcoin Cash (BCH) Faces Mixed Signals at $591 as Tether Exits SLP Platform
BCH trades at $591 (-1.76%) amid Tether's USDT withdrawal from Simple Ledger Protocol, while analysts predict potential rally to $640-$700 range.
Bitcoin Cash (BCH) Surges Above $600 as Bulls Target $634 Resistance
BCH price climbs 2.64% to $603, showing strong bullish momentum with RSI in neutral territory and MACD signaling continued upward pressure.
Bitcoin Cash (BCH) Tests Key Support at $587 Amid Technical Consolidation
BCH price drops 3.32% to $587.70 as Bitcoin Cash faces resistance near $630 while RSI remains neutral at 54, signaling potential consolidation phase ahead.
Bitcoin Cash (BCH) Targets $640 Rally as Technical Indicators Flash Bullish Signals
BCH price surges to $598.80 (+2.15%) as analysts eye $640-$689 breakout zone. Technical momentum building with RSI at 57.33 and bullish MACD crossover.
Bitcoin Cash BCH Signals Bullish Breakout Above $588 as September Rally Targets $640-$700
BCH trades at $588.90 with analysts eyeing $640-$700 targets. Strong bullish momentum indicators and key resistance at $634 suggest potential breakout ahead.
Bitcoin Cash Surges 6% as BCH Price Tests Critical $612 Resistance Level
BCH price rallies to $603.60 with strong bullish momentum as technical indicators signal potential breakout above key resistance levels.
Bitcoin Cash (BCH) Surges 3.5% as Bulls Eye $634 Resistance Level
BCH price climbs to $566.50 with strong bullish momentum intact. Technical indicators suggest further upside potential as Bitcoin Cash tests key resistance zones.
Bitcoin Cash (BCH) Price Prediction: Bulls Target $640 Despite Recent 2.84% Decline
BCH trades at $534.20 after a 2.84% drop, but technical indicators suggest potential rally to $640-$689 range as analysts eye September breakout targets.
Bitcoin Cash (BCH) Holds Above $550 Despite Czech Government Seizure Concerns
BCH price trades at $550.30 (+3.50% in 24h) as traders weigh regulatory headwinds against potential $640 breakout amid Fed rate cut optimism.
Bitcoin Cash (BCH) Hovers Near Support as RSI Shows Neutral Territory
BCH price trades at $534.60 with -0.07% daily decline, testing critical support levels while technical indicators suggest consolidation phase ahead.
Bitcoin Cash (BCH) Tests $531 Support as Bears Take Control Despite ETF Optimism
BCH price drops 3.60% to $535.20 as bearish momentum builds, testing critical support levels despite recent regulatory tailwinds from SEC ETF approvals.
Bitcoin Cash (BCH) Hovers Near $554 Despite Bullish Trend Amid Fed Rate Cut Signals
BCH price trades at $554.40 with -0.59% decline, but strong bullish trend intact above $480 support as regulatory approvals boost sentiment.
Bitcoin Cash (BCH) Drops to $563 as Market Correction Erases Post-Halving Gains
BCH price falls 4.75% to $563.20 amid broader crypto market selloff, testing key support levels after hitting $618 high during halving rally just days ago.
Bitcoin Cash (BCH) Retreats from $620 High as Halving Rally Pauses
BCH price currently trades at $587.80 (-0.93% in 24h) after breaking above $620 this week, with technical indicators showing mixed signals ahead of the August halving event.
Bitcoin Cash (BCH) Consolidates at $589 as Halving Momentum Cools After $618 Peak
BCH trades at $589 after retreating from recent $618 highs, with technical indicators showing mixed signals despite ongoing halving-driven bullish sentiment.
Bitcoin Cash (BCH) Faces $592 Correction After $618 Rally Amid Halving Event Anticipation
BCH price drops to $592.40 (-4.51% in 24h) following recent highs near $618, as traders reassess positions ahead of the upcoming halving event.
Bitcoin Cash (BCH) Breaks Above $620 as August Halving Event Fuels Bull Rally
BCH price surges to $621.90 (+0.84% in 24h) as halving anticipation drives bullish momentum, with technical indicators pointing to potential $634 breakout.
Bitcoin Cash (BCH) Surges to $618 as Halving Event Catalyzes Strong Rally
BCH trades at $618.20, up 4.85% in 24 hours, with technical indicators showing very strong bullish momentum ahead of the August halving event.
Bitcoin Cash Surges to $591 as August Halving Drives BCH Rally Above Key Resistance
Bitcoin Cash (BCH) trades at $590.70 (+2.75% in 24h) with technical indicators showing very strong bullish momentum ahead of the August halving event.
Bitcoin Cash Price Surges to $575 as August Halving Event Drives BCH Rally
BCH trades at $575.70 (+2.27% in 24h) as traders position for the upcoming August halving event, with technical indicators showing very strong bullish momentum.
Bitcoin Cash (BCH) Price Falls 3.97% Despite Upcoming Halving Event
BCH trades at $563.30, down 3.97% in 24 hours, as short-term profit-taking counters halving anticipation with key support at $490.20 under watch.
Bitcoin Cash (BCH) Surges Above $587 as August Halving Event Drives Bullish Momentum
BCH price climbs to $587.20 (+2.17% in 24h) as investors position ahead of the upcoming August halving event, with technical indicators showing strong bullish momentum.
Bitcoin Cash Price Eyes $608 Resistance as BCH Halving Event Drives Bullish Momentum
BCH trades at $574.90 (+0.70%) with strong bullish signals emerging ahead of August halving. Key resistance at $608 could trigger further upside breakout.
Bitcoin Cash (BCH) Surges 2.36% as August Halving Event Draws Near - Technical Analysis Points to $608 Resistance Test
BCH trades at $568.90, up 2.36% in 24h, as investors position ahead of the August halving event. Technical indicators show bullish momentum with key resistance at $608.
Bitcoin Cash (BCH) Surges 3.39% as Bulls Eye $608 Resistance Level
BCH price rallies to $548.50 amid strong bullish momentum, with technical indicators suggesting potential breakout above key resistance levels in coming sessions.
Bitcoin Cash (BCH) Pulls Back to $529 Despite Recent Bullish Breakout Above $580
BCH price retreats 1.10% to $529.90 after surging past $580 resistance. Technical indicators show mixed signals as bulls defend key support levels.
Bitcoin Cash (BCH) Drops 5.1% to $535 Despite Recent Bullish Breakout Predictions
BCH price retreats to $535.40 after failing to sustain momentum above $580 resistance, with technical indicators showing mixed signals as traders reassess risk.
Bitcoin Cash (BCH) Retreats to $554 After Testing $580 Resistance - Key Levels to Watch
BCH price drops 4.92% to $554 despite recent bullish breakout above $580, with technical indicators showing mixed signals as traders eye upcoming halving event.
Bitcoin Cash (BCH) Surges Past $580 as Technical Breakout Signals Bullish Momentum
BCH price climbs 3.47% to $584.60 amid strong technical indicators and network upgrades, with analysts eyeing $620-$680 range as next target zone.
Bitcoin Cash (BCH) Holds $566 Support as Halving Momentum Builds
BCH price trades at $566.60 despite -0.70% daily decline, with strong technical indicators and upcoming halving event driving bullish sentiment ahead of key resistance test.
BCH Price Hits 5-Week High at $581 as Trump Speech Fuels 30% Rally
Bitcoin Cash trades at $581 after surging over 30% following Trump's crypto-positive speech, with BCH RSI at 66.33 signaling potential resistance near $608.
Bitcoin Cash (BCH) Retreats from $607 High as RSI Cools Near Resistance
BCH price pulls back 4.47% to $577.50 after testing critical $608 resistance, but bullish momentum indicators suggest potential continuation of recent rally.
Bitcoin Cash (BCH) Surges to $584.80 as Bulls Test Critical Resistance
BCH price rallies 5.77% to $584.80, approaching overbought territory with RSI at 70.4 as traders eye key $587 resistance breakout.
Bitcoin Cash (BCH) Breaks Above $550 as Institutional Demand Fuels Rally
BCH trades at $557.50 (+5.99%) with strong bullish momentum as institutional interest drives prices above key resistance levels despite recent market headwinds.
Bitcoin Cash (BCH) Breaks $526 Resistance - Bullish Momentum Targets $612
BCH price surges to $526.40 (+1%) after breaking key resistance, with institutional interest driving bullish momentum toward $612 target level.
Bitcoin Cash (BCH) Holds Above $500 Despite Exchange Security Breach - Technical Analysis Points to Continued Strength
BCH price trades at $523.50 (+1.97%) showing resilience after BigONE exchange breach. Technical indicators suggest bullish momentum remains intact with strong institutional backing.
Bitcoin Cash (BCH) Holds Above $520 Despite Exchange Hack Fears
BCH trades at $523.10 after recent surge past $500, but BigONE hack introduces caution. Technical indicators show bullish momentum despite 3.79% daily decline.
Bitcoin Cash Holds $531 Despite Exchange Security Concerns as Bulls Eye $550 Break
BCH price trades at $531.50 (+2.02%) with strong bullish momentum intact despite recent BigONE exchange hack creating temporary headwinds for the market.
Bitcoin Cash Surges Above $500: Technical Upgrades and Institutional Interest Drive BCH Rally Amid Market Volatility
Bitcoin Cash maintains resilience above $500 despite market corrections, driven by institutional demand and technical upgrades while navigating security concerns.
Bitcoin Cash (BCH) Analysis: Holding Above $500 Despite Market Corrections and Security Concerns
BCH maintains resilience above $500 following institutional surge to $526.5, weathering BigONE exchange breach and market corrections with strong technical support.
Bitcoin Cash (BCH) Surges Above $500: Institutional Interest, Technical Upgrades, and Market Insights
Bitcoin Cash (BCH) surpassed $500 amid rising institutional demand and technical upgrades. Explore the latest market trends, technical analysis, and price outlook for BCH.
Bitcoin Cash (BCH) Holds Above $500 Amid Institutional Interest and Technical Upgrades
Bitcoin Cash (BCH) surged past $500 on institutional demand and technical updates but faced market corrections. Explore its current price, trading signals, and future outlook.
Bitcoin Cash (BCH) Price Analysis: Market Correction Amid Institutional Interest and Technical Advancements
Bitcoin Cash (BCH) sees mixed sentiment as institutional interest and technical upgrades fuel growth, while market corrections and regulatory updates challenge momentum.
Bitcoin Cash (BCH) Surges Above $500 Amid Institutional Momentum and Technical Strength
Bitcoin Cash (BCH) surged above $500, fueled by institutional demand, technical upgrades, and Bitcoin’s bullish momentum. Can BCH sustain its rally, or will profit-taking and weakening fundamentals...
Bitcoin Cash (BCH) Surges Above $500: Institutional Momentum and Technical Strength
Bitcoin Cash (BCH) rallied above $500, fueled by institutional accumulation and technical upgrades. With 'Crypto Week' boosting market optimism, BCH could target $550 soon.
Bitcoin Cash (BCH) Surges Above $500: Analyzing Recent Developments, Technicals, and Price Outlook
Bitcoin Cash (BCH) surged above $500, hitting an 8-month high amid institutional interest and technical upgrades. While bullish momentum dominates, security risks and weakening fundamentals pose ch...
Bitcoin Cash (BCH) Surges Above $500 Amid Bullish Momentum and Security Concerns
Bitcoin Cash (BCH) hit an 8-month high of $526.5, fueled by institutional interest and technical upgrades. However, security risks and regulatory shifts pose challenges.
BNB, HT, and FTT Experience a Surge Ahead of Coinbase Listing
Since Coinbase announced its listing, its valuation has gone from 70 billion U.S. dollars to its current value of 91.5 billion U.S. dollars. The direct listing of the exchange had made investors re-examine the future potential of digital currency exchanges and cryptocurrencies. In the past few weeks, the three major platform-derived currencies BNB, HT, and FTT have risen several times.
Binance (BNB) Unveils CPT Framework to Analyze Crypto Market Dynamics
Binance Research introduces the CPT Framework to analyze crypto market dynamics, focusing on capital, people, and technology as key structural drivers.
Bitcoin Whales Double Down as Institutional Confidence Soars
Major Bitcoin investors have accumulated 3,800 BTC in just 30 days as the cryptocurrency surges past $120K, signaling unprecedented confidence.
Bitcoin Lightning Network Continues to Gain Steam, Hitting Historic Highs of 3,436 BTC
After crossing the 3,000 BTC capacity for the first time in October 2021, the Bitcoin Lightning Network does not show signs of slowing down as its upward quest continues.
Is Bitcoin's Price at $10K Stable? Here are Some Factors that Could Influence BTC
Bitcoin's (BTC) price dropped below $10,000 on the weekend, which ended BTC's two-month streak of staying above $10K.
Bitcoin SV (BSV) Surpasses $100
Bitcoin SV (BSV) has surpassed $100 due to strong technical indicators and market activity, especially in South Korea, influenced by market sentiment, technical analysis, and trading volume dynamics.
Bitcoin Transferred $98,769 of Value for Just $1 in Fees Last Month, Analyst Says
Despite the consolidation happening in the Bitcoin market, the leading cryptocurrency has emerged as an efficient settlement network based on the low fees charged.
Bitcoin (BTC) Hits New Heights as Altcoins Surge Amid Market Shift
Bitcoin reaches an all-time high, leading to a surge in altcoins. Market dynamics shift as Bitcoin pauses, allowing Ethereum and XRP to outperform.
Bitcoin (BTC) and Altcoins Face Significant Market Sell-Off
The cryptocurrency market has experienced a sharp downturn, with Bitcoin (BTC) and altcoins facing significant losses. Investors are locking in losses amid volatile market conditions.
BTC Correlates with Equities as Altcoins Show Resilience, Reports Bitfinex
Bitfinex Alpha reveals Bitcoin's correlation with equities while altcoins display stronger performance amid market downturns.
Bitcoin Subreddit Surges as Hedge Funds Short BTC, A Coordinated Crypto Buying Attack?
Will Bitcoin be the next target of a coordinated buying attack as new data reveals Bitcoin subreddit's astronomical growth as well as institutional shorts on the cryptocurrency?
On-chain data is signaling a "generational buying opportunity"
Technical analyst "Game of Trades" discovered six on-chain measurements for his 71,000 Twitter followers. Bitcoin's Realized Price (RP) is an estimate of what the market paid for all coins at their previous price.
Bitcoin Price Aanlysis: Key Technical indicators to watch
Key Technical indicators to watch and Altcoin Season is coming
Bitcoin's Winning Streak Finally Comes to an End
Bitcoin lost its two-week streak. Jan. 18 saw BTC's first red candle. The U.S. Department of Justice statement earlier in the week seems to have caused the price drop.
Bitcoin is Eyeing a New All-Time High This Week, says Market Analyst
Market analyst Lark Davis believes that Bitcoin is getting ready to hit a new all-time high (ATH) this week.
Analyst Honored for Exposing South Korean Dark Web Crypto Child Pornography and Blackmail Site
Criminal analyst, Kim Reece, has been named as a finalist for the Samuel J. Heyman Service to America Medal for her role in the takedown of the South Korean ‘Nth Room’ child pornography chat rooms hosting the content of Welcome to Video blackmail sex and exploitation site.
Bitcoin Pumps to Mid-June Levels following Boris Johnson’s Resignation
Bitcoin (BTC) hit the $22K level, a scenario last seen in mid-June after Boris Johnson resigned as the UK prime minister.
Bitcoin's Largest Price Correction in History, Will BTC Price Continue to Fall?
Over the last 24 hours, the Bitcoin price suffered its largest single-day drop in its short history, falling from a high of $58,000 to a low of $48000. What's next for BTC?
Bitcoin Miners’ Accumulation Has Been Consistent for Nearly a Year
Bitcoin miners have consistently accumulated more coins for almost one year, according to market insight provider Glassnode.
Bitcoin (BTC) Reaches New High: On-Chain Metrics Indicate Market Shift
Bitcoin (BTC) hits a new technical higher high at $66k, with on-chain metrics suggesting a market shift, according to Glassnode Insights.
Bitcoin’s Average Coin Dormancy Hits a 3-Month High
Bitcoin's average coin dormancy has been going through the roof based on the current consolidating market.
New Market Entrants Caused the Recent Bitcoin Panic Selling, says Glassnode
Yann & Jan, the co-founders of on-chain metrics provider Glassnode, have noted that the recent Bitcoin price drop was triggered by new entrants in the market.
Bitcoin Needs to be Consolidated at $35K Level, Analysts predict
Bitcoin was up by 1.78% in the last 24 hours to hit 35,215 during intraday trading. Is a breakout in the BTC market is imminent?
Bitcoin's Key Support Level is at $27000-27,500 if BTC Pullbacks below $30,000, says Analyst
Alex, a market and crypto analyst, has acknowledged that the $27,000-27,500 is the critical support level, which ought to be watched.
Bitcoin’s 30-Day MVRV Shows BTC UnderBought
Bitcoin’s 30-day MVRV, measuring the returns of 30-day trading addresses, shows BTC is underbought.
Bitcoin (BTC) Surges Past Resistance: Analyzing the Rally's Sustainability
Bitcoin (BTC) has broken out of its channel, surpassing a major trendline. Analysts question the sustainability of this rally amid momentum indicators suggesting a potential cooldown.
Bitcoin (BTC) Faces Potential Drop Below $60,000 Amid Bearish Patterns
Bitcoin's price is under pressure due to profit booking and bearish technical patterns, potentially driving it below $60,000, according to CoinMarketCap.
Bitcoin (BTC) Surges After Plunge, Facing Uncertain Recovery
Bitcoin (BTC) sees a sharp 28% rise after hitting $49,000, amidst market volatility and economic concerns, according to Bitfinex Alpha.
Bitcoin (BTC) Sees Largest Pullback of Cycle Before Significant Recovery
Bitcoin experienced its largest pullback of the current cycle, dropping 33.32% before recovering by nearly 28%, according to Bitfinex Alpha.
Bitcoin (BTC) Faces Supply Overhang Challenges in June 2024
Bitcoin (BTC) faces supply overhang issues in June 2024, impacting its market performance, according to Grayscale.
Bitcoin (BTC) Enters Accumulation Phase Amid Market Adjustments
Bitcoin (BTC) enters accumulation phase as market adjusts post-all-time high.
The No. of Non-Zero Bitcoin Addresses Hit a 6-Month High, amid Realized Volatility Drifting to a 1-year Low
Bitcoin has been attracting more participants, given that the number of non-zero BTC addresses reached a 6-month high.
Bitcoin’s Supply Ratio on Exchanges Hit a 26-Month Low as BTC Miner Reserves Edge Closer to an ATH
Bitcoin (BTC) holders continue to show their confidence in the leading cryptocurrency as the supply ratio on exchanges slumped to a 26-month low.
2.3 Million Bitcoins Have not Moved in More Than 10 Years
More than 2.3 million Bitcoins might have been lost based on their immobility for at least ten years.
Bitcoin Needs to Reclaim $53,000 before a Bull Run to be Reignited
With the price staying below the short-term holder (STH) cost basis for nearly a week, on-chain analyst Will Clemente believes that Bitcoin needs to reclaim the $53K area if a bull run is to be reignited.
Bitcoin (BTC) Surpasses $115K: Bullish Surge or Bearish Trap?
Bitcoin (BTC) price breaks out of a triangle pattern, reaching $115,000. Analysts watch for bullish continuation or potential bear trap.
Bitcoin Funding Rates Have Calmed Down - Has Greed in the BTC Market been Neutralized?
Bitcoin funding rates have slowed down since the leading cryptocurrency scaled to new heights of $69,000.
Bitcoin (BTC) Faces Volatility Amid Fed Rate Speculations
Bitcoin surged to $117,000 anticipating a Fed rate cut, then fell to $115,000 due to selling pressure. Market dynamics reflect cautious optimism but highlight volatility risks.
Bitcoin (BTC) Market Analysis: Navigating New Highs and Volatility
Bitcoin's price surges to $121K amid improved on-chain activity and derivatives sentiment, but declining spot volumes and profitability raise caution. Explore key BTC market signals for insights.
Bitcoin (BTC) Faces Deep Correction, Short-Term Holders in Loss
Bitcoin experiences a significant correction, trading below the 200DMA, impacting Short-Term Holders with unrealized losses, according to Glassnode Insights.
Bitcoin (BTC) Profitability Robust Despite Declining Market Volumes
Bitcoin investors maintain strong profitability despite declining volumes and a range-bound market, indicating an equilibrium between demand and sell-side forces.
Bitcoin (BTC) Faces Mixed Market Signals Amidst News-Driven Sentiment
Recent market analysis indicates Bitcoin's price rebound, despite ongoing news-driven sentiment and economic influences, according to Bitfinex Alpha.
Bitcoin (BTC) Faces Major Sell-Off Amid German Government and Mt. Gox Distributions
Bitcoin market faces significant sell-off pressures from the German Government and Mt. Gox distributions, impacting price and investor sentiment.
Bitcoin (BTC) Rally Shows Signs of Maturation Amid Investor Caution
Bitcoin's latest market developments indicate a maturing rally with potential buyer fatigue, as investors and market liquidity signals are closely monitored.
Bitcoin (BTC) Faces Potential Volatility Amid Investor Apathy, Glassnode Reports
Bitcoin (BTC) market shows signs of potential volatility amid investor apathy, with significant unrealized gains and losses, according to Glassnode.
Bitcoin (BTC) Faces Demand Decline as Long-Term Holders Influence Market Dynamics
Bitcoin struggles to reclaim its recent ATH. Analysis on Long and Short-Term investors reveals insights on market dynamics.
Bitcoin Eyes Forming a Weekly Higher Low, What Does This Mean?
A pullback to the $40,000 level reignited the formation of a higher low on the weekly chart.
Bitcoin Might Get More Volatility by the End of the Week, Market Analyst Reveals
Market analyst Lark Davis believes that Bitcoin might get more volatility as the week comes to an end based on the formatting of a triangle pattern.
Bitcoin Price Needs to Hold $31,500 to Avoid Deeper BTC Price Plunge says Tone Vays
Should BTC fall below the $31,500 level—crypto analyst Tone Vays believes we could see a deeper price plunge to the mid $20K range.
Bitcoin Realized Capitalization Hits ATH Amid the Fear and Greed Index, Jumping to Neutral Grounds
Bitcoin realized capitalization has been on an upward trajectory after hitting a record high.
Non-Zero Bitcoin Addresses Reach Historic Highs, BTC’s On-Chain Settlement Efficiency Goes a Notch Higher
Bitcoin is showcasing itself as one of the most efficient monetary settlement networks, given that it transferred an average of $95,142 for a fee of $1 compared to Ethereum’s $139 in the past week.
Bitcoin's Road to $1.5 Million: Cathie Wood's Bold 2030 Prediction
Ark Invest CEO Cathie Wood predicts Bitcoin to reach $600,000 by 2030, with potential for $1.5 million in a bull market scenario.
Bitcoin Price Rally Will Peak Out Early in 2021, according to CNBC Report
As one institutional analyst told CNBC—the Bitcoin price could peak out early in 2021, providing another prime opportunity to buy the BTC price dip.
A Large Portion of Bitcoin Supply Stores in Cold Storage Based on the Bottoming Out of Dormant BTC Supply
Dormant Bitcoin supply for at least one year bottomed out at 54.2%, indicating that a large portion of BTC was stored in the cold storage.
Impact of CPI Announcements on Bitcoin (BTC) Prices Analyzed
Explore how CPI announcements affect Bitcoin prices and the broader influence of central banking policies. Understand Bitcoin's role as an inflation hedge amid fluctuating CPI figures.
Bitcoin Surges Past $24,000 for the First Time, Market Analysts Predict What’s Next for BTC
On Saturday, Bitcoin leaped to record a high of $24,000 for the first time as it enjoys a strong momentum through the year.
Bitcoin (BTC) Market Analysis: Protective Stance Dominates Amidst Volatility
Recent market analysis indicates a shift towards capital preservation, with Bitcoin (BTC) experiencing a sharp price drop and subsequent cautious recovery.
Bitcoin Poised to Set a New All-Time High, says Market Analyst
Market analyst Michael van de Poppe believes that "Bitcoin looks eager for a new all-time high" as it continues regaining momentum.
Bitcoin at $64,000 is Amazing But It’s Just the Start, says Market Analyst
Crypto trader Michael van de Poppe believes that Bitcoin at $64,000 is amazing, but this is just the start.
Bitcoin Supply on Exchanges Diminishes as BTC Stares at Last Key Support Level Above $30,000
As Bitcoin (BTC) eyes for a clear direction outside the $30K-40K range, the top cryptocurrency has been leaving crypto exchanges in droves.
Bitcoin Miners Generated Revenue Worth $1.68 Billion in November
Over the last month, it seems to be a good month for Bitcoin miners because they cashed in a whopping $1.68 billion.
Bitcoin Might Explode Soon as Bollinger Bands Continue to Shrink
On-chain analyst Matthew Hyland believes the current consolidation in the Bitcoin market might be the calm before the storm because the Bollinger Bands (BB) have shrunk to levels last seen in October 2020 when the price was at $10,000.
Bitcoin Whales not Throwing in the Towel, Accumulating 60K BTCs in Last 2 Months
Bitcoin might not have found its right footing since the start of the year, but this has not discouraged whale addresses from accumulating more coins.
Rehab Centers Add Services for Crypto Trading Addicts
A posh Spanish rehab institution now treats crypto traders.
Bitcoin’s Average 30-Day Trader Returns Haven’t Dipped This Low Since Black Thursday
On-chain metrics provider Santiment revealed that the latest correction in the market has made Bitcoin’s average 30-day trader returns slip to lows not seen since Black Thursday.
6.2 Million Bitcoins are Being Held at a Loss, Representing 33% of BTC Supply
Ever since Bitcoin (BTC) nosedived from an all-time high (ATH) price of $64.8K recorded in mid-April, 6.2 million coins are being held at a loss, representing 33% of supply.
Bitcoin Needs to Create a Higher-Low at $31K for an Upward Trend, says Market Analyst
Market analyst Michael van de Poppe believes that Bitcoin should create a higher low at $31k for an upward trend to be ignited as its consolidation continues.
Bitcoin Eyes $60,000 Based On the Formation of an Inverse Head & Shoulder Pattern
Crypto analyst Carl Martin has revealed that Bitcoin is eyeing the $60K price level based on the formation of an inverse head & shoulder pattern.
Strong Hands Have Been Pushing Bitcoin Price Steeply Upwards Since Q4 2020, says Crypto Analyst
Popular market analyst Willy Woo has revealed that strong hands are the engine behind the current Bitcoin bull run because serious investors have been buying every dip.
The Number of Bitcoin Addresses in Profitability Breaks the Record, Price Inches Closer to ATH of $64,800
The number of Bitcoin addresses in profit has reached a record high of 37,396,654.839. The market is expecting Bitcoin to break through $64.8K ATH level.
Is the Narrative about Bitcoin’s 4-Year Halving Cycle Diminishing?
With Bitcoin’s current return of approximately 456% since the third halving event in May 2020, this is a notable underachievement compared to the two previous cycles, which had recorded 1,355% and 4,974% respectively at this point in time.
Bitcoin Circulation and Active Addresses Holding Steadily Despite Retracement
Bitcoin’s active addresses and circulation have not slowed down, despite the present correction because they have remained relatively strong.
BTC Leaps Over 12% to Six-week High, Analysts Predicts Individual Trades Could Influence on the Bitcoin Market
Bitcoin leaps over 12% to a six-week high on Monday morning in the Hong Kong section, rebounding to $38,643.13 in the past 24 hours. Prior to the latest surge, on-chain metrics provider Santiment believes that individual trades will significantly impact the BTC market based on low daily trading volume.
Bitcoin Flows into Ethereum Network and Corporate Treasuries as WBTC
Throughout 2021, Bitcoin’s circulating supply has experienced significant changes as part of it has flowed into the Ethereum (ETH) network, exchange-traded investment vehicles, and corporate treasuries in the form of WBTC.
Bitcoin (BTC) Rebounds to $121K Amid Mixed Market Signals
Bitcoin's price recovers to $121K, showing improved on-chain activity and derivatives sentiment. However, declining spot volumes and high profitability suggest cautious optimism.
Bitcoin (BTC) Faces Fragility Amid Market Volatility and Weak On-Chain Activity
Bitcoin's market pulse reveals fragility with oversold conditions, cautious futures, and renewed ETF inflows. On-chain activity remains weak as BTC tests key support levels.
Bitcoin (BTC) Approaches $70,000 Amid High Open Interest and Stable Funding Rates
Bitcoin nears the $70,000 mark as open interest in futures hits a record high, with stable funding rates indicating a healthy market environment, according to Bitfinex Alpha.
Bitcoin Needs to Hold the $45K to $47K Zone for a Bullish Momentum
Analysts suggest that bitcoin should hold the $45,000 to $47,000 area for an upward momentum to reignite.
Bitcoin Becoming less Jittery against Volatility
Market analyst Holger Zschaepitz believes Bitcoin is slowly coming of age because mild price swings have not been witnessed days after hitting a new all-time high of $66,900.
Greed Caused the Bitcoin Price 20% Plunge, Will BTC Price Rise Again?
The Bitcoin price suffered a massive correction falling from its recent high of $41,500 to an intraday low of $32,829, but what happened and where is BTC headed next?
Bitcoin (BTC) Faces First Major Correction Amid Economic Strains
Bitcoin experiences a significant correction after a 50% surge, while macroeconomic pressures and trade tensions influence market dynamics, according to Bitfinex Alpha.
Bitcoin (BTC) Surges to New All-Time High Amid Strong ETF Inflows
Bitcoin reaches a new peak near $126k, driven by robust ETF inflows and renewed mid-tier accumulation, while rising leverage suggests potential short-term volatility.
Bitcoin (BTC) Nears $100K Amidst Long-Term Holders' Distribution
Bitcoin approaches the $100K mark as Long-Term Holders distribute 507k BTC. The surge in price action sets a new ATH in daily realized profits.
Bitcoin (BTC) Shows Signs of Recovery Amidst Cautious Market Sentiment
Bitcoin stabilizes near $91K after a rebound, with mixed signals from on-chain, derivatives, and ETF indicators, according to Glassnode's latest analysis.
Bitcoin (BTC) Faces Market Structure Similar to Q1 2022 Amidst Weakening Demand
Bitcoin stabilizes above key levels, yet market dynamics echo early 2022 with over 25% supply underwater. Demand weakens across ETFs and futures, posing risks.
Bitcoin (BTC) Market Shows Signs of Stabilization Amid Easing Sell Pressure
Bitcoin's market shows early signs of stabilizing after a deep oversold slide, with easing sell pressure and renewed institutional interest, according to Glassnode's latest analysis.
Bitcoin (BTC) Approaches Local Bottom Amid Institutional Interest and Market Stabilization
Bitcoin (BTC) shows signs of reaching a local bottom as institutional interest grows and market stabilization is underway, according to Bitfinex Alpha.
Bitcoin (BTC) Faces Liquidity Challenges Amid Fragile Market Conditions
Bitcoin struggles in a tight $81K–$89K range as liquidity wanes. Realized losses surge, with futures and options markets adopting cautious stances, according to Glassnode.
Bitcoin (BTC) Faces Pressure as Market Demand Weakens and Derivatives Reflect Caution
Bitcoin slips below key cost-basis models amid waning demand and ETF outflows, with derivatives markets showing increased caution and hedging activity, according to Glassnode.
Bitcoin (BTC) Faces Resistance Amidst Cautious Market Dynamics
Bitcoin remains in a bearish range with resistance at $106K-$118K. ETF outflows and low leverage reflect a cautious market, awaiting renewed conviction for a breakout.
Bitcoin (BTC) Tests $100K Support Amidst Market Stabilization Efforts
Bitcoin retests the $100K mark, a critical support level, as market conditions show signs of stabilization. Explore the latest market dynamics and on-chain indicators.
Bitcoin (BTC) Faces Resistance as Market Calmness Prevails
Bitcoin remains range-bound between $106,000 and $116,000 amid weak institutional demand and long-term holder distribution, according to Bitfinex Alpha.
Bitcoin (BTC) Faces Downward Pressure Amid Long-Term Holder Distribution
Bitcoin struggles to maintain key levels as long-term holders continue to sell. Market dynamics hinge on Federal Reserve's upcoming decisions, potentially influencing volatility.
Bitcoin (BTC) Market Stabilizes Despite Muted Participation
Bitcoin shows signs of stabilization with eased selling pressure and improved profitability, yet on-chain activity remains subdued, according to Glassnode's latest market analysis.
Bitcoin (BTC) Faces Market Uncertainty Amid Critical Trendline Breakdown
Bitcoin's recent fall through a crucial trendline raises concerns about the bull market's future, yet indicators suggest potential for a rally by year's end.
Bitcoin (BTC) Faces Market Turbulence Amidst Demand Exhaustion and Defensive Sentiment
Bitcoin trades below key cost levels, highlighting demand exhaustion and a cautious market sentiment. Long-term holders increase selling, as options market shows defensive trends.
Bitcoin (BTC) Sees Whale Interest: Could It Reach $110,000?
Whales are increasingly investing in Bitcoin, with long positions accounting for over half of the market. Could this trigger a BTC surge to $110,000?
Bitcoin (BTC) Surges to New All-Time High, Bolstered by Strong October Start
Bitcoin reaches a new all-time high on Bitfinex at $125,710, driven by reduced selling pressure and strong market fundamentals as October, historically a bullish month, begins strongly.
Bitcoin (BTC) Holds Key Support Amidst Market Adjustments
Bitcoin defends key support levels, with ETFs and long-term holders providing stability. Options markets reset post-expiry, setting the stage for cautious Q4 optimism.
Bitcoin's Evolution and Market Impact Detailed in CoinGecko's 2025 Report
CoinGecko's 2025 report offers insights into Bitcoin's performance, adoption trends, and innovations, highlighting its evolving role beyond digital currency.
Bitcoin (BTC) Faces Market Exhaustion Amid ETF Inflow Slowdown
Bitcoin shows signs of exhaustion post-FOMC rally with long-term holders realizing significant profits. ETF inflows slow, indicating potential market cooling.
Bitcoin (BTC) Faces Critical Price Range Amidst Market Dynamics
Bitcoin remains in a crucial price range as profit-taking and declining ETF inflows affect momentum. Derivatives play a pivotal role in maintaining market balance.
Bitcoin (BTC) Faces Uncertainty as Market Consolidates in Key Price Range
Bitcoin consolidates between $104k-$116k amidst cooling ETF flows. A break above $116k could revive the uptrend, while a fall below $104k may signal further decline.
Bitcoin (BTC) Faces Key Support Challenges Amid Market Stress
Bitcoin's recent decline to $111k tests crucial support levels amid market stress, with potential for deeper losses. Analysis suggests cautious sentiment as spot demand neutralizes and perpetual futures lean bearish.
Bitcoin (BTC) Faces Post-ATH Challenges Amid Low Liquidity and ETF Outflows
Bitcoin's price struggles below $116k, facing low liquidity and ETF outflows while investors remain cautious. Short-term holders' profitability declines as the market seeks support.
Bitcoin (BTC) Market Momentum Cools Amid Thinning Liquidity and Seller Exhaustion
Bitcoin experiences a pause in its rally as market momentum cools across spot, futures, options, and ETF markets, signaling potential downside risks.
Bitcoin (BTC) Faces Consolidation Amid Market Volatility and Dropping Leverage
Bitcoin's recent dip below $115,800 reflects broader market de-risking, with altcoins hit hard. Institutional interest and regulatory changes may shape future trends.
Bitcoin (BTC) Resilience Amid Rising Leverage: A Market Overview
Bitcoin's recent price rebound highlights its structural strength despite increased leverage in altcoins, posing risks of potential deleveraging events, according to Bitfinex Alpha insights.
Bitcoin (BTC) Surpasses $120K Amid Rising Investor Optimism
Bitcoin's price has surged past $120,000 as investor confidence grows. The latest analysis highlights increased spot and ETF flows, aggressive futures positioning, and elevated on-chain profitability.
Bitcoin (BTC) Reaches New All-Time High Amid Market Resurgence
Bitcoin has broken through its previous trading range to reach a new all-time high of $123,120, driven by ETF inflows and increased accumulation by smaller investors.
Bitcoin (BTC) Eyes $110K Amid Mixed Market Signals
Bitcoin approaches $110K as key indicators show bullish momentum, though weak spot volumes and ETF flows suggest cautious investor sentiment.
Bitcoin (BTC) Consolidation Amid Whale Activity and Institutional Interest
Bitcoin remains in a consolidation range between $100,000 and $110,000, as whale activity slows and new institutional interest emerges, according to Bitfinex.
Bitcoin Gains as Altcoins Falter in June 2025 Amid Institutional Inflows
Bitcoin rose 3% in June 2025 due to strong ETP inflows, contrasting with the decline in altcoins, highlighting institutional demand and market fragility, according to VanEck.
Bitcoin (BTC) Market: Institutional Strength Amid Retail Fragility
Bitcoin shows cautious optimism with institutional backing and renewed accumulation, but retail participation remains weak, according to Glassnode's latest market analysis.
Bitcoin (BTC) Investors See Renewed Profits Amid Price Stabilization
Bitcoin has rebounded to $107K, pushing many investors back into profitability. Despite this, HODLing prevails as investors show reluctance to sell at current levels.
Bitcoin (BTC) Stabilizes as Q3 Approaches Amid Market Cooling
Bitcoin stabilizes between $100,000 and $110,000 after an explosive rally, with market activity cooling. The US economy's conflicting signals add uncertainty to the Federal Reserve's decision-making.
Bitcoin (BTC) Stagnates in $100k-$110k Range Amid Cooling Metrics
Bitcoin remains range-bound between $100k and $110k, with fading spot volume and cautious futures sentiment suggesting limited upside without increased demand.
Bitcoin (BTC) Faces Critical Juncture Amid Market Volatility
Bitcoin experiences a significant price correction amidst strong spot demand and macroeconomic risks, with over $1.9 billion liquidated in a week, according to Bitfinex Alpha.
Bitcoin (BTC) Nears All-Time High Amidst Market Volatility Concerns
Bitcoin approaches its all-time high, recovering from a recent dip. Market dynamics suggest underlying volatility as investor activity intensifies, according to Glassnode.
Bitcoin (BTC) Faces Critical Juncture Amid Market Volatility
Bitcoin's recent drop from its all-time high highlights the challenges posed by macro risks and liquidation events. Analysts observe key support levels and a potential shift in market dynamics.
Bitcoin (BTC) Faces Profit-Taking Pressure as It Retraces from New ATH
Bitcoin hit a new all-time high of $111.8k but is experiencing a pullback due to profit-taking by long-term holders. Key support levels are at $103.7k and $95.6k.
Bitcoin (BTC) Stalls Below $111K: Market Faces Broad Cooldown
Bitcoin's price momentum has stalled below $111K, leading to a market cooldown. On-chain data suggests consolidation, while ETF flows and derivatives show cautious positioning.
Bitcoin (BTC) Faces Potential Profit-Taking Amid Market Resilience
Bitcoin reaches a new high of $111,880, driven by ETF inflows and market dynamics, as it faces potential profit-taking. U.S. economic concerns add complexity to the crypto market outlook.
Bitcoin (BTC) Sets New ATH Amidst Market Activity Surge
Bitcoin has reached a new all-time high of $111k, marking a significant milestone in its current cycle. This achievement has spurred increased activity across major market sectors.
Bitcoin (BTC) Surges to New Heights Amid Strong Market Demand
Bitcoin continues its upward trajectory, reaching new highs due to robust market demand and structural resilience, according to Bitfinex Alpha.
Bitcoin (BTC) Surges to $106K, Enters High-Risk Zone Amid Market Cooling
Bitcoin reaches $106K, placing 97% of supply into profit. Despite strong ETF and Options markets, cooling netflows and weakening Spot and Futures activity suggest a potential market correction.
Bitcoin (BTC) Surges Past $100,000 Amid Favorable Market Conditions
Bitcoin has surpassed the $100,000 mark for the first time in over three months, driven by macroeconomic factors such as easing tariff tensions and a dovish Federal Reserve stance.
Bitcoin (BTC) Market Analysis: High-Risk Structure Amid Surging Prices
Bitcoin witnesses a high-risk, high-reward market structure with 94% of supply in profit, as prices soar to new highs. Insights on spot-driven rallies and derivatives market trends.
Bitcoin (BTC) Surges to Two-Month High, Sparks Capital Inflows and Market Optimism
Bitcoin's price reaches $97.9k, the highest in two months, igniting renewed capital inflows and easing financial stress among investors, according to Glassnode.
Bitcoin's April Surge Sets Stage for a Promising Summer
Bitcoin (BTC) experienced a remarkable 14.08% increase in April, surpassing expectations and suggesting a bullish trend for the upcoming summer, according to Bitfinex Alpha.
Bitcoin (BTC) Surges in April, Setting Stage for Potential Summer Gains
Bitcoin (BTC) closed April with a 14.08% gain, setting the stage for potential summer growth amid macroeconomic challenges and shifting risk sentiment, according to Bitfinex Alpha.
Bitcoin (BTC) Faces Volatility Amidst Market Adjustments and Global Economic Challenges
Bitcoin remains in a trading range with significant market adjustments as global economic uncertainties loom, according to Bitfinex Alpha.
Bitcoin (BTC) Trading Stagnates Amid Market Volatility and Economic Uncertainty
Bitcoin remains in a tight trading range as volatility spikes following a Bybit hack and S&P 500 sell-off, with broader crypto market corrections and economic challenges looming.
Bitcoin (BTC) Faces Market Cooldown Amidst Declining Capital Inflows
Bitcoin's (BTC) market momentum declines as capital inflows weaken across digital assets. Ethereum, Solana, and Memecoins see significant corrections, reflecting shifting investor sentiment.
Bitcoin (BTC) Surges to New ATH Amidst Declining Sell-Side Pressure
Bitcoin reaches a new all-time high of $109k after months of consolidation. Analysis reveals diminishing sell-side pressure and signals of potential market volatility, according to Glassnode.
Bitcoin (BTC) Supply Faces Potential Shortage Amid Rising Prices
Bitcoin's supply is tightening as its price reaches new highs, creating a bullish outlook for the cryptocurrency market, according to Bitfinex Alpha.
Bitcoin (BTC) Stabilizes Around $100,000 Amid Market Volatility
Bitcoin recently surpassed the $100,000 mark, reaching an all-time high of $104,000 before experiencing a significant correction. Market dynamics and economic indicators suggest a potential continuation of its bullish trend.
Bitcoin (BTC) Consolidates at $100,000 Amid Market Volatility
Bitcoin recently breached the $100,000 mark, reaching a high of $104,000 before a sharp correction. Market indicators suggest possible stabilization despite recent fluctuations.
Bitcoin (BTC) Could Surpass $100,000 Amid Short-Term Demand Growth, Bitfinex Reports
According to Bitfinex, Bitcoin's recent performance suggests potential growth beyond $100,000, driven by short-term demand catching up with long-term supply dynamics.
Bitcoin (BTC) Nears $70,000 Amid Rising Open Interest and Neutral Funding Rates
Bitcoin's recent surge towards $70,000 is supported by increased open interest and neutral funding rates, indicating strong market participation and potential regulatory shifts.
Bitcoin (BTC) Price Decline Raises Uncertainty Amid Market Volatility
Bitcoin's price dropped by 10% due to market sell-offs and geopolitical tensions, creating uncertainty about its future direction, according to Bitfinex Alpha.
Bitcoin (BTC) Faces Volatility: Healthy Pullback Amid Uncertain Market Outlook
Bitcoin experiences a 10% pullback due to aggressive spot selling and geopolitical tensions, with market uncertainty persisting despite a recent rebound.
Bitcoin (BTC) Market Faces Stagnation Amid Low Capital Flows
The Bitcoin market is experiencing stagnation with minimal capital inflows and outflows, suggesting potential for future volatility, according to Glassnode Insights.
Bitfinex: Bitcoin (BTC) Faces Selling Pressure from Whales, Long-Term Holders, and Miners
Bitcoin faces selling pressure as whales, long-term holders, and miners offload assets, influencing market trends, according to Bitfinex Alpha.
Bitcoin's Historic $100k Milestone Marks New Era in Crypto Adoption
Bitcoin's price surpasses $100,000, marking a significant milestone in its evolution, driven by robust network growth, institutional adoption, and increased market capitalization.
Bitcoin (BTC) Surpasses $100,000 Amid Market Optimism for 2025
Bitcoin reaches a new milestone with a market cap exceeding $2 trillion and a price of $100,000, as analysts look ahead to a promising yet volatile 2025.
Bitcoin (BTC) Faces Volatility Amid Geopolitical Tensions and Market Uncertainty
Bitcoin experiences volatility as geopolitical tensions rise, impacting market sentiment. Despite challenges, strategic pivots in the crypto sector suggest potential resilience.
Bitcoin (BTC) Faces Pressure Amid Weak Demand and Rising Losses
Bitcoin remains in a fragile state with unrealized losses increasing, long-term holders selling, and demand weakening, according to Glassnode's latest analysis.
Bitcoin (BTC) Surges Beyond $82,000 Amid Renewed Investor Interest
Following Donald Trump's re-election, Bitcoin experiences a 23% price surge, reaching new highs above $82,000. Institutional demand and ETF inflows bolster the market's momentum.
Bitcoin Bleeds Across the Board as BTC Drops to a 6-Week Price Low
Market analyst Joseph Young believes that fear is causing the Bitcoin market to drop.
Bitcoin (BTC) Surpasses $75K Amid US Election Influence
Bitcoin reaches a new all-time high of $75.4K, driven by US election dynamics. Market volatility surges as investors hedge positions in anticipation of further price movements.
Bitcoin Edges Close to Hit the 200-Day Moving Average
Market analyst Lark Davis disclosed that Bitcoin's regained momentum has pushed the top cryptocurrency closer to the 200-day MA.
Bitcoin (BTC) Surges to New Heights, Eyes $130K Amid Bullish Momentum
Bitcoin reaches an all-time high of $122.6k, with potential to hit $130k. On-chain metrics suggest bullish momentum, though caution is advised as demand-side stress emerges.
Bitcoin (BTC) Faces Limited Momentum Amid On-Chain Activity Slowdown
Bitcoin remains in the $100,000-$110,000 range, with decreasing on-chain activity and profit-taking. Market dynamics suggest limited momentum unless demand increases.
Bitcoin (BTC) Faces Volatility Amid U.S. Election Uncertainty
Bitcoin's recent rally meets resistance amidst U.S. election uncertainty, while altcoins face challenges. Market dynamics are influenced by economic resilience and evolving crypto regulations.
Bitcoin Price on Course to $100,000 by 3rd Quarter of 2021, says 10T Holdings Co-founder
Dan Tapiero, the co-founder of fintech and digital assets firm 10T Holdings, believes that BTC has not missed a step in its journey of hitting $100,000 by the third quarter of 2021.
Bitcoin Prices Hold Tight above $20K Level, But Downsides Still Imminent
Bitcoin is still at risk due to bad economic news such as inflation data, and Federal Reserve meetings, among others.
Bitcoin and Ethereum Near Milestones Amid Market Surge
Bitcoin's Realized Cap hits a new high, while Ethereum's price surges following the Pectra upgrade, marking significant milestones for both cryptocurrencies.
Bitcoin (BTC) and Ethereum (ETH) Lead Digital Asset Outflows Amid Broad Market Sell-Off
Digital asset investment products experienced significant outflows totaling $528M, led by Bitcoin (BTC) and Ethereum (ETH), amid recession fears and geopolitical concerns, according to CoinShares.
Bitcoin Struggles to Maintain Above $40,000 Level as Ethereum, Dogecoin, And Litecoin Follow Suit
Bitcoin plunged by 3% following Elon Musk’s tweet about the leading cryptocurrency. Other altcoins seem to have followed suit.
ETH and XRP Price Analysis: November 25, 2020
Following an impressive week-long growth, ETH and XRP are now slowing their paces. This piece explores the TA behind the current price dip.
Bitcoin (BTC) Reclaims Key Levels Amid Federal Reserve Rate Cut
Bitcoin has reclaimed the Short-Term Holder cost basis of ~$61.9k following a 0.5% interest rate cut by the Federal Reserve.
Bitcoin Fear & Greed Index Indicates Extreme Fear, Suggesting Considerable Uncertainty in the Market
Market analyst Lark Davis believes that FUD (fear, uncertainty & doubt) has engulfed the BTC market based on the fear & greed index.
Bitcoin Futures Market is in a Healthy Contango,Indicating that the Price of Bitcoin will Rise Further
The BTC futures market has been scaling the heights based on an uptick in price, which means the market expectations are for higher prices in the future.
Glassnode Unveils Latest Insights in The Bitcoin Vector #33
Glassnode releases The Bitcoin Vector #33, providing advanced market analysis and on-chain research in collaboration with Swissblock and Willy Woo.
Glassnode and Swissblock Release Bitcoin Vector Report
Glassnode, in collaboration with Swissblock and Willy Woo, presents the Bitcoin Vector #30, offering insights into Bitcoin, Ethereum, and DeFi markets.
Glassnode Unveils Bitcoin Vector #29: A Collaboration with Willy Woo
Glassnode, in collaboration with Willy Woo and Swissblock, launches the 29th edition of Bitcoin Vector, offering in-depth market analysis on Bitcoin, Ethereum, and DeFi.
Glassnode Unveils Bitcoin Vector #28 with Swissblock and Willy Woo
Glassnode presents The Bitcoin Vector #28 in collaboration with Swissblock and Willy Woo, offering insights into Bitcoin, Ethereum, and DeFi markets.
Glassnode Introduces Bitcoin Vector #26 with Swissblock and Willy Woo
Glassnode, in collaboration with Swissblock and Willy Woo, unveils the latest edition of the Bitcoin Vector, offering in-depth market analysis and novel on-chain research.
Glassnode Releases The Bitcoin Vector #20
Glassnode unveils The Bitcoin Vector #20, developed by Swissblock with Willy Woo, offering premium market analysis on Bitcoin and Ethereum.
Glassnode Unveils Bitcoin Market Insights in Week 17 Report
Glassnode, in collaboration with Swissblock and Willy Woo, has released its latest Bitcoin market insights, providing comprehensive analysis and on-chain research.
Glassnode and Swissblock Unveil Bitcoin Vector Analysis
Glassnode collaborates with Swissblock and Willy Woo to present the Bitcoin Vector, offering insights into Bitcoin, Ethereum, and DeFi markets.
Glassnode and Swissblock Unveil Latest Bitcoin Analysis in 'The Bitcoin Vector #21'
Glassnode collaborates with Swissblock and Willy Woo to release 'The Bitcoin Vector #21', offering insights into Bitcoin, Ethereum, and DeFi markets.
Glassnode and Willy Woo Collaborate on Bitcoin Report Focusing on Sentiment and Liquidity
Glassnode partners with Willy Woo to release 'The Bitcoin Vector #24,' a report analyzing Bitcoin's sentiment, structure, and liquidity using Swissblock's framework and on-chain analytics.
Bitcoin (BTC) Market Volatility Intensifies Amid Gold Price Pullback
Bitcoin's rally reverses as gold experiences an 8% pullback, raising questions about future market trends. Learn more about the impacts on BTC prices.
Google Search Trends Show a Strong Correlation with Bitcoin Price
Google search trends have been positively correlated with Bitcoin price based on the current market trend.
Bitcoin Hashrate Has Almost Completely Recovered after Dropped by 93%
Bitcoin miners have been on the right footing after relocating other areas like the United States, Kazakhstan, and Iraq because the hashrate has nearly fully recovered based on a 93% surge.
Bitcoin Hodlers’ Accumulation Continues, Ruble-Denominated BTC Volumes Hitting 9-Month High
Bitcoin hodlers remain unfazed despite the leading cryptocurrency recently hitting lows of $34,000 as they continue accumulating more coins.
Bitcoin Addresses Holding Over 10,000 Coins Hit a Monthly High
The number of Bitcoin addresses holding at least 10,000 coins reached a monthly high of 86 as the holding culture continues being a favoured strategy in this market.
Bitcoin (BTC) Consolidates Amid Inflation Surge and Market Uncertainty
Bitcoin remains in a consolidation phase, trading between $91,000 and $102,000, as inflation surges and geopolitical tensions weigh on market sentiment.
Bitcoin Climbs to $40K Despite Fed’s Interest Rate Hike, Is Sell The Rumor Buy The News Playing Out?
Despite the Federal Reserve (the Fed) increasing interest rates by half a point (0.5%), Bitcoin soared by 6% to reach $40,002.
Bitcoin Price Could Drop in the Short Term As BTC Consolidates at $46K
The Bitcoin price traded to a new all-time high at $48,308 before correcting lower and now appears to have hit a short-term downward trend. Where to next for the BTC price?
Bitcoin Price Smashes $35,000 to New ATH, What's Next for the BTC Price?
Bitcoin price has surged to a new all-time high again on Jan. 6 with crypto bulls pushing BTC above $35,000 after days of consolidation in the low $30,000 range.
2 Reasons Why Bitcoin Price Should Reclaim $34,000 This Week
Bitcoin plunged by over 16 percent to an intraday low of $27,678 on Monday before recovering above the $30,000 level. Here are two reasons to expect a further BTC price rally.
Will Bitcoin Rise, Consolidate or Crash After BTC Price Rally to $40,000?
The Bitcoin price set yet another all-time high with BTC rallying to $40,394 making an 11% gain yesterday before dropping $3,500. Where to next for the Bitcoin price?
Why Bitcoin Investors Shouldn’t Expect a Straight Moon Shot Over $20,000 Just Yet
Although the Bitcoin price gained 166% this year, the pioneer crypto has not yet produced the anticipated moon shot over $20,000 and investors could be in for a long wait.
$100,000 Forecasted as the Largest Strike Price for Bitcoin Options this Year, Analysis Predict
The biggest strike price for BTC options is $100,000 with an open interest (OI) of $500 million.
Long-Term Holder Supply Shock Ratio Breaks Record as Bitcoin's Price Hits 6-Month High of $60K
On-chain analyst Will Clemente believes the next few months will be wild to Bitcoin, given that the long-term holder supply shock ratio is at an all-time high (ATH).
Bitcoin Supply is Moving to Strong Hands amid BTC On-Chain Analysis Going Mainstream
The current Bitcoin correction has not dampened the spirits of strong hands, investors who hold for future purposes because they are accumulating more coins.
Bitcoin Net Inflows Records $315 Million in Total in October
October will be written in Bitcoin’s history books as the month that saw the top cryptocurrency break the record by soaring to the $66,900 level.
Bitcoin Supply in Profit Drops to 83%, Short-Term Holders Blamed to be the Primary Culprits
The current retracement has triggered a 17% loss in Bitcoin supply, with short-term holders who bought the top to be blamed as primary culprits.
Retail Investment Slips as New Bitcoin Addresses Drop
Retail investment in the Bitcoin (BTC) market seems to have dried up based on the drop in new addresses.
Large Institutional Transactions Take the Lion’s Share of Bitcoin Volume at 99%
Institutional demand for Bitcoin does not seem to be fading based on the large transactions volume witnessed, according to a report by IntoTheBlock.
Bitcoin Scarcity Scales the High as Illiquid Supply Hits 85% in the Last Three Months
92% of Bitcoin supply hasn't moved in at least 30 days and 85% of this has been immobile for at least 3 months.
Bitcoin Lightning Network Hits ATH, Signalling Heightened Grounds for Adoption
The Bitcoin Lightning Network continues going through the roof by making historic highs.
Long Term Bitcoin Holders Taking Profits but not Exiting in Masses
Bitcoin has been correcting and this trend can be explained by the fact that long-term holders (LTHs) have been taking profits
Bitcoin Addresses at a Loss Hit a 2-Year High as Extreme Fear Engulfs the Market
The bearish momentum witnessed in the Bitcoin (BTC) market has made addresses at a loss to climb to a two-year high.
64% of Bitcoin’s Circulating Supply Stagnated for more than 12 Months as Accumulation Continues
The amount of Bitcoin’s circulating supply that has stagnated for at least a year hit an all-time high (ATH) of 64%, signaling a supply deficit.
Bitcoin Hits New All-Time High Above $62,000
BTC has scaled a new height by surging past the $62k mark, a fate not seen in its twelve-year journey.
Bitcoin Continues Holding Above the 200 MA, with $34K Being the Redline
With the 200-day moving average (MA) being a significant indicator used to determine the general market trend, Bitcoin (BTC) continues trading above this line.
Bitcoin’s Significant Support Stands at $42.2K, Illiquid Supply Soars for 214 Days
Based on Bitcoin’s transaction history, notable support lies at the $42,260 as many addresses bought coins at this level.
Bitcoin Needs to Hold the $36K-$37K Support Level, Avoid Further Downward Momentum
To avoid a further slip, Bitcoin needs to hold the zone between $36,000 and $37,000.
Is Bitcoin Eyeing a Strong Movement amid Hodled Coins Hitting a 5-Year High?
Bitcoin might be geared toward a strong movement based on declining historic volatility.
Bitcoin Needs to Continue Standing above $19,200 to Dilute Downward Pressure, Analyst Says
Market analyst Ali Martinez believes the leading cryptocurrency should stand above $19,200 to reduce selling pressure because this is a significant level.
Bitcoin Slips to $34.5K, Are Short-Term Holders Behind the Selling Pressure?
Bitcoin has been downtrending since May 5, and liquidation in the market continues over the weekend.
Bitcoin’s Small to Mid-Sized Addresses Continue Going Through the Roof
As Bitcoin continues hovering around the $19K zone, small to mid-sized addresses are scaling the heights, according to Santiment.
Institutional Investors are not Yet Buying Bitcoin as Price Slips Below $20K
After enjoying notable momentum above $20,000, Bitcoin (BTC) slipped below this psychological price amid low appetite from institutional investors.
Bitcoin’s Social Dominance Hits 2-Months High
Interest for Bitcoin spiked on social platforms over the weekend, leading to its social dominance surging, according to Santiment.
Bitcoin Hodlers Remain Steadfast, Coins Aged over 3 months Hit ATH of 86.3%
Despite Bitcoin lacking a significant upward momentum, this has not dampened the spirits of hodlers because coins aged at least 3 months hit an ATH of 86.3%, according to Glassnode.
Bitcoin Briefly Slips Below $20K amid Fed Chair’s Revelation that Rate Tightening will Continue
Bitcoin (BTC) nosedived below the psychological price of $20,000 as recession, and rate tightening fears engulfed the market.
Bitcoin Dipped below 100-hour MA, Triggering Further Downswing, Analyst Suggests
Bitcoin dipped below the 100-hour MA, triggering a continuous downswing. Analysts suggest the leading crypto might further drop to a level between $19.3K and $18.6K.
Bitcoin Looks Set to Make the Highest Weekly Surge Since March
Bitcoin (BTC) has been sluggish for the past couple of weeks, but this might change because it is on course for its highest weekly gain since March.
Following a Bullish Breakout, Will Bitcoin Touch $25K Level?
After experiencing notable back and forth around the psychological price of $20,000, Bitcoin got a sigh of relief after pumping to mid-June levels of $22K.
Is Bitcoin Gearing Up for Consolidation Before Triggering a New Bullish Cycle?
With Bitcoin (BTC) hovering around the 200-week moving average (MA), some analysts believe that the top cryptocurrency might be laying grounds for a ranging market that would, later on, prompt a bullish cycle.
Bitcoin Touches $21K amid Fed's Interest Rate Hike Hitting a 28-Year High
Bitcoin (BTC) was up by 2.90% in the last 24 hours to hit $21,782 during intraday trading, with news about the Federal Reserve’s interest rate increase of 75 basis points (bps) making airwaves.
As Bitcoin Stares at the Psychological Price of $20,000, Will it Hold?
After months of consolidation between the $28K and $32K zone, a bullish or bearish run was imminent, and Bitcoin (BTC) has taken the latter route.
Bitcoin Needs Upward Catalyst to Exit the Current Range as Scepticism Mounts, Says Expert
The retracement to the $29K zone has jeopardized the much-anticipated Bitcoin (BTC) recovery as skepticism engulfs the market.
Bitcoin Breaches Psychological Level of $30K amid Dollar Index Slipping
After printing nine consecutive weekly red candles, a scenario not seen in its 13-year journey, Bitcoin (BTC) is back to winning ways after topping the psychological price of $30,000.
Bitcoin Regains Momentum to Breaches $30K
After nosediving to lows of $26K, a scenario that was last seen in December 2020, Bitcoin (BTC) has gained momentum and breached the psychological price of $30,000.
Bitcoin’s Profit-Taking Skyrockets, Will $40K to Be Reclaimed?
Profit-taking tendencies in the Bitcoin market contributed to the price dropping below the psychological price of $40,000.
Bitcoin Gains Momentum after Hitting Lows of $37,500 as Altcoins Bleed
After hitting lows of $37,585 over the weekend, Bitcoin has gained some momentum by breaching the $38K level.
Crypto Trading Volume Picks Up as Bitcoin Breaches $40K Level
After dropping to lows of $38.5K over the Easter weekend, Bitcoin has gained momentum and breached the psychological price of $40,000 based on an uptick in trading volume.
Double Bottom Pattern Playing Out in the Bitcoin Market, Is $50K in Sight?
A double bottom pattern continues to play out in the BTC market because the leading cryptocurrency has remained steadfast above the psychological price of $40,000 for the past few days.
Bitcoin Needs to Break $44.5K Resistance, before Pushing Forward to $48K Level, says Analysis
Bitcoin needs to break through $44,500 so that the current range can be shattered, which will be instrumental in driving the price to the $48K area.
Bitcoin Should Reclaim the $40K to $42K Zone, Which Has Served as Support and Resistance for a Year
Bitcoin’s intention to breach the high resistance area between $38,000 and $40,000 continues.
Retail Investment in Bitcoin Dries Up as Price Hovers Below $50K on NY's Eve
Retail interest in the Bitcoin (BTC) market has been down-trending as Google search volume hit yearly lows.
Bitcoin's Consolidation Continues amid Addresses Holding BTC Scaling the Heights
Bitcoin has consolidated between the $38K and $45K zone for the past two months, as indecisiveness continuously rocks the market, even though BTC addresses continue going through the roof.
Long-Term Hodlers Remain Unfazed, Despite Bitcoin’s Sentiment Hitting Rock Bottom
As Bitcoin stagnates between the $29K and $30K levels, sentiment about the leading cryptocurrency has nosedived to levels last seen during the onset of the Covid-19 pandemic in March 2020.
Despite Interest Rate Hike, Bitcoin is at an Inflection Point - Bloomberg Strategist
As Bitcoin continues ranging between the $29K and $30K zone, the leading cryptocurrency’s inflection point is at $30,000, according to Mike McGlone, the senior commodity strategist at Bloomberg Intelligence.
Bitcoin Gains Momentum Based on Positive CPI Numbers
After slipping to lows of $15.5K amid FTX’s liquidity crunch, Bitcoin gained momentum based on positive consumer price index (CPI) numbers released by the U.S. Bureau of Labor Statistics.
Bitcoin Dominance Soars to 56%, Long-Term Holders Remain Resolute
Bitcoin’s market dominance reaches 56% as long-term holders continue to accumulate, despite recent market volatility. Short-term holders face significant losses.
Bitcoin's Balance on Exchanges Hits a 4-Year Low Amid Traders Becoming Overly Optimistic
As Bitcoin (BTC) continues hovering around the $20K area, the balance on exchanges is shrinking.
Bitcoin (BTC) Market Faces Renewed Sell Pressure Amid Fed Rate Speculations
Bitcoin's market dynamics shift as anticipation of a Fed rate cut influences investor behavior. Explore insights into spot, futures, and options markets with Glassnode's latest analysis.
Bitcoin (BTC) Market Faces Cooling Momentum Amidst Rising Unrealized Gains
Bitcoin's market shows cooling momentum as speculative interest fades, with rising unrealized gains increasing sensitivity to potential risks, according to Glassnode's latest report.
Bitcoin’s Long-Term Fundamentals Remain Strong
Despite the bearish momentum in the Bitcoin market, long-term fundamentals are in the green because coins are moving from weak hands to strong ones.
Non-Zero Bitcoin Addresses Hit ATH as Illiquid Supply Sees Major Growth
More participants continue to join the Bitcoin (BTC) network despite continued consolidation.
Bitcoin (BTC) Faces Market Shift as Spot Momentum Eases
Bitcoin trades above short-term holder cost basis, but market momentum softens. Derivatives show caution, and on-chain activity declines, signaling potential transition.
Bitcoin (BTC) Market Analysis: Fragile Stabilization Amid Cautious Sentiment
Bitcoin's price hovers around short-term holder cost basis, displaying fragile stabilization as cautious sentiment prevails in the market, according to Glassnode's latest analysis.
Bitcoin (BTC) Market Update: Stability Amidst Volatility in Week 30
Bitcoin hovers around $117k with robust capital flows, while profitability metrics cool. Despite aggressive selling, market conditions remain balanced, reflecting cautious optimism.
Bitcoin Faces Continued Pressure Amid Weak Liquidity Inflows
Bitcoin remains vulnerable to downward pressure due to tight liquidity conditions and weak investor sentiment, with ETF outflows and cautious market behavior persisting.
With Upcoming Interest Rate Hike from Fed, Is BTC's Current Rally Short-Lived?
Bitcoin has regained momentum and reclaimed the $23K level, but this begs the question if this uptick is short-lived, given that the upcoming interest rate hike from the Fed.
Crowd Sentiment Towards Bitcoin Hit Historic Lows as BTC Addresses in Profit Reach a Monthly Low
On-chain metrics provider Santiment acknowledged that FUD (fear, doubt, and uncertainty) has made crowd sentiment towards BTC sink to historic lows.
Bitcoin Vector Report Highlights Market Trends and Insights
Glassnode releases its latest Bitcoin Vector report, offering insights into market trends and on-chain analysis. The report is a collaboration between Swissblock and Willy Woo.
Bitcoin Hodlers are Unwilling to Spend at Lower Prices as Most Coins Remain Untouched
Despite the bearish momentum experienced in the Bitcoin (BTC) market, long-term hodlers remain steadfast because they are not selling.
Entities Holding Less Than 100 BTC are the Best Survivors amid LUNA's Liquidation
In a bid to salvage the LUNA and UST crash, the Luna Foundation Guard (LFG) liquidated 80,081 BTC, but these coins were received with open arms by entities holding less than 10,000 Bitcoins.
Glassnode and Willy Woo Release Bitcoin Vector Report Focusing on Market Analysis
Glassnode's Bitcoin Vector #25, created with Willy Woo, delivers in-depth market analysis using Swissblock's framework and on-chain analytics to assess sentiment, structure, and liquidity.
Is Bitcoin Edging Closer to the End of a Bear Market?
The back and forth experienced in the Bitcoin (BTC) market might soon come to an end based on various indicators, according to a crypto analyst under the pseudonym PlanB.
Bitcoin Funding Hits a Monthly Low as Consolidation Continues
The consolidating Bitcoin market has been partly prompted by funding rates hitting a monthly low.
Is Bitcoin Getting Ready for a Breakout?
There seems to be light at the end of the tunnel for a breakout in the Bitcoin market because the multi-month downtrend witnessed on the momentum indicator has broken out to the upside.
Bitcoin Slips to 4-Month Low as Kazakhstan Internet Shutdown Hampers Mining
Bitcoin dropped below $42K for the first time since September 2021 as the market remains in the red.
Is Bitcoin on the Verge of Forming the Bottom?
The Long-Term Holder NUPL (LTH-NUPL) indicator shows Bitcoin’s bottom is forming since it is at the same level as the past two significant pullbacks of 2021.
Bitcoin’s Bear Trap Might be Over as Price Jumps to New ATH of $66,952
Market analyst Lark Davis Believed that the bear trap experienced in the BTC market might be over, along with reaching a new ATH of the Bitcoin's price.
Bitcoin Investment Requires a Long-Term Strategy, Says Former Wall Street Stockbroker
Based on the back and forth experienced in the Bitcoin market, a long-term approach is suggested for investment in the leading cryptocurrency, according to Jordan Belfort, a former Wall Street stockbroker.
Bitcoin’s Long Liquidation Dominance Hits an 8-Month High at 69%
Having traded below $45,000 for seven days now, Bitcoin (BTC) has been in the red based on significant liquidation.
Bitcoin Slips to $35.7K as Daily Active Addresses Hit a 5-Month High
Bitcoin (BTC) entered the weekend in the red after dropping to the $35.7K level based on a high number of daily active addresses, according to market insight provider Santiment.
Bitcoin $30K Resilience Amid Crypto Meltdown and Stablecoin Crash Shows its Brilliant Architecture - PayBito CEO
Despite Bitcoin’s slashed valuation in the past few months, the leading cryptocurrency has steadily held the $30,000 level because of its unique decentralized proof-of-work (PoW) mechanism, according to Raj Chowdhury, the CEO of crypto trading platform PayBito
Bitcoin’s Dominance Skyrockets as Market Capitalization Tops $1 Trillion
On-chain metrics provider Santiment believes Bitcoin’s dominance and price have been driven by a surge in token circulation.
Bitcoin Breaches the $43K Level, despite FUD Hits 16-Month High
After plummeting below the psychological price of $40K based on the ongoing Russia’s invasion of Ukraine, Bitcoin (BTC) is back to winning ways after breaching the $43K and briefly topping $44,000.
Bitcoin Endured Two Major Capitulation Events in H1, Glassnode Shows
Bitcoin has experienced significant ups and downs in the first half year due to various uncertainties and events like the LUNA collapse.
The Downturn in Bitcoin Signals Long Endurance before Reaching new ATH, Analyst Says
Veteran analyst Peter Brandt believes that new all-time highs (ATHs) of Bitcoin take quite some time before being realized. The market should expect long-endurance to be remained.
Short-Term Holders Dominate Primary Driver for Bitcoin's Liquidation amid Ukraine Crisis
Analysis by IntoTheBlock shows that short-term holders have been the primary catalysts of the present leg down as they continue liquidating their BTC investments.
Bitcoin Enters the Deepest Phase of the Current Bear Cycle as Price Slips to an 18-Month Low
After briefly slipping to the $21K zone, Bitcoin (BTC) continues to trade at levels last seen in December 2020. Glassnode believes BTC is entering the deepest part of the present bear cycle, given that even long-term holders are experiencing losses.
Bitcoin Needs to Flip $38K-$40K Area, Gaining Sustainable Bullish Momentum
The plan of raising the interest rate proposed by the U.S. Federal Reserve has dented Bitcoin’s upward move because the leading cryptocurrency ranges between the $33K and $38K zone.
Is Bitcoin Gearing Up to Exit the Current Bottom?
Since Bitcoin has been trading above the psychological price of $20K, Glassnode has released its weekly on-chain report titled “Hammering Out The Bottom,” scrutinizing the stakes and the risks that may lay on the road ahead.
Is Fed’s Interest Rate Hike the Biggest Impediment to Bitcoin’s Bullish Outlook?
With speculations high that the Federal Reserve (Fed) will increase the interest rate by 75 basis points (bps) on June 15 to tame inflation, this might dent Bitcoin’s bullish outlook as the leading cryptocurrency continues to trade at an 18-month low.
Bitcoin Should Breakthrough $44.5K Level to Create Higher High
Having broken the high resistance level between $38,000 and $40,000, Bitcoin needs to shatter the $44,500 area so that a higher high can be created for a sustained upward momentum.
Crypto Social Circles Welcome Bitcoin for Breaking the Psychological Price of $40K
Breaching the high resistance zone between $38K and $40K has hyped up the crypto community.
Is Bitcoin Experiencing Short-Term Pain Points for Long-Term Gain?
Despite the short-term pain being experienced in the BTC market, long-term holders remain solid in their investments.
Bitcoin Needs to Hold the $43.1K Level to Avoid a Slip back to $38K
Bitcoin ought to hold the $43,100 level to avoid dropping below the psychological price of $40,000.
Bitcoin Hits a 2-Month High as BTC Lightning Network Scales the Heights
After surging past $31,000, a scenario was last seen in March, momentum seems to be ticking in the Bitcoin market.
Bitcoin’s Trading Volume Reaches High Since June as Price Slips Below $18.8K
Selling pressure has emerged on the Bitcoin market, causing the price to drop below $18,800. Furthermore, trading volume hit a three-month high.
Are Bitcoin Miners Earning Minimum Reward as Hash Price Plunged to Historic Lows?
The revenue of Bitcoin miners continues to dwindle, given that the hash price has nosedived to historic lows of $66,500 per Exahash, according to Glassnode.
Is Bitcoin Market Sentiment Shifting from Fear to Capitulation?
As Bitcoin (BTC) continues hovering around the $20K zone, market sentiment might be changing from fear to capitulation.
Bitcoin’s Short-Term Interest Declines by 43% From an ATH Experienced in February
Bitcoin has been stuck to its consolidation period between the $30K and $40K range for more than two months, making short-term interest nosedive to levels not seen since September 2020.
Bitcoin Needs to Reclaim $37.5K before Painting a Bullish Picture
BTC needs to reclaim the previous support level of $37.5K to boost its chances of bullish momentum.
Bitcoins' Circulation and Address Remain Underwhelming
Bitcoin isn't getting a ton of utility to kick off January, as its circulation and active address are remaining underwhelming.o
Bitcoin Hit Lows of $42K, following the Liquidation of $2.2B in 12 Hours
Over the weekend, Bitcoin (BTC) plunged to lows of $42,000 based on massive liquidations. Variant Omicron strain and overleveraged market were attributed to this round of chain liquidations.
Bitcoin Needs to Break $51K Level for an Continuous Upsurge
Market analyst Michael van de Poppe believes Bitcoin should break the $51,000 level if an upward momentum is to continue, failure to which a pullback to the $44-$48K level will be witnessed.
Bitcoin Gains Momentum as Biden Slaps Russia with Sanctions
Bitcoin entered the green zone after U.S. President Joe Biden revealed new sanctions meant to cut off Russia from western finance.
Bitcoin Whale Holdings Hit a 7-Month High, Despite Retail Investors Panicking
The $38K to $40K zone of Bitocin is proving to be a hard nut to crack in the market. Nevertheless, BTC whales have been accumulating heavily in this area.
Bitcoin Faces Major Resistance at 200-Week Moving Average
Bitcoin’s consolidation in the lower $20K level continues as the leading cryptocurrency has lacked significant momentum to breach this zone.
Bitcoin Makes Two Back-to-Back Weekly Closes Above 200-Week MA
Bitcoin has closed above the 200-week moving average (WMA) for two consecutive weeks, according to market analyst Ali Martinez.
Bitcoin Dominance Hits 4-Year Low, Dormant Supply Touches Historic Highs
Bitcoin’s dominance in the crypto scene has nosedived as the leading cryptocurrency continues trading on shaky grounds.
Low-Risk Appetite Continues to Play Out in Bitcoin Market Based on Diminishing Institutional Activity
Institutional activity remains sluggish as Bitcoin hovers around the lower $20K level, depicting a low-risk appetite.
Bitcoin’s Mining Difficulty Jumps by 3.44%, Reaching New ATH at 36.84 Trillion
Bitcoin's mining difficulty has increased by 3.44%. The increase means that more competition is rising.
In-depth Analysis of Bitcoin: Insights from Glassnode and Willy Woo
Glassnode collaborates with Willy Woo to offer a comprehensive Bitcoin report, integrating Swissblock's framework with on-chain analytics focusing on sentiment, structure, and liquidity.
Bitcoin Funding Turns Negative amid 70% of BTC Circulating Supply Being Hodled
BTC funding flipped negative following long liquidations as prices slipped to lows of $42,000.
Bitcoin’s Perpetual Swap Open Interest Slips below $11B for the First Time Since August
The recent drop in the crypto market price made BTC’s perpetual swaps open interest to fall below $11 billion for the first time since August 5.
Bitcoin Transaction Volume Hits a Monthly Low as Consolidation Continues
Bitcoin has found itself in a consolidation state based on low transaction volume.
Bitcoin Needs to Flip $56.5K to Support Level to Retest $60,000, says Market Analyst
Market analyst Michael van de Poppe believes that Bitcoin will have to flip the $56.5K resistance level to support if the cryptocurrency wishes to retest $60,000.
Bitcoin Corrects after Hitting ATH at the $66,900 Level, Holders Remain Unfazed
Holders remain unperturbed about the current correction in the Bitcoin market if history is to repeat itself.
Long-Term Holders Liquidate their Supply as Bitcoin Slips to a 6-Week Low
Long-term holder supply dropped by approximately 76,633 BTC day over day.
Bitcoin's Market Confidence Slips as Retail Sentiment Breaks 30-Day Low
Bitcoin’s retail sentiment breaking a 30-Day low indicates a drop in market confidence.
Bitcoin Experiences Worst Selloff since May as BTC Trades below 200-Day Moving Average
Despite holding above the psychological price of $50K over the Christmas weekend, Bitcoin (BTC) experienced significant liquidation that drove the price downwards.
Bitcoin Needs to Hold $36K for Sustainable Upward Momentum
BTC should go back to the $36K level before flipping it to support more upward momentum, analysts said.
Bitcoin Surges to New ATH of $68,500 with Big Money Emerging as the Largest Catalyst
Bitcoin has scaled to heights not seen in its twelve-year journey by hitting a new all-time high (ATH) of 68,500.
Bitcoin Stands in the Last Resistance Zone, staring at the ATH level of $64,800
Bitcoin has been able to pick up the pieces because it is 11% away from the all-time high (ATH) price of $64,800 set in mid-April.
Bitcoin is Still on Track of Hitting $100K in the Long Term, OKCoin CEO says
Speaking on an interview Wednesday, Hong Fang, the CEO of crypto exchange OKCoin, opined that Bitcoin reaching $100,000 would not be a problem in the long term.
Bitcoin Continues to Circulate in a Semi-Bullish Territory
Bitcoin is still in a semi-bullish area, given that circulation continues to be steady, according to on-chain metrics provider Santiment.
Bitcoin Remains Bullish Based on the Formation of an Ascending Channel
The formation of a parallel channel on the daily chart suggests BTC can still drop to $57,000-$54,000 to then rebound towards $75,000, according to analyst Ali Martinez.
Bitcoin Needs to Hold the $50-52k Area to Avoid Dipping to $40,000, says Crypto Trader
Crypto trader Credible Crypto believes Bitcoin bulls have a task at hand of putting a shield at the $50,000 to $52,000 price level because failure to which a journey towards $40,000 might be unavoidable
Bitcoin Is at an “Inflection Point,” says Soros Fund Management CIO
As Bitcoin’s price consolidation continues, Soros Fund Management CIO Dawn Fitzpatrick believes that the leading cryptocurrency is at an inflection point.
Why Bitcoin Needs to Hold Above the 52K Level
Market analyst Michael van de Poppe believes that it is critical for Bitcoin to hold the $50-52k level, which will avert any more downward momentum.
Bitcoin Needs to Hold Above $55,000 for It to Test New Highs, says Market Analyst
Market analyst and trader Michael van de Poppe has disclosed that BTC needs to hold above the $55K price level if it is to rally higher.
Bitcoin Recovers Its Losses After Early Week Plunge and Manages to Maintain Price above a Crucial Level
Bitcoin has rebounded after a steep plunge experienced earlier this week, which left investors hypothesizing about what lies ahead of the leading crypto asset.
Bitcoin Tops $40,000 for The First Time but Experts Warn of Looming Price Correction
The price of Bitcoin has rallied to a new all-time high over $40,000 on Thursday, January 7. A price correction is likely to happen, and experts explain why.
Bitcoin Hits A New Record High Of Over $37,000 As Wild Price Swing Resumes
Despite wild price swings set in, Bitcoin seems to continue marching higher. The crypto surged to fresh new heights on Wednesday, January 6, hitting above $36,000.
Bitcoin Hits $33,000 For the First Time Ever as FOMO Among Investors Supports the Surge
Bitcoin's recent rally is being boosted by increased demands from both retail and institutional investors who see the digital currency as a hedge against inflation.
Bitcoin Prepares to Revisit $32,000 Support Level Before Retracing the Bull Market
Bitcoin may see a decline in search for a support barrier that may kick-start a rally.
Bitcoin Forms “Ascending Triangle”, Tries to Rebound Above $35,000 Crucial Level
Bitcoin has formed an ascending Triangle thus hinting a bullish trend. The cryptocurrency will need to reclaim the $35,000 level as resistance to avoid bull-ending price action.
Bitcoin Needs to Flip the $47K Area for Support before Witnessing a Surge to $50K
Market analyst Michael van de Poppe believes that Bitcoin needs to flip the $47K area to accomplish its $50K journey.
Bitcoin Price Analysis: Price Consolidation Stirring Rejection at Key Support Level
Bitcoin's latest uptrend is being tested in a move that appears as a temporary consolidation.
Billionaire Bond Manager Jeff Gundlach Says Bitcoin Looks Like A Bubble Waiting to Burst
Jeffrey Gundlach, bond fund manager, said in a recent interview with CNBC that Bitcoin is starting to look like a bubble after it surged above the $23,000 level.
Bitcoin Price at $30,000 Could Mean BTC is Rising too Far too Fast, says Tone Vays
Bitcoin trader Tone Vays has warned that should Bitcoin price hit $30,000 this week, BTC will be “Rising too far too fast Zone” which typically leads to price plunges.
The Value Stored in the Bitcoin Network Stands at an All-Time High
The value stored in the Bitcoin network is at a record high based on the realized price.
Bitcoin Investors are "Buying the Dip" in Anticipation of a Bounce Back to $55K in Six Months, Morning Consult Study Shows
Bitcoin investors are still optimistic because they continue stacking with the expectation that the price will rebound to the $55,223 level in six months, according to a study by data intelligence company Morning Consult.
Bitcoin Spot Exchange Reserves Dropped by 12,500 BTC in the Past 2 Weeks, Suggesting the Dip is Being Bought
Bitcoin Spot Exchange Reserves were down by 12,500 BTC in the past 2 weeks as price fell by 25%.
Token Metrics CEO: Bitcoin Price Increase to $26k likely, $32k Possible, and $40k Outlandish
Bitcoin's market rise today is historic, with the price currently sitting at over $21,770 we are officially in uncharted territory - At what price level will the BTC bulls rest?
Bitcoin’s Social and Trading Volumes Hit a 5-Week High as Address Activity Surge to a 3-Week High
As Bitcoin (BTC) continues testing the $40K waters, its social and trading volumes are going through the roof, as acknowledged by on-chain metrics provider Santiment.
Bitcoin Eyes for a Clear Direction amid the Mist
BTC traders are waiting for the next significant movement in either direction, as acknowledged by on-chain metrics provider Santiment.
Bitcoin’s Average Trader Monthly Swings Back to Sink for the First Time Since July
After recording a 10% daily loss on September 8, BTC traders’ monthly returns slumped.
Total Fees Paid on Bitcoin Network Hit Monthly Low, Hashrate Records Historic Highs
Bitcoin’s friendliness in terms of the low transaction fees paid to use its network continues because it hit a monthly low.
Bitcoin’s Volume Dominates Performance More than Volatility, Cumberland Suggests
Even though some analysts have stipulated that Bitcoin’s volatility is a cause for concern, crypto trading firm Cumberland believes volume is what matters the most.
Mining Valuations in Focus: Bitdeer and Sphere 3D Lead November's Stock Insights
The November valuation analysis of Bitcoin mining stocks reveals significant disparities, with Bitdeer undervalued and Marathon overvalued, while Sphere 3D offers a bargain despite limited growth prospects.
ANKR/CRV/STORJ Price Analysis – March 24,2021
ANKR, CRV, and STORJ are included in the Coinbase Pro list and have increased by 42.57%, 23.73% and 102.00% respectively within the last 24 hours.
The Rise of the Anon: Protecting Innovation
Anonymity is increasingly offering protection to innovators as well as their ideas.
Bitcoin Price Breaks $10,000 Flirting with High Resistance of Supply – Understanding the Stock to Flow Model
Bitcoin has taken off this week, moving to $10,000 and firing up the market in euphoria. With only one week from halving, The Bitcoin price has now deleted all its coronavirus crash losses, up practically 40% since January 1st—and putting it on target to be one of the year's best performing resources.
Bitcoin Bull Run Ahead? Understanding the Factors Driving Bitcoin's Price Growth
Bitcoin breached its key resistance of $7,300 today. Block halving, change in economic supply and an Ichimoku Kumo twist are driving the price forward. In this article, we analyze the price movement, the change in supply dynamics, and how BTC halvings have performed historically.
Bitcoin Price Bull Run Expected to Continue says Bloomberg Intelligence
Bloomberg Intelligence reports that only an "unexpected occurrence" can stop the Bitcoin price bulls from running.
Bitcoin Falls Below $44K, Attributed to the Fed Plans to Raise Interest Rate in March
Attributed to the preliminary raise of the interest rate in March, revealed by the U.S. Fed, Bitcoin's price fell below $44,000 and the lowest trading price was as low as $42,413.
UK Adults Hesitant in Crypto Investments due to Perceived Lack of Security
A quarter of the UK's adults are hesitant in crypto investments due to a perceived lack of security, according to research from TMT Analysis.
C10: An All-Weather Approach to Investing In Cryptocurrencies
The future of cryptocurrencies looks bright as an increasing number of investors are looking for alternative investment opportunities, but many remain hesitant because of the market's extreme volatility.
Explosive growth alongside peace of mind offered by C10 from Invictus
With investor focus shifting towards the next market downturn, investors are increasingly seeking protection against potential future drawdowns. The Invictus Capital Crypto10 Hedged fund (C10) is that protection investors are looking for and holds the answers to many investor concerns. The C10 fund has continued to offer investors unparalleled risk adjusted returns in 2021 with a 119% increase in performance for the first quarter.
MicroStrategy Holds over 129K Bitocins, Data Shows
Data shows MicroStrategy holds over 129,00 Bitcoins (BTC) with a total value of approximately $5.8 billion.
Is Bitcoin Going To Experience Its Biggest Weekly Loss Of 2019 This Week?
For the first time in over six months, Bitcoin’s acceptance has been below key support. Yesterday, the prices plummeted below a four-month low of $7800 and this phase of price volatility lingers.
BTC Price Analysis as Whale Alerts Indicate More Institutions Buying Bitcoin
As Bitcoin soared to a new all-time high of $57,808, over a billion dollars’ worth of BTC has left Coinbase to unknown wallets. What can we expect from the BTC price?
5 Factors Behind Chiliz (CHZ)'s Price Surge
Chiliz (CHZ) is a blockchain-based sports platform that aims to provide blockchain-powered solutions for the sports industry and help fans participate in the token economy.
Digital Asset Investments Surge to $117 Million
Last week, digital asset investment products experienced record inflows and volumes.
i2 Group and Chainalysis Collaborate to Enhance Blockchain Intelligence Solutions
i2 Group partners with Chainalysis to integrate cryptocurrency insights into its intelligence platform, enhancing the ability to track illicit activities using blockchain data.
Worldwide Blockchain Distributed Ledger Market to Hit $20.6B by 2027 - Report
The global blockchain distributed ledger market is expected to grow from $3.5 billion recorded in 2021 to $20.6 billion by 2027, according to a report by Research and Markets.
Ethereum (ETH) Price Analysis - April 9,2021
Ethereum hit a new high of $2,151.63 earlier this week and rallied bullishly after Federal Reserve Chair Jerome Powell's speech on US economic recovery.
Ethereum Classic (ETC) Price Analysis - April 7, 2021
Ethereum Classic (ETC) has experienced a substantial price increase of 55.52% in the past week. Currently, ETC is suffering from strong selling Pressure.
Four Reasons Why Filecoin Increased by 430% Within a Month
Filecoin has risen by 89.74% within 7 days and has increased by over 430% since the beginning of March. What are some factors driving Filecoin's surge?
Blockchain in Manufacturing Market Expected to Hit $17 Billion by 2027
The urge to streamline operations and track assets with unprecedented precision are some of the factors expected to make the blockchain in the global manufacturing market hit $17.047 billion by 2027, according to a report by Research and Markets.
Global Blockchain Technology Market Expected to Hit $19.9 Billion
The global blockchain technology market is anticipated to reach $19.9 billion by 2026 from the current $3.4 billion value, according to market research publisher Global Industry Analysts Inc.
Cardano Scoop: ADA/BTC Flirts with Support as Selling Pressure Increases
Cardano price at 818 satoshis, trading later at -3.67% at 789 satoshis. Around 29.45 million of the volume was generated during the trading session on Monday.
Uniswap Sets New All-Time High Ahead of Coinbase Public Listing
Coinbase’s public debut this week has drawn numerous investors' attention to DeFi tokens and served to push altcoins higher.
Ripple (XRP) Charges Past $1.00 and Becomes the Fourth-Largest Cryptocurrency
Ripple has soared for two consecutive days and surpassed the psychological threshold of $1.00, a level it has not managed to reach since the peak of altcoins in early March 2018.
BNB Price Prediction: Targeting $1,150 by January 2025 Despite Current Consolidation
BNB price prediction shows potential 28% upside to $1,150 within 4-6 weeks, but must hold critical $900 support zone for bullish continuation.
BNB Price Prediction: $1,100 Target by Year-End 2025 After Consolidation Break
BNB price prediction points to $1,100 target within 3-4 weeks as Binance Coin breaks four-year consolidation with bullish momentum indicators confirming upside.
BNB Price Prediction: Targeting $1,100-$1,200 Recovery Within 30 Days
BNB price prediction shows potential 24-40% upside to $1,100-$1,200 range as technical indicators signal oversold bounce from current $886 levels.
BNB Price Prediction: Targeting $1,100-$1,150 by January 2025 as Technical Setup Improves
BNB price prediction shows bullish momentum building toward $1,100-$1,150 targets within 30 days, with key support holding at $900-$920 zone.
BNB Price Prediction: $1,150 Target Within 30 Days as Bulls Eye Critical $920 Breakout
BNB price prediction shows strong bullish momentum building with analysts targeting $1,150 in the coming month. Critical resistance at $920 zone holds the key to upside breakout.
BNB Price Prediction: $1,150 Target Within 30 Days Despite Current $910 Consolidation
BNB price prediction points to $1,150 target by January 2025 as technical indicators show bullish momentum building despite current $910 consolidation phase.
BNB Price Prediction: Target $920-940 by Year-End 2025 Despite Technical Headwinds
BNB price prediction shows upside potential to $920-940 range by December 2025, though bears watch $875 support break for deeper correction to $790 levels.
BNB Price Prediction: Targeting $950-$1,000 Recovery Within 2-4 Weeks Despite Current Weakness
BNB price prediction shows potential 15-20% upside to $950-$1,000 range as technical indicators suggest oversold bounce from current $831 levels.
BNB Price Prediction: Target $1,350-$1,450 by January 2025 Despite Current Oversold Conditions
BNB shows bullish momentum signs with MACD turning positive despite 37% drop from highs. Technical analysis suggests $1,350-$1,450 targets within 30-45 days if key resistance breaks.
BNB Tests Key $875 Support as Crypto Market Faces Thanksgiving Week Consolidation
Binance Coin trades at $883.95, down 1.1% as technical indicators show mixed signals while broader crypto markets digest post-holiday positioning ahead of December catalysts.
BNB Price Prediction: Targeting $950-$1,020 Within 30 Days as Technical Momentum Shifts Bullish
BNB price prediction suggests upside to $1,020 resistance level within a month as MACD histogram turns positive and RSI rebounds from oversold conditions.
BNB Price Prediction: $950-$1,020 Target Within 30 Days as Technical Indicators Signal Recovery
BNB price prediction suggests a bounce to $950-$1,020 range over the next month, supported by bullish MACD momentum and oversold conditions near key support levels.
BNB Breaks Above $890 as Fed Rate Cut Optimism Fuels Risk Asset Rally
Binance Coin climbs to $892.57 (+3.55%) as Federal Reserve rate cut expectations and Asian stock market gains drive renewed appetite for cryptocurrency investments.
BNB Tests Key Support Near $850 as Selling Pressure Mounts Despite Modest Recovery
Binance Coin trades at $863.27 (+1.79%) while testing critical support levels amid broader crypto market volatility and declining momentum indicators.
BNB Price Prediction: Targeting $950-$1,000 Recovery Within 30 Days as Technical Indicators Signal Oversold Bounce
BNB price prediction suggests a 10-17% upside to $950-$1,000 range within 30 days as oversold RSI and strong support confluence create buying opportunity near $860 levels.
BNB Price Prediction: Oversold Bounce to $950 Target Within 2-3 Weeks
BNB price prediction shows potential bounce from oversold RSI levels targeting $950-980 resistance zone, with critical support at $790 determining medium-term direction.
BNB Tests Oversold Territory at $836 as RSI Signals Potential Reversal
Binance Coin trades at $836.72 down 3.6% as technical indicators flash oversold signals with RSI at 29.78, suggesting potential bounce from current levels.
BNB Price Prediction: Recovery to $950-1,000 Expected by December 2025 Despite Current Oversold Conditions
BNB price prediction shows potential 16-22% upside to $950-1,000 target by December 2025 as RSI oversold at 27.64 signals buying opportunity near key support.
BNB Tests Key Support at $872 as Crypto Market Consolidates Below Major Moving Averages
Binance Coin trades at $908.30 down 1.1% as technical indicators signal potential further downside with RSI at 37 and price below all major moving averages except 200-day.
BNB Price Prediction: Targeting $1,150 by December 2025 Despite Current Bearish Momentum
BNB price prediction indicates potential 25% upside to $1,150 within 4 weeks, though bearish MACD signals suggest caution. Key resistance at $1,104 must break.
BNB Price Prediction: $1,050 Target Within 2 Weeks Despite Near-Term Bearish Signals
BNB price prediction shows mixed signals with RSI at 38.40 suggesting oversold conditions. Target $1,050 resistance break could trigger rally to $1,200 range.
BNB Holds Above $930 as Technical Indicators Signal Mixed Momentum Amid Quiet News Cycle
Binance Coin trades at $934.78 with 2.6% daily gains as technical analysis reveals diverging signals between short-term momentum and longer-term trend strength.
BNB Price Prediction: Testing $1,000 Resistance with $1,200 Target by December 2025
Binance Coin faces critical $1,000 level with technical indicators suggesting potential recovery to $1,200 within 4-6 weeks despite current bearish momentum.
BNB Tests $920 Support as Bearish Momentum Builds Amid Crypto Market Weakness
Binance Coin trades at $921.97 down 1.6% as technical indicators turn bearish with MACD divergence and RSI approaching oversold territory below key moving averages.
BNB Price Prediction: Targeting $1,100 by Year-End Despite Current Bearish Momentum
BNB price prediction points to $1,100 target by December 2025 as technical indicators show oversold conditions near $935, with critical support at $880.
BNB Holds Above $930 as Technical Consolidation Continues Amid Quiet News Flow
Binance Coin trades at $938.51 with minimal movement as technical indicators show mixed signals while broader crypto markets await directional catalysts.
BNB Price Prediction: Recovery to $1,050-$1,100 Range by December 2025 as Bearish Momentum Weakens
BNB price prediction points to recovery toward $1,050-$1,100 by December despite current bearish momentum, with key support at $880 and resistance at $1,182.
BNB Price Prediction: $1,100-$1,200 Target by December 2025 Despite Current Correction
BNB price prediction shows potential recovery to $1,100-$1,200 range within 4-6 weeks as oversold conditions create buying opportunity near $880 support level.
BNB Consolidates Below $950 as Bitcoin Weakness Weighs on Crypto Markets
Binance Coin trades at $942.31, down marginally as technical indicators suggest further downside pressure amid broader crypto market uncertainty following recent profit-taking.
BNB Price Prediction: Testing Critical $998 Support Before Rally to $1,150 Target
BNB faces key $998 support test with short-term target of $1,025-$1,050 range. Technical analysis suggests potential breakout to $1,150 if bulls defend current levels.
BNB Tests Lower Bollinger Band as Crypto Market Downturn Continues Following Bitcoin Volatility
Binance Coin trades at $985.99 down 0.8% as the broader crypto selloff persists, with BNB approaching critical support levels amid sustained Bitcoin correlation.
BNB Tests Technical Support Near $1,000 as Crypto Markets Consolidate
Binance Coin trades at $1,002.65, up 0.6% daily, as the token finds support above psychological $1,000 level amid broader crypto market consolidation and neutral momentum indicators.
BNB Price Prediction: Targeting $1,100-$1,200 by December 2025 as Bulls Eye Key Resistance Break
BNB price prediction targets $1,100-$1,200 range within 4-6 weeks if bulls can break critical $1,000 resistance, though bearish MACD signals warrant caution.
BNB Price Prediction: Target $1,100-$1,200 by December 2025 Despite Near-Term Consolidation
BNB price prediction shows potential 11-21% upside to $1,100-$1,200 range within 4-6 weeks, contingent on breaking $1,000 resistance and sustained volume confirmation.
BNB Price Prediction: $750-$1,200 Range Trading Expected Through December 2025
BNB price prediction suggests consolidation between $880-$1,182 near-term, with potential 22% upside to $1,200 if resistance breaks. Technical analysis shows mixed signals.
BNB Tests Lower Bollinger Band at $943 as Bearish Momentum Builds Despite Long-Term Uptrend
Binance Coin trades at $942.86, down 1.25% as technical indicators signal oversold conditions while maintaining position above 200-day moving average support.
BNB Price Prediction: Targeting $1,100-$1,350 Recovery After Current Consolidation Phase
BNB price prediction shows potential for 16-43% upside to $1,100-$1,350 targets as technical indicators suggest oversold conditions may reverse in coming weeks.
BNB Price Prediction: $1,200 Target Within 2 Weeks as Oversold Conditions Signal Reversal
BNB price prediction suggests a bounce to $1,200 within two weeks as RSI oversold conditions and Bollinger Band support create bullish reversal setup from current $998 levels.
BNB Tests Support at $1,066 as Technical Momentum Weakens Despite Recent $1,000+ Breakthrough
Binance Coin retreats 2.1% to $1,066.41 after breaking above $1,000 last week, with technical indicators suggesting consolidation phase as MACD turns bearish amid broader crypto market uncertainty.
BNB Price Prediction: Targeting $1,150-$1,200 Rally Within 2 Weeks Despite Mixed Signals
BNB price prediction points to $1,150-$1,200 targets over the next two weeks, with current technical analysis showing bullish potential above $1,100 support level.
BNB Consolidates Near $1,090 as Technical Indicators Signal Potential Direction Break
Binance Coin trades at $1,089.46 with minimal daily movement as key technical levels converge, setting stage for next major price move in absence of significant catalysts.
BNB Price Prediction: $1,160-$1,180 Target as Technical Breakout Looms in November 2025
BNB price prediction shows potential 6-8% upside to $1,160-$1,180 if key resistance at $1,145 breaks, though bearish MACD signals warrant caution for November 2025.
BNB Tests $1,078 Support as Bitcoin Rally Fails to Lift Exchange Token Despite US Re-Entry Hopes
Binance Coin trades at $1,078 after recovering from mid-week decline, as Bitcoin's surge toward all-time highs and potential US market re-entry provide mixed signals for the exchange token.
BNB Price Prediction: Targeting $1,200-$1,400 Range Within 30 Days Despite Near-Term Consolidation
BNB price prediction models suggest a climb to $1,200-$1,400 over the next month, though technical indicators warn of potential short-term pullback to $1,000 support first.
BNB Price Prediction: Targeting $1,280 Resistance with 15% Upside Potential Through November 2025
BNB price prediction shows bullish momentum toward $1,280 upper Bollinger Band target, with technical analysis suggesting 10-15% upside potential over the next 4 weeks.
BNB Price Prediction: Targeting $1,200-$1,300 Within 30 Days Despite Mixed Signals
BNB price prediction indicates potential upside to $1,200-$1,300 range over the next month, despite current neutral RSI and bearish MACD momentum signals requiring careful positioning.
BNB Price Prediction: $1,150-$1,200 Target Within 4 Weeks Despite Mixed Technical Signals
BNB price prediction shows bullish potential to $1,150-$1,200 range by November 2025, supported by analyst consensus despite current neutral RSI at 47.34.
BNB Consolidates Near $1,070 as Technical Indicators Signal Mixed Momentum Amid Market Uncertainty
Binance Coin trades at $1,069.24 with minimal daily gains as traders assess mixed technical signals and broader crypto market conditions in absence of major catalysts.
BNB Price Prediction: $950-$1,000 Target by November 2025 Despite Bearish Momentum
BNB price prediction shows consolidation near $1,100 with medium-term Binance Coin forecast targeting $950-$1,000 breakout, though current bearish MACD signals caution.
BNB Price Slides 3.4% to $1,078 as Bitcoin Free-Fall Triggers Crypto Market Selloff
Binance Coin drops to $1,078.36 amid broader cryptocurrency market decline, with Bitcoin's trendline breakdown sending ripple effects across major altcoins in heavy trading.
BNB Breaks Above $1,140 as Technical Momentum Builds Despite Quiet News Cycle
Binance Coin trades at $1,142.65 with a solid 4.95% daily gain, testing key resistance levels as technical indicators show mixed signals in a low-volume environment.
BNB Consolidates Above $1,090 as Technical Indicators Flash Mixed Signals Despite Broader Crypto Rally
Binance Coin trades at $1,090.87 with modest 0.7% gains as momentum indicators diverge while BNB maintains position above key support levels in absence of major catalysts.
BNB Tests Critical $1,085 Support as Ecosystem Gains Clash with Technical Weakness
Binance Coin trades at $1,085.70 amid 4.2% daily decline, testing key support despite recent ecosystem expansion catalysts driving earlier price surge to $1,349.
BNB Tests Critical Support After All-Time High Rejection as Regulatory Optimism Meets Technical Correction
Binance Coin retreats to $1,162.35 after hitting fresh highs above $1,200, with SEC settlement tailwinds facing resistance at key technical levels.
BNB Consolidates Near $1,273 as RSI Signals Overbought Conditions
Binance Coin trades at $1,273.02 with -0.72% decline as technical indicators show overbought RSI at 71.2 while maintaining strong momentum above all major moving averages.
BNB Technical Setup Shows Overbought Conditions Despite Bullish Momentum Above Key Moving Averages
Binance Coin trades at $1,281 with RSI hitting 74.1 in overbought territory, yet strong momentum persists above all major moving averages as bulls eye resistance.
Binance Coin Hovers Near Resistance as RSI Signals Overbought Conditions at $1,307
BNB trades at $1,307.81 with -0.52% daily decline as technical indicators show overbought readings while price tests key resistance around $1,350 level.
BNB Price Surges 5% as Technical Breakout Signals Continued Bullish Momentum
Binance Coin climbs to $1,223.90 with strong volume as key resistance levels fall, RSI enters overbought territory signaling potential consolidation ahead.
Binance Coin Tests Overbought Territory at $1,170 as RSI Signals Potential Cooling
Binance Coin trades sideways at $1,170.29 with RSI hitting 70.7, indicating overbought conditions while maintaining strong position above all major moving averages.
BNB Price Surges 6% to $1,095 as Technical Breakout Drives Strong Rally
Binance Coin rallied 5.99% to $1,094.90 in the past 24 hours, breaking above key resistance levels with strong volume as technical indicators signal continued bullish momentum.
BNB Technical Setup: Pullback Tests Key Support Above $1,000 as Moving Averages Signal Uptrend Continuation
Binance Coin trades at $1,010.86 with a 1.27% decline as the token tests critical support levels while maintaining strong positioning above major moving averages.
Binance Coin Consolidates Near All-Time High as Record Contract Holdings Signal Strong Institutional Interest
BNB trades at $1,025 after touching new all-time high of $1,080, with contract holdings reaching record $2.5 billion amid growing institutional participation.
BNB Price Analysis - September 29, 2025
** BNB price surges to $1,009.43 (+3.96% today) as Changpeng Zhao's September 29 release date drives technical breakout above key resistance levels.
BNB Price Drops Below $1,000 After All-Time High - Support Test at $934
BNB trades at $971 after correction from $1,080 ATH. Technical indicators show mixed signals as Binance Coin tests critical support levels.
BNB Price Retreats 4.7% Despite Record $2.5B Contract Holdings Surge
BNB trades at $945.24 after pulling back from recent all-time high, as $2.5 billion in contract holdings signals strong institutional backing despite short-term weakness.
BNB Price Faces Pressure Despite Strong Bullish Trend - Key Support at $849
Binance Coin trades at $989.25 after a 2.67% daily decline, testing critical support levels while maintaining an overall very strong bullish trend structure.
BNB Price Surges Above $1,000 as Bullish Momentum Builds Toward Key Resistance
Binance Coin trades at $1,022.60 with strong bullish signals emerging across multiple timeframes, setting up a potential test of $1,083 resistance.
BNB Price Retreats from $1,080 All-Time High as Technical Indicators Flash Mixed Signals
BNB trades at $1,019.52 (-5.22%) after hitting record $1,080.48, with RSI showing overbought conditions despite strong institutional backing and network upgrades.
BNB Price Surges 7% to Hit 52-Week High as Binance Coin Shows Extreme Overbought Signals
BNB price reaches $1,065.34 (+6.96% today), hitting new 52-week highs despite RSI showing extreme overbought conditions at 81.67 on Binance spot markets.
BNB Price Surges to Near All-Time High as Bulls Target $1,000 Resistance
Binance Coin trades at $995.88, just $0.01 below its 52-week high, with BNB RSI entering overbought territory as momentum indicators flash bullish signals.
BNB Price Surges to New 52-Week High at $994 as Technical Indicators Flash Overbought
Binance Coin (BNB) reaches $994.11, marking a new yearly peak with bullish momentum intact despite overbought RSI conditions signaling potential consolidation ahead.
BNB Price Surges Past $990 as Technical Indicators Flash Overbought Signals
Binance Coin hits 52-week high at $992.81 with 4.05% daily gains, but BNB RSI at 76.42 suggests caution ahead as resistance approaches $1,006.88 level.
BNB Price Surges 2.57% to $952.90 as Technical Indicators Flash Overbought Signals
Binance Coin trades near 52-week highs at $952.90 with BNB RSI hitting 70.32, signaling potential resistance ahead as momentum indicators show mixed signals for traders.
BNB Price Surges Above $925 as Binance Coin Shows Very Strong Bullish Momentum
BNB price climbs to $925 with bullish technical indicators across the board. Binance Coin RSI at 65.92 suggests continued upside potential ahead.
BNB Price Surges to $915 as Binance Coin Shows Strong Bullish Momentum
BNB trades at $915.85 with technical indicators signaling continued strength despite 2.35% daily decline. RSI remains neutral while MACD shows bullish momentum.
BNB Price Breaks Above $930 as Technical Indicators Flash Overbought Warning
Binance Coin trades at $938.94 (+1.16% in 24h) near 52-week highs, but BNB RSI at 71.40 signals potential pullback as bulls test key resistance levels.
BNB Price Surges to $926 Near All-Time High as Technical Indicators Flash Bullish
Binance Coin trades at $926.28 with 2.36% daily gains, approaching its 52-week high amid very strong bullish momentum and overbought RSI conditions.
BNB Price Soars to Near All-Time High as Technical Indicators Flash Strong Bullish Signals
Binance Coin trades at $907.27, just shy of its 52-week high, with RSI at 65.57 and MACD showing bullish momentum as BNB breaks above key resistance levels.
BNB Price Surges Past $900 as Binance Coin Tests Key Resistance Levels
BNB price climbs 2.56% to $902.27, approaching 52-week highs as technical indicators signal continued bullish momentum despite overbought conditions.
BNB Price Surges Above $880 as Binance Coin Shows Very Strong Bullish Momentum
BNB price climbs to $880.72 with 0.53% daily gains as technical indicators signal continued bullish momentum for Binance Coin despite bearish MACD divergence.
BNB Price Surges Above $870 as Technical Indicators Signal Continued Bullish Momentum
Binance Coin trades at $874.10 with +0.94% daily gains, showing strong bullish signals as BNB breaks above key moving averages with RSI in neutral territory.
BNB Price Breaks $872 Resistance Despite 4% Weekly Decline - Key Levels to Watch
BNB price trades at $872.30 (+1.62% daily) after breaking resistance, but weekly decline signals caution as sideways trading expected between $870-$900.
BNB Price Surges Above $860 as Binance Coin Shows Strong Bullish Momentum
Binance Coin trades at $860.35 with 1.13% gains as technical indicators signal continued upward momentum despite bearish MACD divergence.
BNB Price Hovers Near $845 as Technical Indicators Show Mixed Signals
Binance Coin trades at $845.42 with bearish MACD momentum despite maintaining position above key support levels in neutral RSI territory.
BNB Price Falls to $845 as Profit-Taking Hits Binance Coin Despite Technical Strength
Binance Coin trades at $845.30 (-0.62% in 24h) as recent profit-taking overshadows strong long-term bullish indicators, creating mixed signals for BNB traders.
BNB Price Holds Above $850 as Momentum Indicators Signal Mixed Outlook
Binance Coin trades at $854.08 with neutral RSI at 53.73, while technical analysis reveals key resistance at $900 and strong bullish trend intact.
BNB Price Tests $851 Support as Binance Coin Faces Profit-Taking Pressure
Binance Coin trades at $851.26 after a 4% weekly decline, with technical indicators showing mixed signals as traders take profits following recent rally.
BNB Price Analysis: Binance Coin Tests $854 Support After Contract Transfer Pause
BNB price drops to $854.10 amid Binance's temporary contract transfer halt, despite billion-dollar institutional backing from B Strategy treasury initiative.
BNB Price Breaks $860 as $1 Billion Reserve Plan Fuels Bullish Momentum
BNB trades at $860.24 with institutional backing driving momentum despite security concerns. Technical indicators show strong upward trend continues.
BNB Price Breaks $872 Resistance - $1B Reserve Plan Fuels Bullish Momentum
Binance Coin (BNB) trades at $860.29 after breaking key resistance, with $1B reserve plan announcement driving strong bullish sentiment despite security concerns.
BNB Price Tests $855 Support After Correction From $881 High
Binance Coin trades at $854.90 (-1.69%) as profit-taking emerges following recent all-time high, with technical indicators showing mixed signals for short-term direction.
BNB Price Hits New All-Time High at $881 as Technical Indicators Flash Mixed Signals
Binance Coin (BNB) trades at $877.21 after hitting a new ATH of $881, driven by ecosystem growth and ETF speculation while technical analysis shows consolidation patterns.
BNB Price Retreats from $864 All-Time High as Profit-Taking Emerges
Binance Coin trades at $831 after hitting a record $864 high, showing healthy consolidation above key support levels with bullish momentum intact.
BNB Price Surges to New All-Time High at $864 as Binance Coin Shows Very Strong Bullish Momentum
BNB price hits record $864 high before pulling back to $854, with technical indicators showing continued bullish momentum despite brief dip below $800 support.
BNB Price Holds Above $830 as Binance Coin Shows Strong Bullish Momentum
BNB trades at $831.67 with technical indicators signaling continued upward momentum despite 1.55% daily decline, RSI at 63.64 suggests room for further gains.
BNB Price Surges Above $847 Following $2 Billion MGX Investment in Binance
Binance Coin trades at $847.61 with strong bullish momentum after MGX's historic $2B investment in Binance drives 15% gains despite technical overbought conditions.
BNB Price Soars Above $830 as Binance Coin Shows Very Strong Bullish Signals
Binance Coin (BNB) trades at $834.07 with 3.31% daily gains, technical indicators flashing bullish signals as price approaches key resistance at $861.
BNB Price Recovers Above $800 Despite Recent Dip - Technical Analysis Shows Mixed Signals
Binance Coin trades at $808.61 after briefly falling below $800, showing -1.59% daily decline amid conflicting bullish trend signals and bearish momentum indicators.
BNB Price Holds Above $817 as Bullish Momentum Builds Despite Market Volatility
Binance Coin trades at $817.61, up 0.94% in 24h, showing resilience above key support levels while technical indicators signal continued bullish momentum.
BNB Price Surges Above $800 as Binance Coin Technical Analysis Shows Strong Bullish Momentum
BNB price trades at $808.11 (+0.47% daily) with technical indicators flashing bullish signals as Binance launches new staking program and BNB Chain dominates network activity.
** BNB Price Surges Above $797 as $1.2 Billion Binance Inflow Signals Strong Momentum
** Binance Coin trades at $797.28 (+1.54% daily) following record $1.2B exchange inflow and new staking program launch, with technical indicators showing very strong bullish trend.
BNB Price Surges 2.6% as Binance Staking Program Offsets SEC Concerns
Binance Coin trades at $786.43 with bullish technicals intact despite regulatory headwinds from renewed SEC scrutiny of Binance.US compliance procedures.
BNB Price Surges Above $770 as Technical Indicators Flash Mixed Signals
Binance Coin trades at $770.05 with 2.74% daily gains, but MACD divergence suggests potential pullback despite overall bullish trend momentum.
BNB Price Retreats to $749 Despite Recent All-Time High - Key Support Test Ahead
Binance Coin trades at $749.93 (-2.13% today) after hitting ATH of $858. Technical indicators show mixed signals as BNB tests crucial support levels.
BNB Price Retreats to $752 After Record $858 High - Technical Signals Mixed
Binance Coin trades at $752.70 after hitting all-time high of $858, with BNB RSI neutral at 51.37 but MACD showing bearish divergence amid regulatory tailwinds.
BNB Price Retreats to $743 as Technical Indicators Flash Mixed Signals
Binance Coin drops 3% to $743.82 amid bearish MACD momentum, but maintains bullish long-term trend above key moving averages.
BNB Price Retreats to $767 Despite Record-Breaking Rally Above $850
Binance Coin trades at $767.17 (-1.49%) after hitting new ATH of $852, with technical indicators showing mixed signals as bulls target $2K range.
BNB Price Retreats to $800 After Testing All-Time High of $858 - Key Levels to Watch
Binance Coin (BNB) trades at $800.71 after a 3.26% pullback from its fresh all-time high, as traders assess support levels ahead of today's token burn event.
BNB Price Hits New All-Time High at $831 as Institutional Adoption Fuels Rally
BNB price surges to $831.05 with institutional adoption driving momentum, but overbought RSI signals caution for traders entering at current levels.
BNB Price Surges to $797.89 as Technical Indicators Flash Overbought Signals
BNB trades at $797.89 (+2.04% in 24h) hitting new 52-week highs while RSI reaches extreme overbought territory at 80.86, signaling potential pullback risks ahead.
BNB Hits New All-Time High at $788 as Institutional Adoption Drives Massive Rally
Binance Coin (BNB) surged to a record $788 this week, trading at $783.58 with strong bullish momentum driven by institutional adoption and $1B token burn program.
BNB Price Retreats to $766 After Record $788 High as Bulls Face Resistance Test
Binance Coin (BNB) trades at $766.30 (-1.97%) following its historic $788 peak, with technical indicators showing overbought conditions despite strong institutional backing.
BNB Price Retreats to $763 After Record $788 High - Technical Analysis Shows Overbought Conditions
Binance Coin trades at $763.73 (-2.30%) after hitting ATH of $788, with BNB RSI at 72.21 signaling potential pullback despite strong bullish momentum from recent upgrades.
BNB Soars to New All-Time High of $799 as Bulls Target $1,000 Milestone
Binance Coin (BNB) trades at $799.01 (+5.82%) after hitting record $788 high, with technical indicators showing extreme overbought conditions but bullish momentum intact.
BNB Price Soars to $758.90 as Binance Coin Hits Overbought Territory
BNB trades at $758.90 near 52-week highs with RSI at 83.09 signaling overbought conditions. Recent network upgrades and token burns fuel bullish momentum despite risks.
BNB Price Surges to $749 as Bulls Eye $2K Target Amid Technical Breakout
Binance Coin trades at $749.71 (+2.27%) with BNB RSI hitting 77.61 in overbought territory as institutional adoption and network upgrades fuel bullish momentum toward potential $2,000 range.
BNB Price Surges to $733 After $1B Token Burn and Major Infrastructure Upgrades - July 2025 Analysis
BNB rallies following Binance's massive $1B token burn and BNB Chain's infrastructure upgrades, despite BigONE security breach. Technical indicators show strong bullish momentum.
BNB Surges Past $720: Maxwell Upgrade and Token Burns Drive Bullish Momentum in July 2025
Binance Coin breaks $720 resistance with Maxwell upgrade doubling throughput, quarterly token burn removing 1.59M BNB, and zero-fee event extending adoption through July 31.
Binance Coin (BNB) Surges Past $720: Recent Developments, Technical Insights, and Future Outlook
Binance Coin (BNB) recently surpassed $720, fueled by bullish momentum, token burns, network upgrades, and institutional adoption. Discover its current market trends, technical analysis, and future...
Binance Coin (BNB) Surges Past $720 Amid Bullish Momentum and Key Upgrades
Binance Coin (BNB) crossed $720, fueled by major network upgrades, token burns, and strategic partnerships. Explore its bullish momentum, technical analysis, and price outlook.
Binance Coin (BNB) Hits $690 After $1 Billion Token Burn: What’s Next?
Binance Coin (BNB) trades at $690 following a $1 billion token burn and bullish technical indicators. Learn about recent developments, trading strategies, and future price outlook.
Binance Coin (BNB) Trends Strong Amid Bullish Momentum – Price Analysis and Outlook for July 2025
Binance Coin (BNB) shows strong bullish momentum despite a recent 2.43% dip. With key resistance at $707.54 and support at $639.16, traders should watch for breakout signals.
Binance Coin (BNB) Surpasses $700 Amid Institutional Adoption and Positive Regulatory Momentum
Binance Coin (BNB) breaks past $700, driven by institutional adoption, technical upgrades, and favorable regulatory developments. Explore key market trends and price outlook.
Binance Coin (BNB) Surges Past $700: Recent Developments and Technical Insights
BNB's price breaks $700 amid bullish momentum driven by institutional adoption, technical upgrades, and strategic partnerships. Learn how recent events support its growth.
BNB Faces Potential Downturn Amid Bearish Double Top Pattern
BNB confirms a bearish double top pattern, raising concerns about potential price downturn despite recent major exchange listings.
Mastering Market Volatility: An Insight into Bollinger Bands
Discover how Bollinger Bands can help traders navigate market volatility, identify potential reversals, and make informed trading decisions using Bitfinex's Chart Decoder Series.
Bonk (BONK) Faces Price Pressure Amid Declining Volume
Bonk's price struggles as trading volume declines, signaling potential weakness. The cryptocurrency may retest support at $0.00001054, according to CoinMarketCap.
Bitcoin Consolidates Near $109K as Derivatives Market Eyes $10T Cap Future
Bitcoin traded at $109,402 on September 28, 2025 3 (https://changelly.com/blog/bitcoin-price-prediction/) 5 (https://www.coinbase.com/price/bitcoin) 6 (https...
BTC Price Prediction: Bitcoin Eyes $100,000 Test by Year-End Despite Current Weakness
Bitcoin technical analysis suggests potential rally to $100K by December 31st, with key resistance at $94,589 and critical support at $83,823 shaping near-term direction.
BTC Price Prediction: Bitcoin Eyes $100,000 Target by Year-End Despite Current Consolidation
BTC price prediction suggests consolidation around $90K before potential rally to $100K+ by year-end, with critical support at $87K determining next major move.
BTC Price Prediction: Bitcoin Eyes $120,000 Target as Technical Momentum Builds - December 2025 Forecast
Bitcoin technical analysis suggests potential rally to $120,000 by year-end, with MACD bullish momentum and critical $96K level holding as key support for the next leg up.
BTC Price Prediction: Bitcoin Eyes $125,000 Rally by Christmas Despite Current $90K Consolidation
BTC price prediction suggests potential 38% surge to $125,000 by year-end, though critical $96K-$106K range must hold to avoid $80K downside risk.
BTC Price Prediction: Bitcoin Eyes $94,150 Breakout Before Testing $77,000-$80,400 Support Zone
Bitcoin targets $94,150 resistance for potential rally to $100,000, but bearish December patterns could push BTC toward $77,000-$80,400 support within 2-4 weeks.
BTC Price Prediction: Bitcoin Targeting $96,000-$98,000 by Year-End 2025
Bitcoin technical analysis suggests a recovery toward $96,000-$98,000 in the next 2-4 weeks, with critical support holding at $80,600 and bullish MACD momentum building.
BTC Price Prediction: Bitcoin Eyes $110,000 by January 2026 Despite Current Consolidation
Bitcoin forecast shows potential 19% upside to $110,000 within 6-8 weeks as technical indicators suggest bullish momentum building despite recent pullback to $92,499.
BTC Price Prediction: Bitcoin Targets $98,000-$102,000 by Year-End 2025 Amid Mixed Technical Signals
Bitcoin technical analysis suggests BTC could reach $98,000-$102,000 by December 31, 2025, with immediate resistance at $96,846 and critical support at $80,600.
BTC Price Prediction: Bitcoin Eyes $95,000-$100,000 Target After $86,000 Support Test
Bitcoin shows bullish momentum with MACD histogram positive at 1001. Analysts target $95K-$100K if $86K support holds, with potential $83K retest before rally.
BTC Price Prediction: Bitcoin Targets $91,000-$94,000 Recovery Within 2 Weeks Despite Current Weakness
Bitcoin forecast shows potential recovery to $91,000-$94,000 range despite trading below key averages. BTC price target depends on breaking $90,000 resistance level.
BTC Price Prediction: Bitcoin Eyes $80,400 Retest Before Potential Rally to $97,100 in December 2025
Bitcoin technical analysis suggests potential decline to $80,400 support before bullish reversal targeting $97,100 resistance within 2-4 weeks based on MACD momentum signals.
BTC Price Retreats to $90,737 as Bearish Sentiment Grows Amid Year-End Positioning
Bitcoin trading at $90,737.62 down 0.8% as probability of ending year below $90,000 rises to 50%, while Singapore Exchange adds institutional futures trading support.
BTC Price Prediction: Bitcoin Targets $108K by December Amid Technical Recovery Signals
Bitcoin technical analysis suggests recovery to $108,000 by December 2025, with immediate resistance at $95,000. MACD shows bullish momentum despite RSI neutrality.
BTC Price Prediction: Bitcoin Eyes $95,000 Rebound After Testing $87,500 Support Through December 2025
BTC price prediction shows potential bounce to $95,000 within 2 weeks as technical indicators suggest oversold conditions, with critical support at $87,500 and resistance at $94,000.
Bitcoin Rebounds 4.5% to $91,473 as Bulls Eye Key Moving Average Resistance
BTC price climbs to $91,473.75 with 4.5% daily gains as technical indicators show mixed signals while traders watch critical resistance levels ahead.
Bitcoin Tests Support at $87K as Thanksgiving Week Trading Thins Out
Bitcoin trades flat at $87,025 during holiday-shortened week, testing key technical support levels as traders position for December volatility ahead.
BTC Price Prediction: Bitcoin Eyes $95,000 Recovery Before Year-End Amid Technical Reset
Bitcoin forecast shows potential recovery to $95,000 by December as oversold RSI and key support at $86,000 create buying opportunity for BTC price prediction.
BTC Price Prediction: Sharp Rebound to $95,000-$100,000 by December 2025
Bitcoin's oversold RSI at 22.49 and proximity to Bollinger Band support suggest a potential sharp rebound toward $95,000-$100,000 within 4-6 weeks despite near-term risks.
Bitcoin Tests Critical $80K Support as Institutional Deleveraging Pressures BTC Below Key Moving Averages
Bitcoin trades at $84,722.97, down 2.2% as institutional deleveraging continues to pressure BTC below major moving averages, testing the crucial $80,600 support zone established during this week...
BTC Price Prediction: Bitcoin Eyes $95,000 Recovery by December 2025 After Oversold Bounce
Bitcoin's RSI at 22.39 signals oversold conditions, targeting $95,000 recovery within 3-4 weeks as technical indicators suggest potential reversal from current $84,171 levels.
Bitcoin Rallies 2.9% as US Government Shutdown Resolution Sparks Risk-On Trading
Bitcoin climbs to $92,670.71 following the end of the US government shutdown, though BTC price remains below key moving averages amid mixed technical signals.
BTC Price Prediction: Bitcoin Eyes $96,900-$103,000 Rebound After Testing Critical $90,000 Support
Bitcoin's oversold RSI at 29.36 signals potential bounce toward $96,900-$103,000 range as BTC holds above crucial $90,000 support level through November 2025.
BTC Price Prediction: Bitcoin Eyes $104,000 Target Despite Current Oversold Conditions - Technical Recovery Expected by December 2025
BTC price prediction suggests recovery to $104,000 within 4-6 weeks as oversold RSI at 28.63 indicates potential bounce from current $91,061 levels.
Bitcoin Drops Below $90K as Risk-Off Sentiment Grips Markets Amid Rate Cut Uncertainty
BTC price trading at $93,266.00 after falling below $90,000 milestone for first time in seven months as investors turn cautious on Federal Reserve policy outlook.
BTC Price Prediction: Bitcoin Eyes $94,000 Recovery Before December Rally to $131,000
Bitcoin technical analysis suggests oversold conditions could trigger bounce to $94,000 within days, setting stage for medium-term rally to $131,227 by December.
Bitcoin Tests $93K Support Level Amid Bearish Technical Signals as RSI Falls to 33
BTC price at $95,378.44 faces technical pressure with RSI at oversold levels and all major moving averages trending bearish in absence of major market catalysts.
BTC Price Prediction: Bitcoin Eyes $105,000 Recovery by December 2025 Despite Current Weakness
Bitcoin forecast shows potential recovery to $105,000-$115,000 range by December 2025, but must hold critical $93,000 support level amid bearish momentum signals.
Bitcoin Tests $95K Support as Bears Push BTC Below Key Moving Averages
Bitcoin trades at $95,455.70 after a 0.7% decline, testing critical support levels as technical indicators signal continued bearish pressure in the absence of major catalysts.
BTC Price Prediction: Bitcoin Eyes $125,000 Target by December 2025 Despite Short-Term Correction Risk
Bitcoin technical analysis suggests potential correction to $94,000 before rallying toward $125,000-$134,000 range by year-end, with RSI oversold presenting buying opportunity.
BTC Price Prediction: Bitcoin Eyes $138,000 Rally Despite Current $96K Correction
Bitcoin faces critical test at $95,933 support as technical indicators point to potential $138,000 target by November 17, despite current bearish momentum showing -22.66% from highs.
Bitcoin ETF Outflows Drive BTC Price to Test Critical $100K Support Level
Bitcoin trades at $100,758.70 down 0.8% as $1.2B weekly ETF outflows pressure BTC price below key psychological support amid government shutdown resolution hopes.
BTC Price Prediction: Bitcoin Eyes $138,000 Rally as Technical Setup Points to 33% Surge by November 17, 2025
Bitcoin technical analysis suggests potential breakout to $138,183 short-term target, with analyst consensus supporting bullish BTC price prediction through year-end.
Bitcoin Tests $105K as Technical Momentum Shifts Bearish Despite Recent Gains
Bitcoin trades at $105,501.17, up 1.66% daily, but bearish MACD signals and position below key moving averages suggest potential consolidation ahead for BTC price action.
Bitcoin Rebounds Above $104K as Institutional Interest Resumes Despite Recent ETF Outflows
Bitcoin trades at $104,635.20, up 2.8% as bulls defend the psychological $100K level following this week's ETF-driven selloff and Federal Reserve uncertainty.
BTC Price Prediction: Bitcoin Eyes $115K Target Within 30 Days Despite Current Pullback
BTC price prediction suggests a recovery to $115,000 within 30 days as Bitcoin finds support near $99K. Technical analysis reveals oversold conditions setting up for reversal.
Bitcoin Tests Critical Support at $101K as Technical Indicators Signal Oversold Conditions
Bitcoin trades at $101,891.11 after a 1.8% daily decline, approaching key support levels as RSI hits 33.25 and momentum indicators suggest potential reversal zone.
Bitcoin Consolidates Near $110K as Technical Indicators Signal Neutral Momentum
BTC price holds steady at $109,673.76 down 0.3% as traders assess mixed technical signals while awaiting fresh catalysts to drive direction from current consolidation zone.
Bitcoin Consolidates Above $110K as Bearish MACD Signals Battle Bullish Histogram Momentum
BTC price holds steady at $110,175.53 despite mixed technical signals, with traders watching for directional clarity as momentum indicators diverge near psychological support.
Bitcoin Holds Above $109K as BlackRock ETF Drives $26.9B Inflows While Fed Rate Cut Looms
Bitcoin trades at $109,397.99, up 1.9% as BlackRock's IBIT leads record $26.9B BTC ETF inflows in 2025, with Federal Reserve poised to cut rates to 3.75-4.00% despite government shutdown.
Bitcoin Tests Critical $108K Level as Technical Indicators Signal Potential Reversal Setup
BTC price holds $108,564.39 amid mixed technical signals, with RSI at 41.23 suggesting oversold conditions while MACD remains bearish in absence of major catalysts.
Bitcoin Tests Support Near $108K as Technical Indicators Signal Potential Reversal Zone
BTC price consolidates at $108,474 after 2% daily decline, approaching 200-day moving average confluence that could determine next directional move for Bitcoin markets.
Bitcoin Climbs 4% to $111,149 as Institutional Interest Offsets Trade War Concerns
Bitcoin recovers to $111,149 with 4% daily gains as positive institutional sentiment from earlier this week continues to provide support despite ongoing US-China trade tensions affecting broader...
BTC Price Rebounds to $107K Despite October 17 Crash Below $100K Support
Bitcoin price recovers to $107,068.94 (+0.55%) after sharp decline below $100K earlier this week, with institutional ETF inflows providing support amid regulatory uncertainty.
BTC Tests Critical $107K Support as Lower Bollinger Band Pressure Intensifies Amid Mixed Market Signals
Bitcoin trades at $107,291.23, down 1.14% as BTC price tests lower Bollinger Band support while institutional inflows from BlackRock provide underlying strength.
Bitcoin Tests Critical $111K Support as RSI Hits Neutral Zone Amid Profit-Taking Pressure
Bitcoin trades at $111,005.84, down 1.6% as traders continue profit-taking following last week's 7.29% decline, with technical indicators signaling potential oversold bounce.
Bitcoin Consolidates Around $121K as Technical Indicators Signal Neutral Momentum
Bitcoin trades at $121,333 down 0.74% in 24 hours, holding above key moving averages while RSI suggests sideways action could continue near critical resistance levels.
BTC Consolidates Above 121K as Bulls Test Key Resistance Levels
Bitcoin trades at $121,943 with modest 0.42% daily gains as technical indicators suggest potential breakout above critical resistance zone near $126,200.
BTC Technical Setup Shows Mixed Signals as Price Holds Above Key Moving Averages
Bitcoin trades at $122,655 with bearish momentum despite strong position above all major moving averages, testing critical support levels near $120,574
Bitcoin Tests Key Resistance at $124,682 as RSI Signals Overbought Conditions
Bitcoin trades at $124,682 with a 1.28% daily gain, approaching critical resistance near $125,708 while RSI readings of 72.8 suggest overbought momentum may pause.
BTC Tests Overbought Territory at $123,810 as RSI Signals Caution Above Key Moving Averages
Bitcoin trades at $123,810, up 1.26% in 24 hours, but RSI at 71.5 suggests overbought conditions while price holds 17.2% above 200-day moving average in bullish trend.
BTC Tests $120K Resistance as Technical Indicators Signal Continued Bullish Momentum
Bitcoin trades at $119,968 with 1.25% daily gains as the cryptocurrency approaches key resistance at $121,022 amid strengthening technical indicators.
Bitcoin Holds Above $114K as SEC ETF Reform Drives Market Optimism
Bitcoin trades at $114,568 with modest 0.6% daily gains as streamlined SEC approval process for crypto ETFs fuels institutional interest despite Czech scandal concerns.
BTC Technical Breakdown: Major Support Test Looms as Bitcoin Battles $112K Resistance
Bitcoin trades at $111,800 after recovering from September's largest liquidation event. Technical indicators suggest critical support levels face pressure ahead.
BTC Recovers Above $113,800 After Czech Government Scandal Triggers Sharp Selloff to $111,676
Bitcoin rebounds to $113,838 following a dramatic decline to $111,676 amid Czech government regulatory concerns, with institutional buying from Strive and Metaplanet providing support.
** BTC Analysis: Bitcoin Consolidates Above $113K as Technical Indicators Signal Neutral Momentum
** Bitcoin trades at $113,939 with modest 2.06% gains, positioning above key moving averages while technical indicators suggest consolidation phase ahead.
** BTC Price Watch: Corporate Accumulation Drives Recovery Amid Regulatory Headwinds
** Bitcoin trades at $114,027 following corporate acquisitions totaling over 16,000 BTC, offsetting Czech regulatory scandal concerns.
Bitcoin Market Alert: BTC Price Consolidates Near $110K as Technical Indicators Flash Mixed Signals
Bitcoin trades at $110,209.85 (+0.78%) with BTC RSI at 40.64 suggesting potential oversold bounce while MACD shows persistent bearish momentum divergence.
BTC Traders Watch: Bitcoin Tests Lower Band Support at $109,975 Amid Czech Government Scandal
Bitcoin trades at $109,975 with 0.54% daily gains despite regulatory headwinds. BTC RSI at 39.73 signals potential oversold bounce near Bollinger Band support.
Bitcoin Slides to $109,356 as BTC RSI Signals Potential Oversold Bounce
Bitcoin trades at $109,356 (-0.27%) near Bollinger Band support as technical indicators show mixed signals with RSI at 37.66 suggesting potential relief rally ahead.
Bitcoin Price Drops 2% to $109,534 as Czech Regulatory Scandal Weighs on BTC Sentiment
BTC trades at $109,534 after a 2.02% decline, with Bitcoin technical analysis showing oversold conditions as regulatory concerns emerge from Czech Republic.
Bitcoin (BTC) Tests Lower Bollinger Band as Price Slips to $111,517 Amid Consolidation
Bitcoin trades at $111,517 (-1.03% daily) near Bollinger Band support as technical indicators signal neutral momentum despite maintaining bullish long-term trend.
Bitcoin Hovers Near $113K as BTC RSI Shows Neutral Zone Amid Fed Rate Cut Impact
Bitcoin trades at $112,994 with mixed signals as Federal Reserve's rate cut boosts sentiment while technical indicators suggest consolidation phase ahead.
Bitcoin Faces $109K Support Test as BTC RSI Signals Potential Reversal
Bitcoin trades at $112,172 with technical indicators showing mixed signals as key support levels come into focus amid September's historic gains.
Bitcoin Price Drops 2.4% to $112,958 as BTC Tests Critical Support Levels
Bitcoin trades at $112,958 after a 2.4% decline, with BTC RSI showing neutral conditions while key support at $109,329 comes into focus for traders.
Bitcoin Holds Above $115K Despite Minor Correction - BTC Bulls Eye Next Resistance
BTC price trades at $115,522 (-0.08% in 24h) while technical indicators show mixed signals. Bitcoin's RSI remains neutral as traders watch key resistance levels.
Bitcoin (BTC) Defies September Curse with $115K Price Action - Best Month in 13 Years
BTC trades at $115,662 after surging 7.39% this September, breaking its worst-performing month trend with strongest gains since 2012.
Bitcoin Price Surges Above $116K as Whale Accumulation Drives BTC Rally Despite Czech Regulatory Scandal
BTC price hits $116,917 amid massive whale buying spree, but Czech Justice Minister resignation over Bitcoin donation scandal creates regulatory uncertainty for traders.
Bitcoin Soars Past $117K as BTC Price Defies 'Rektember' Trend
BTC trades at $117,198 (+0.79%), hitting 2-year highs as September delivers 8% gains - Bitcoin's best monthly performance since 2012 amid institutional adoption surge.
Bitcoin Rockets to $116,855 as BTC Eyes Historic September Performance
BTC trades at $116,855 with momentum indicators flashing bullish signals as Bitcoin posts its strongest September in over a decade.
Bitcoin (BTC) Surges Above $116K as Bulls Target New Resistance at $124K
BTC price hits $116,217 with 0.67% daily gains as technical indicators show strong bullish momentum despite trading near upper Bollinger Band resistance levels.
Bitcoin Price Surges Past $115K as BTC Tests Key Resistance Levels
BTC price currently trades at $115,007 with bullish momentum building. Technical indicators suggest potential breakout above $116,757 resistance.
Bitcoin Breaks $116K Barrier - BTC Price Eyes Standard Chartered's $135K Target
Bitcoin trading at $114,784 after briefly surging past $116K. Technical indicators show bullish momentum despite minor pullback as analysts target $135K by month-end.
Bitcoin Hovers Near $116K as Crypto Euphoria Fades - BTC Technical Analysis
Bitcoin trades at $115,905 with mixed signals as investor enthusiasm wanes. RSI shows neutral momentum while BTC approaches key resistance levels.
Bitcoin Surges to $115,790 as Standard Chartered Predicts $135K BTC Target
BTC trades at $115,790 (+0.66%) near resistance as major bank forecasts $135,000 by month-end despite Czech regulatory concerns creating mixed signals.
Bitcoin Surges to $115,000 as Whale Accumulation Drives BTC Recovery
BTC hits $115,000 with 0.83% daily gains as mid-sized whales accumulate over 3.65M coins, signaling renewed institutional confidence despite recent volatility.
Bitcoin Surges Above $113K as Technical Indicators Flash Bullish Signals (BTC)
Bitcoin trades at $113,530 with momentum building as BTC breaks above key moving averages and approaches $115K resistance level.
Bitcoin (BTC) Faces Historical September Volatility as Price Holds Above $112K
BTC trades at $112,671 amid September's notorious volatility patterns, with 72% historical decline probability on key dates and Fed rate cut uncertainty looming.
Bitcoin Hovers Near $111K as BTC ETF Outflows Weigh on Market Sentiment
BTC trades at $111,100 with modest 0.48% gains, but $1.2B ETF outflows over 8 days signal weakening institutional demand despite recent technical recovery attempts.
Bitcoin Retakes $111K as BTC Price Rebounds from Recent Correction
BTC trades at $111,179 (+0.37%) as bulls attempt recovery following August's historic $124K peak and subsequent pullback to support levels.
Bitcoin Hovers Near $111K as BTC Price Shows Mixed Signals Ahead of Fed Decision
BTC trades at $110,696 (-1.48% daily) with technical indicators suggesting consolidation phase while rate cut expectations provide underlying support for Bitcoin price action.
Bitcoin (BTC) Tests Key Support at $111K as $5B in Bearish Bets Weigh on Price
Bitcoin trades at $111,599 (+0.85%) as massive bearish options positions and seasonal weakness challenge the crypto's recent recovery from strong support levels.
Bitcoin Price Hovers at $110,770 as BTC RSI Shows Neutral Zone Trading
Bitcoin trades at $110,769.99 (-0.14% daily) with neutral RSI at 44.73. Trump family backing and Tether USDT integration fuel optimism despite recent correction.
Bitcoin Price Holds Above $111K Despite DeFi Exploit Concerns - BTC Technical Analysis
Bitcoin trades at $111,168 (+0.68%) as BTC RSI remains neutral at 45.47 while recent DeFi hack raises sector-wide security concerns despite positive regulatory signals.
Bitcoin Price Faces $107K Support Test as BTC RSI Shows Oversold Signals
BTC trades at $110,204 (+1.72%) as technical indicators suggest potential bounce from key support levels amid mixed market sentiment and recent volatility.
Bitcoin (BTC) Slides Below $108K as August Decline Erases Summer Rally
BTC price drops to $107,962 (-0.68%) as technical indicators flash bearish signals following 6% monthly decline that wiped out summer gains.
Bitcoin RSI Hits 38.62 as BTC Price Consolidates Near $108K Support
Bitcoin trades at $108,744 (+0.31%) with RSI at 38.62 signaling potential oversold conditions while institutional buying continues despite bearish momentum signals.
Bitcoin Faces Bearish Momentum as BTC Price Tests Critical Support at $107K
BTC trading at $108,411 (-1.35%) with RSI at 37.72 signaling potential oversold conditions. Key support at $107,350 under pressure amid mixed market signals.
Bitcoin Faces $108K Support Test as BTC Price Drops 2.74% Amid Mixed Signals
BTC trades at $109,889 after declining from $113K highs. Eric Trump's $1M prediction battles bearish technical indicators as Bitcoin approaches critical support.
Bitcoin (BTC) Faces Bearish Pressure Despite Institutional Buying Wave at $112,241
BTC trades at $112,241 (+0.30%) as institutional adoption accelerates but technical indicators signal potential weakness ahead for Bitcoin traders.
Bitcoin Holds Above $117K Despite Inflation Fears as BTC Tests Critical Support
BTC trades at $117,900 (+0.36%) after sliding from record $124K high, with Bitcoin's RSI neutral at 52 as inflation data triggers volatility concerns.
Bitcoin Price Drops 4% to $117,460 Despite Record High as Inflation Data Triggers Correction
BTC trades at $117,460 after falling from $124,480 record high. Bitcoin technical analysis shows neutral RSI amid mixed momentum signals.
Bitcoin (BTC) Retreats to $118,300 After Record $124K High as Fed Policy Uncertainty Emerges
BTC price pulls back 4.1% to $118,300 following yesterday's record $124,480 peak, with Bitcoin technical analysis showing neutral momentum despite bullish trend intact.
Bitcoin Surges to Fresh $124K All-Time High as Fed Rate Cut Hopes Drive BTC Rally
Bitcoin (BTC) hits new record at $124,002.49 amid Federal Reserve rate cut expectations, with technical indicators showing strong bullish momentum and institutional demand
Bitcoin Surges Above $120K as BTC Technical Indicators Flash Mixed Signals
BTC trades at $120,115 (+1.21%) despite recent ETF outflows, with technical analysis showing bullish momentum but resistance ahead at $123K levels.
Bitcoin Price Surges Above $118K as Trump's 401(k) Crypto Order Sparks Rally (BTC)
BTC trades at $118,940 after Trump's executive order allowing crypto in retirement plans unlocks potential $9T investment flow despite recent 2.67% pullback.
BTC Price Analysis - August 12, 2025
** Bitcoin targets $125,996 within 7 days following Trump's retirement account executive order and institutional accumulation, with 83.3% bullish probability based on MACD divergence signals.
Bitcoin Breaks $122K Resistance as Trump Crypto Order Fuels BTC Rally
BTC surges 3.26% to $122,001 after Trump's retirement account crypto executive order, with technical indicators showing bullish momentum despite recent ETF outflows.
Bitcoin (BTC) Holds Above $117K Despite Recent ETF Outflows - Technical Signals Point to Continued Strength
BTC trades at $117,866 with neutral RSI at 57.25. Recent regulatory wins offset by ETF outflows, but technical indicators suggest bullish momentum remains intact.
Bitcoin Price Holds Above $116K Despite ETF Outflows as BTC Technical Analysis Shows Mixed Signals
BTC trades at $116,345.99 (-0.34% daily) amid regulatory wins and ETF concerns. Key support at $111,920 while RSI neutral suggests consolidation phase ahead.
Bitcoin Surges Past $116K as Apple's $600B Investment Boosts Market Confidence - BTC Analysis
BTC price climbs to $116,731 (+1.84% daily) amid renewed corporate confidence, though technical indicators show mixed signals for short-term direction.
Bitcoin Drops to $114K as Long-Term BTC Holders Trigger Major Sell-Off
BTC trades at $114,820 after falling below $114K yesterday. Long-term holders dumped 80,000 BTC from Satoshi-era wallet, creating selling pressure despite strong institutional demand.
Bitcoin Price Analysis: BTC Tests $114K Support as Bears Take Control
Bitcoin trades at $114,285 amid bearish momentum signals. RSI neutral at 46.43 while MACD shows negative divergence, suggesting potential downside risks ahead.
Bitcoin Price Drops to $113,589 as Fed Holds Rates Steady - BTC Technical Analysis Shows Mixed Signals
Bitcoin trades at $113,589 (-0.38% in 24h) as Federal Reserve rate decisions weigh on crypto markets despite strong institutional adoption signals
Bitcoin Price Drops to $114K as BTC Tests Lower Bollinger Band Support
BTC price falls 1.39% to $114,028 as Bitcoin technical analysis reveals neutral RSI and bearish MACD momentum, testing critical support levels.
Bitcoin Price Tests $115K Support as BTC Shows Mixed Technical Signals
BTC trades at $115,203 (-2.81% today) with bearish momentum indicators conflicting with bullish long-term trend structure
Bitcoin (BTC) Consolidates Near $118K as Whale Bets $23.7M on $200K Target
BTC price holds steady at $118,407 with neutral RSI at 59.46. Major whale options bet signals bullish outlook despite recent consolidation phase around key resistance levels.
Bitcoin Hovers Near $118K as White House Digital Asset Report Looms
BTC price trades at $118,034 (-0.64% daily) with mixed technical signals as regulatory clarity awaits from today's White House digital asset framework report.
Bitcoin Struggles Below $118K as BTC Price Tests Key Support Levels
BTC trades at $118,028 (-0.33% daily) as bears challenge recent highs. Technical indicators show mixed signals while regulatory clarity provides longer-term optimism.
Bitcoin Price Holds Strong Above $118K Despite Recent Volatility - BTC Technical Analysis
Bitcoin trades at $118,274 with bullish momentum intact. Technical indicators show mixed signals as BTC navigates between key support and resistance levels.
Bitcoin Price Drops to $117,465 as BTC Tests Critical Support Amid Market Volatility
Bitcoin trades at $117,465 (-0.46% in 24h) as BTC price faces bearish pressure following Thursday's sharp decline, with key technical levels in focus.
Bitcoin Consolidates Near $118K as Regulatory Momentum Builds (BTC)
BTC trades at $118,031 with neutral RSI at 61, consolidating after hitting new $122K all-time high driven by U.S. crypto regulatory clarity.
Bitcoin Holds Above $118K as Institutional Adoption Accelerates - BTC Shows Resilient Bullish Structure
BTC price trades at $118,468 (+0.44%) with strong institutional momentum following major regulatory wins and Standard Chartered's Bitcoin trading launch.
Bitcoin Surges Past $118K as Institutional Adoption Accelerates - BTC Eyes New Highs
BTC price currently trades at $118,730, up 1.31% as major banks enter crypto trading and regulatory clarity improves market sentiment.
Bitcoin Price Drops to $117K as BTC Tests Support After $123K All-Time High
BTC trades at $117,010 (-0.94%) as profit-taking follows record highs. Technical indicators show mixed signals with RSI at 61.93 in neutral territory.
Bitcoin Consolidates Near $117K as Institutional Demand Drives Multi-Day Rally
BTC trades at $117,292 (-0.47% in 24h) as institutional adoption fuels bullish momentum despite minor pullback from recent $123K all-time high.
Bitcoin Price Retreats to $116K After Trump Signs GENIUS Act - BTC Technical Analysis
BTC price drops 0.86% to $116,994 despite Trump signing crypto-friendly GENIUS Act. Technical indicators show mixed signals as Bitcoin consolidates below ATH.
Bitcoin Price Surges Past $118K Despite Regulatory Headwinds as Institutional Demand Remains Strong
BTC price holds above $118,000 with bullish momentum intact despite Trump's GENIUS Act signing. Technical indicators suggest continued upside potential.
Bitcoin Hits New Highs Above $123K Before Pullback: Technical Analysis & Price Outlook July 2025
Bitcoin surged to record highs of $123,000 driven by U.S. pro-crypto legislation and institutional demand, but faces volatility as it trades near $118K support levels.
Bitcoin Soars Past $120K: Institutional Demand and Pro-Crypto Legislation Drive Historic Rally
Bitcoin reaches new all-time highs above $120,000 as institutional investment and favorable U.S. regulatory developments propel the crypto market past $4 trillion valuation.
Bitcoin Hits All-Time High Amid Institutional Adoption and Regulatory Clarity
Bitcoin surged past $120,000, driven by institutional adoption, ETF inflows, and U.S. regulatory progress. Technical upgrades and bullish indicators signal further growth.
Bitcoin Price Update: Institutional Adoption, Regulatory Clarity, and Satoshi-Era Whale Impact
Bitcoin hits $122K before correcting to $117K as institutional adoption grows. Regulatory clarity boosts confidence, but a Satoshi-era whale sparks sell-off fears.
Bitcoin Price Dips Below $118K Amid Institutional Era and Regulatory Clarity
Bitcoin fell to $117,484.71, reflecting a minor pullback after reaching $122K. Despite short-term volatility, institutional adoption, regulatory clarity, and technical upgrades bolster its long-ter...
Bitcoin Hits New All-Time High: Institutional Adoption and U.S. Crypto Week Drive Momentum
Bitcoin surges past $122,000 as institutional investments and U.S. regulatory clarity boost market sentiment. Discover key market drivers, technical insights, and price forecasts.
Bitcoin Surges to Record $122K Amid Institutional Adoption and Regulatory Optimism
Bitcoin hits an all-time high of $122,000, fueled by institutional adoption, regulatory clarity, and technical upgrades. Discover key insights, technical analysis, and future price predictions.
Bitcoin Hits $118K: ETF Momentum, Regulatory Clarity, and Strong Bullish Trends Propel Market
Bitcoin reached a historic $118,000, fueled by ETF adoption and favorable regulations. Despite minor hurdles like exchange delistings and security concerns, BTC shows strong bullish momentum.
Bitcoin Hits $118K All-Time High: Adoption, ETFs, and Institutional Momentum Drive Surge
Bitcoin reached a historic all-time high of $118,755 this week, fueled by institutional adoption, pro-crypto legislation, and ETF inflows. What’s next for BTC?
Bitcoin Hits $118K All-Time High: Analyzing Market Momentum, Technicals, and Future Outlook
Bitcoin surged past $118,000, setting a new all-time high amidst ETF inflows, regulatory optimism, and bullish momentum. Explore key trends, technical analysis, and trading strategies.
Bitcoin Surges to $117,793: Technical Analysis, Trading Signals, and Outlook for July 2025
Bitcoin hits a new 52-week high of $117,793, gaining 5.91% in 24 hours. Explore recent market developments, technical analysis, and actionable trading strategies.
Bitcoin Surges to $110,988 as July Volatility Looms - Here is Why
Bitcoin hits $110,988 with strong bullish momentum amid Trump's crypto policies, tariff deadlines, and ETF inflows. Technical analysis shows bullish setup with RSI at 61.
CAKE Tests Critical Support at $2.84 as DeFi Tokens Retreat Amid Bitcoin Weakness
PancakeSwap (CAKE) trades at $2.84, down 3.3% in 24h, testing its 50-day moving average as broader crypto markets decline following Bitcoin's retreat from recent highs.
CAKE Price Tests 50-Day Moving Average as DeFi Token Consolidates Near $2.86
PancakeSwap (CAKE) trades at $2.86, down 1.6% as the DeFi token consolidates around its 50-day moving average while broader crypto markets face headwinds from Bitcoin weakness.
** PancakeSwap Price Action: CAKE Consolidates Above Key Support Despite Bearish MACD Signals
** CAKE price trades at $2.64 with 3.25% daily gains as PancakeSwap maintains bullish structure despite mixed momentum indicators signaling potential consolidation ahead.
PancakeSwap (CAKE) Tests $2.55 Support After 8% Rally Fades on Record Volume
CAKE price retreats to $2.55 (-1.16%) as profit-taking follows recent surge driven by PancakeSwap's record $58.7B trading volume and supply reduction proposal.
PancakeSwap (CAKE) Fights Back After 5% Drop - Token Burn Provides Support at $2.67
CAKE price retreats 4.95% to $2.67 despite massive 9M token burn and anniversary trading campaign, but technical indicators suggest bulls may regain control.
PancakeSwap (CAKE) Surges 3.26% as Bulls Target $3.15 Resistance
CAKE price climbs to $2.82 with bullish momentum indicators and strong volume, testing key resistance levels as technical analysis suggests continued upside potential.
PancakeSwap (CAKE) Shows Bullish Momentum Despite 1.32% Daily Drop
CAKE price trades at $2.70 with bullish MACD signals emerging, while technical indicators suggest potential upside toward $3.15 resistance levels.
** PancakeSwap (CAKE) Surges Past $2.90 as Record Volume Drives Bullish Momentum
** CAKE price hits $2.92 (+3.99% in 24h) following record $58.7B August trading volume. Technical indicators signal strong bullish momentum with RSI at 63.34.
PancakeSwap (CAKE) Breaks Above $2.75 as Record Trading Volume Fuels 8% Rally
CAKE price surges to $2.79 (+3.23% in 24h) following PancakeSwap's record $58.7B August trading volume and community proposal to reduce token supply to 450 million.
** PancakeSwap (CAKE) Faces Resistance at $2.79 Despite Strong Technical Momentum
** CAKE price holds above key support at $2.67 amid mixed signals. Technical indicators show bullish momentum while recent trading volume decline raises concerns.
PancakeSwap (CAKE) Surges 8.23% as Record $58.7B Trading Volume Drives Bullish Momentum
CAKE price jumps to $2.76 with 8.23% daily gains following PancakeSwap's record $58.7 billion August trading volume announcement and strategic token burn initiatives.
PancakeSwap (CAKE) Rallies 3.7% as DEX Records $58.7B Trading Volume Milestone
CAKE price surges to $2.54 following PancakeSwap's record August trading volume of $58.7 billion, while technical indicators suggest continued bullish momentum ahead.
PancakeSwap (CAKE) Hits $2.52 as $58.7B Volume Record Drives Technical Breakout
CAKE price surges 2.94% to $2.52 following PancakeSwap's record $58.7 billion August trading volume, with bullish momentum indicators signaling potential continuation.
PancakeSwap (CAKE) Tests Key Support at $2.46 After Record Trading Volume Surge
CAKE price drops 3% to $2.46 despite August's record $58.7B trading volume as RSI signals neutral momentum near critical support levels.
PancakeSwap (CAKE) Price Analysis: Testing Key Support at $2.53 Amid Record Trading Volume
CAKE trades at $2.53 (-4.75%) as technical indicators show mixed signals despite PancakeSwap achieving record $58.7B trading volume in August 2025.
PancakeSwap (CAKE) Surges 5% as Platform Records $58.7B Trading Volume Milestone
CAKE price jumps to $2.66 with strong bullish momentum as PancakeSwap celebrates record trading volumes and launches $250K anniversary campaign.
PancakeSwap (CAKE) Surges 18% as Token Supply Cut Proposal Passes - Bulls Target $2.79
CAKE price climbs to $2.56 (+2.24% daily) following community approval of token supply reduction to 450M. Technical indicators show bullish momentum building.
CAKE Price Surges 4.8% as PancakeSwap Hits Record Trading Volume
CAKE trades at $2.53 with 4.8% daily gains following PancakeSwap's $58.7B August volume milestone, though technical indicators show mixed signals ahead.
PancakeSwap (CAKE) Consolidates at $2.43 as $19M Token Burn Fails to Spark Rally
CAKE price holds steady at $2.43 despite recent $19M token burn and record trading volumes, with technical indicators showing mixed signals ahead of potential breakout.
PancakeSwap (CAKE) Holds $2.45 Support Despite Record $58.7B Trading Volume
CAKE price stabilizes at $2.45 (+1.62%) as PancakeSwap achieved record August volume, but technical indicators show mixed signals ahead of key resistance test.
PancakeSwap (CAKE) Price Analysis: Neutral Trading Despite $58.7B Volume Milestone
CAKE price holds steady at $2.42 (+0.88%) while PancakeSwap achieves record $58.7B August trading volume, but technical indicators suggest mixed signals ahead.
PancakeSwap (CAKE) Faces Key Technical Test at $2.40 After $58.7B Volume Surge
CAKE price holds steady at $2.40 (+1.01%) despite record trading volume milestone, with technical indicators showing mixed signals as bears test critical support.
CAKE Price Drops to $2.36 as PancakeSwap Technical Indicators Flash Mixed Signals
PancakeSwap (CAKE) trades at $2.36 after a 0.51% decline, with RSI at 37.78 signaling potential oversold conditions while price approaches key support levels.
PancakeSwap (CAKE) Hovers Near Support at $2.38 as Bears Test Key Levels
CAKE price sits at $2.38 with RSI at 38.71, approaching oversold territory while trading near crucial Bollinger Band support of $2.34.
CAKE Price Holds Above $2.40 as PancakeSwap Shows Mixed Technical Signals
PancakeSwap (CAKE) trades at $2.43 with modest 0.17% daily gains, but technical indicators reveal conflicting signals as CAKE RSI sits in neutral territory.
PancakeSwap (CAKE) Falls to $2.50 Amid Bearish Momentum Despite Supply Cut
CAKE price drops 4.1% to $2.50 with bearish technical indicators overshadowing PancakeSwap's deflationary supply reduction to 450 million tokens.
PancakeSwap (CAKE) Tests $2.45 Support as Token Supply Reduction Strategy Unfolds
CAKE price trades at $2.51 amid mixed signals - deflationary supply cuts clash with bearish technicals as traders eye critical support levels.
PancakeSwap (CAKE) Drops to $2.48 as Technical Indicators Flash Mixed Signals
CAKE price falls 1.20% to $2.48 amid bearish momentum, but deflationary tokenomics and oversold conditions suggest potential reversal opportunity for traders.
PancakeSwap CAKE Price Falls 4.1% Despite $12M Token Burn and Security Upgrades
CAKE trades at $2.51 after declining 4.13% in 24 hours, testing lower Bollinger Band support despite recent positive developments including an 8.27 million token burn.
PancakeSwap (CAKE) Shows Mixed Signals as Price Hovers at $2.59 Support Zone
CAKE trades at $2.59 amid neutral RSI conditions, with technical indicators pointing to potential consolidation around key support levels despite recent bearish momentum.
PancakeSwap (CAKE) Falls 5.24% Despite $12M Token Burn and Stock Perpetuals Launch
CAKE price drops to $2.66 (-5.24%) as profit-taking follows recent innovations including Stock Perpetuals launch and major token burn worth $12 million.
CAKE Price Soars 4.70% as PancakeSwap Stock Perpetuals Launch Powers Recovery
CAKE trading at $2.83 with 4.70% gains following PancakeSwap's stock perpetuals launch and $12M token burn, though technical indicators show mixed signals ahead.
** PancakeSwap (CAKE) Drops 7% as Traders Take Profits After Stock Perpetuals Launch
** CAKE trades at $2.76 after a 7% daily decline, with technical indicators showing mixed signals following PancakeSwap's major Stock Perpetuals announcement.
CAKE Price Surges 4% as PancakeSwap Launches Stock Perpetuals and Burns $12M in Tokens
CAKE trades at $2.87 with 4% daily gains as PancakeSwap introduces Apple and Tesla perpetuals while burning 8.27M tokens worth $12 million, triggering bullish momentum.
PancakeSwap (CAKE) Faces Short-Term Pressure Despite Innovation Push - Technical Analysis
CAKE price drops 3.52% to $2.71 amid profit-taking, but recent Stock Perpetuals launch and strong weekly gains signal underlying bullish momentum remains intact.
PancakeSwap (CAKE) Price Analysis: Consolidation at $2.79 After Major Announcement Tease
CAKE trades at $2.79 (-0.53% daily) following last week's surge on major announcement hint. Technical indicators show mixed signals as bulls test resistance.
PancakeSwap (CAKE) Price Retreats to $2.82 Despite Recent Rally on Major Announcement Teasers
CAKE price drops 3.16% to $2.82 after hitting $2.94 high, but technical indicators suggest bullish momentum remains intact with RSI at 57 and price above key moving averages.
PancakeSwap CAKE Price Rallies 4% to $2.88 as Major Announcement Teaser Drives Momentum
CAKE price surges 4.05% to $2.88 as PancakeSwap teases major announcement, with technical indicators showing bullish momentum above key moving averages.
PancakeSwap (CAKE) Surges 4.8% as Major Announcement Sparks Rally Above $2.70
CAKE price climbs to $2.70 with 4.8% daily gains as PancakeSwap teases major announcement, while technical indicators show mixed signals in the neutral zone.
PancakeSwap (CAKE) Tests $2.57 Support as RSI Signals Neutral Territory
CAKE price dropped 2.02% to $2.57, testing key support levels while RSI indicators show neutral momentum following recent consolidation phase.
PancakeSwap (CAKE) Consolidates at $2.60 Following 28% Rally as RSI Neutralizes
CAKE price holds steady at $2.60 after last week's dramatic surge, with technical indicators showing healthy consolidation above key moving averages despite bearish momentum signals.
PancakeSwap (CAKE) Tests Support at $2.57 Despite Recent Rally Momentum
CAKE price drops 0.54% to $2.57 as technical indicators show mixed signals following last week's impressive 28% surge above key resistance levels.
PancakeSwap (CAKE) Tests Support at $2.58 as Bulls Pause After 28% Rally
CAKE trades at $2.58 (-1.86% daily) following last week's massive breakout, with key support at $2.31 and RSI neutral at 47.69 signaling potential consolidation phase.
PancakeSwap (CAKE) Tests Support at $2.62 Despite Recent Supply Reduction Proposal
CAKE price retreats 6.79% to $2.62 as profit-taking emerges following last week's 13% surge and supply reduction announcement.
PancakeSwap (CAKE) Holds $2.87 After 28% Rally as RSI Neutralizes From Overbought Territory
CAKE price stabilizes at $2.87 following a dramatic 28% surge, with technical indicators showing healthy consolidation above key moving averages and RSI cooling to neutral levels.
PancakeSwap (CAKE) Retreats to $2.77 After 28% Surge as RSI Cools From Overbought Levels
CAKE price drops 7% to $2.77 after hitting $3.32 highs, with RSI at 56.85 signaling healthy pullback from recent breakout momentum.
PancakeSwap (CAKE) Consolidates at $3.00 After 28% Surge - Technical Analysis Shows Key Resistance Test
CAKE price trades at $3.00 (-7.54% today) after hitting $3.33 highs. RSI at 68 signals potential pullback from resistance as BNB correlation drives momentum.
PancakeSwap (CAKE) Tests $3.00 Resistance After 13% BNB-Driven Rally
CAKE price currently at $2.94 after retreating from $3.25 high. Technical indicators show bullish momentum despite pullback as BNB ecosystem benefits drive interest.
PancakeSwap (CAKE) Surges to $2.81 as Supply Reduction Proposal Drives Bullish Momentum
CAKE price hits $2.81 (+1.12% in 24h) as the 300 million token supply reduction proposal continues to fuel investor optimism and technical indicators signal strength.
CAKE Price Surges 4.6% as PancakeSwap Shows Strong Bullish Momentum
CAKE price hits $2.76 with bullish technical signals emerging. RSI at 65.51 and MACD showing positive momentum as traders eye $2.99 resistance level.
PancakeSwap (CAKE) Surges Above $2.67 as Token Supply Reduction Proposal Fuels Bullish Momentum
CAKE price hits $2.67 with strong bullish signals following the 300 million token supply reduction proposal, while technical indicators show continued upside potential.
PancakeSwap (CAKE) Price Surges Past $2.70 as Supply Reduction Proposal Fuels Rally
CAKE price hits $2.73 with +2.70% gains as developers propose cutting 300M tokens from supply. Technical indicators show overbought conditions but bullish momentum remains strong.
Cardano Holds Upside Momentum as It Faces $1.49 Resistance Zone
Indicators signal the resistance of Cardano (ADA) is decreasing as the price of ADA is in a slow uptrend against the US dollar.
Cardano Elbows Ripple to Take 6th Position, Thanks to Heightened Development Activity
Cardano (ADA) has been scaling the heights because it is now the sixth-largest cryptocurrency after dethroning Ripple (XRP) with a market capitalization of $20.71 billion, according to CoinMarketCap.
Assets Belonging to Troubled Crypto Lender Celsius to go Under the Hammer
Celsius Network Ltd., a troubled and bankrupt crypto lender, has disclosed the auction dates for its assets.
How Chainalysis Enhances Crypto Investigations with Advanced Tools
Chainalysis supports crypto investigations by discovering leads, building cases, and seizing illicit assets, utilizing advanced blockchain analysis tools.
Debunking Overblown Claims on Crypto and Terrorism Financing
Chainalysis debunks inflated claims on cryptocurrency's role in terrorism financing, emphasizing the predominant use of traditional fiat-based channels by terrorist groups. The analysis highlights the challenges and common misconceptions in tracing terrorist fund flows on the blockchain, particularly concerning service provider identification.
Chiliz (CHZ) Surges 15% Amid 2022 World Cup Tournament, Mainnet Launch
Chiliz is the latest crypto token on the bullish trend. The token is more than 15% for the last 7 days.
Claude.ai Unveils New Analysis Tool Enhancing Data Processing Capabilities
Claude.ai introduces an advanced analysis tool enabling JavaScript code execution for data processing, offering real-time insights and enhanced data analysis capabilities for various teams.
CNBC’s Brian Kelly Warns of a Bitcoin Short-Term Correction to $12,000
Brian Kelly, CNBC Fast Money trader, continues to be bullish for Bitcoin but warns of a short-term correction to $12,000.
CRV Price Prediction: Targeting $0.48 by January 2026 Amid Mixed Technical Signals
CRV price prediction points to $0.48 target within 30 days despite current bearish sentiment, while technical analysis suggests consolidation around $0.39 pivot level.
CRV Price Prediction: Targeting $0.55-$0.76 Recovery Within 30 Days Despite Current Bearish Sentiment
CRV price prediction suggests potential 37-90% upside to $0.55-$0.76 range despite current $0.40 level, with critical $0.45 resistance determining near-term direction.
CRV Price Prediction: Targeting $0.55-$0.76 Medium-Term Despite Near-Term Headwinds
CRV price prediction shows mixed signals with bearish near-term pressure but bullish medium-term targets of $0.55-$0.76 as MACD momentum turns positive.
CRV Price Prediction: Targeting $0.48-$0.76 by January 2025 as Bullish Momentum Builds
Curve (CRV) shows early bullish signals with MACD histogram turning positive. Technical analysis suggests $0.48 short-term target with potential rally to $0.76 range.
CRV Price Prediction: Targeting $0.55-$0.76 Recovery by Year-End Despite Current Weakness
CRV price prediction shows potential 45-100% upside to $0.55-$0.76 by December 2025, with technical indicators suggesting bullish momentum despite recent 7.29% decline.
CRV Price Prediction: Targeting $0.55-$0.76 by January 2026 as Technical Momentum Builds
CRV shows bullish momentum with MACD histogram turning positive. Analysts target $0.55-$0.76 medium-term as Curve breaks key resistance levels.
CRV Price Prediction: Targeting $0.55-$0.76 Range by January 2025 Amid Technical Recovery
CRV price prediction shows potential 41-95% upside to $0.55-$0.76 range within 4-6 weeks as technical indicators signal bullish momentum despite current consolidation phase.
CRV Price Prediction: Targeting $0.55 Breakout by January 2025 Amid Technical Consolidation
CRV price prediction shows potential 45% upside to $0.55 within 4-6 weeks, with analysts forecasting medium-term targets up to $0.76 as bullish MACD signals emerge.
CRV Price Prediction: $0.75-$0.90 Target by January 2025 as Technical Indicators Signal Recovery
CRV price prediction shows bullish momentum emerging with $0.75-$0.90 targets by January 2025 as MACD signals reversal from oversold conditions.
CRV Price Prediction: Targeting $0.55-$0.76 by December 2025 as Technical Indicators Signal Bullish Momentum
CRV price prediction shows potential 22-69% upside as MACD histogram turns positive and price breaks above key moving averages, targeting $0.55-$0.76 range.
CRV Price Prediction: Targeting $0.55 Resistance Break with $0.44 Pivot Defense Through December 2025
CRV price prediction shows neutral momentum at $0.44 with bullish MACD divergence. Curve forecast targets $0.55 resistance break for 25% upside potential by year-end.
CRV Price Prediction: Targeting $0.60-$0.72 Range Within 30 Days Despite Current Consolidation
CRV price prediction indicates potential recovery to $0.60-$0.72 range over the next month, with immediate resistance at $0.55 and critical support holding at $0.36.
CRV Price Prediction: Oversold Bounce to $0.42-$0.50 Target Within 4 Weeks
CRV price prediction shows potential 13-35% upside as oversold conditions and $0.37 support level create bullish reversal setup targeting $0.42-$0.50 range.
CRV Price Prediction: Targeting $0.48 by December 2025 Despite Current Bearish Momentum
CRV price prediction suggests a bounce to $0.48 within 4 weeks as oversold conditions and key support at $0.37 create potential reversal setup for Curve token.
CRV Price Prediction: Targeting $0.48-$0.55 Breakout Within 2-4 Weeks
CRV price prediction shows bullish MACD momentum targeting $0.48-$0.55 range as Curve tests critical $0.46 resistance with strong analyst consensus supporting upside potential.
CRV Price Prediction: Curve Targets $0.52 Breakout Within 2 Weeks Amid Bullish MACD Momentum
CRV price prediction analysis reveals potential 21% upside to $0.52 target as MACD histogram shows bullish momentum, with critical $0.46 resistance determining direction.
CRV Price Prediction: $0.52 Target Within 2 Weeks as Technical Momentum Builds
CRV price prediction shows potential 21% upside to $0.52 target within two weeks, supported by bullish MACD momentum and analyst forecasts pointing toward breakout.
CRV Price Prediction: Targeting $0.55 Breakout Within Two Weeks as Technical Momentum Builds
CRV price prediction shows bullish momentum emerging with MACD turning positive. Curve forecast targets $0.52-$0.55 near-term with key $0.60 resistance breakout needed.
CRV Price Prediction: Targeting $0.60 Resistance Break Within 2 Weeks
CRV price prediction points to potential 25% upside to $0.60 as MACD shows bullish momentum. Critical support at $0.39 must hold for Curve forecast to materialize.
CRV Price Prediction: Targeting $0.60-$0.72 in December Amid Mixed Technical Signals
CRV price prediction points to $0.60-$0.72 upside by December 2025, with current oversold conditions creating potential buying opportunity despite bearish analyst consensus.
CRV Price Prediction: Target $0.75 by December 2025 as Curve Shows Early Recovery Signs
CRV price prediction suggests a potential 56% rally to $0.75 within 4-6 weeks as technical indicators show bullish MACD divergence and oversold bounce potential.
CRV Tests Critical $0.55 Pivot Point as Broader Crypto Weakness Pressures DeFi Tokens
Curve (CRV) trades at $0.55 following a 2.15% decline as technical indicators signal potential breakdown below key pivot level amid broader market weakness.
CRV Tests Key Pivot Point at $0.57 as Technical Momentum Builds After 8.4% Daily Surge
Curve (CRV) rallies to $0.57 pivot level with 8.4% gains as technical indicators signal potential breakout above critical resistance zones in absence of major catalysts.
CRV Tests Critical Support at $0.52 as Technical Indicators Signal Potential Reversal
Curve (CRV) trades at $0.52 with modest 0.2% gains as technical analysis reveals oversold conditions below all major moving averages, setting up potential bounce scenario.
CRV Tests Support at $0.52 as US Strategic Bitcoin Reserve Lifts Crypto Sentiment
Curve (CRV) trades at $0.52 amid broader crypto optimism following the US government's establishment of a Strategic Bitcoin Reserve, though technical indicators suggest caution.
Curve Market Alert: CRV Shows Mixed Signals as Price Hovers Near Critical Support Zone
CRV trades at $0.69 (+5.20%) while technical indicators flash conflicting signals. Key support at $0.63 could determine next major move for Curve protocol token.
CRV Price Analysis: Curve Token Hovers Near Critical Support as Bearish Momentum Builds
CRV price trades at $0.66 with 0% 24h change as Curve technical analysis reveals concerning signals near key $0.63 support level.
CRV Price Analysis: Curve Faces Bearish Pressure at $0.68 Support
CRV price drops 1.17% to $0.68, testing critical support levels as Curve technical analysis reveals weakening momentum indicators across multiple timeframes.
CRV Price Analysis: Curve Token Tests Critical $0.65 Support Amid Mixed Technical Signals
CRV price trades at $0.70 (+1.51% daily) while testing key support levels. Technical indicators show neutral momentum with potential for reversal near critical zones.
CRV Price Drops to $0.69 as Curve Token Tests Critical Support Levels
Curve (CRV) trades at $0.69 with bearish momentum as technical indicators signal potential further downside amid oversold conditions.
CRV Price Plunges 12.45% as Curve Token Faces Technical Breakdown
CRV price drops to $0.70 amid bearish momentum, with technical indicators signaling potential further downside despite oversold conditions on the daily timeframe.
Curve (CRV) Price Holds $0.80 as Bullish Momentum Builds
CRV trades at $0.80 with 2.36% daily gains. Technical indicators suggest bullish momentum as Curve breaks above key moving averages with neutral RSI.
CRV Price Holds Above Key Support as Curve Shows Mixed Technical Signals
CRV trades at $0.78 with neutral RSI at 47.15, showing potential for directional breakout as Curve approaches critical technical levels on Binance data.
CRV Price Rebounds 2.2% as Curve Shows Mixed Technical Signals
Curve (CRV) trades at $0.79 with 2.20% daily gains, but faces resistance near $0.86 while RSI remains neutral at 48.81 amid conflicting technical indicators.
CRV Price Surges 9% as Curve Technical Analysis Shows Bullish MACD Crossover
Curve (CRV) price jumps to $0.80 (+8.95% in 24h) as technical indicators signal potential reversal, with CRV RSI neutral at 49 and bullish MACD momentum emerging.
CRV Price Hovers Near Support at $0.73 as Technical Indicators Signal Mixed Outlook
Curve (CRV) trades at $0.73 with minimal 24h movement while technical analysis reveals oversold conditions and key support holding at current levels.
CRV Price Hovers Near Support at $0.72 as Curve Shows Mixed Technical Signals
CRV price trades at $0.72 (-1.97% today) near critical support levels while Curve's RSI suggests potential oversold conditions may present buying opportunities.
CRV Price Falls 6% as Curve Token Tests Critical Support at $0.76
Curve (CRV) drops to $0.76 amid broader market weakness, with technical indicators showing mixed signals as the token approaches key support levels.
CRV Price Drops 5.34% to $0.80 as Curve Shows Mixed Technical Signals
Curve (CRV) trades at $0.80 after a 5.34% decline, with technical indicators showing neutral RSI at 48.52 but emerging bullish MACD momentum despite recent selling pressure.
Curve (CRV) Breaks Above $0.85 as Bullish Momentum Builds
CRV price surges 3.61% to $0.85 with strong technical indicators pointing to continued upside potential as momentum shifts bullish.
CRV Price Rallies 4.91% as Curve Shows Bullish Momentum - Technical Analysis
Curve (CRV) trades at $0.82 with a 4.91% daily gain. Technical indicators suggest bullish momentum as CRV price breaks above key moving averages.
CRV Price Surges 2.39% as Whales Accumulate 13.3M Tokens - Technical Breakout Targets $1.15
CRV trades at $0.80 after 2.39% daily gain, driven by massive whale accumulation. Technical analysis shows bullish MACD divergence with year-end targets up to $1.37.
Curve (CRV) Price Analysis: Mixed Signals as Whales Accumulate Despite Technical Weakness
CRV trades at $0.80 (+1.91%) after whale accumulation of 13.3M tokens, but bearish patterns challenge the bullish momentum in the short term.
CRV Price Holds Above Key Support as Curve Shows Mixed Technical Signals
Curve (CRV) trades at $0.78 with neutral momentum indicators suggesting consolidation phase. Key resistance at $0.94 remains the critical level to watch.
CRV Price Tests Key Support at $0.77 as Curve Shows Mixed Technical Signals
Curve (CRV) trades at $0.77 with 1.71% daily gains, but technical indicators reveal conflicting signals as CRV RSI sits in neutral territory at 43.70.
CRV Price Hovers Near Key Support as Curve Shows Mixed Technical Signals
CRV trades at $0.77 with -0.65% daily decline. Technical indicators suggest neutral momentum while support levels remain critical for short-term direction.
CRV Price Hovers at $0.76 as Curve Shows Mixed Technical Signals
CRV price trades at $0.76 with neutral RSI at 41.84 while Curve faces resistance at $0.94. Technical indicators suggest consolidation ahead.
CRV Price Consolidates at $0.77 Amid Mixed Technical Signals
Curve (CRV) trades at $0.77 with neutral RSI at 42, showing potential for directional breakout as price approaches key support levels.
CRV Price Consolidates at $0.77 Amid Mixed Technical Signals
Curve (CRV) trades at $0.77 with modest 1.20% daily gains, showing consolidation near key technical levels as RSI indicates neutral territory.
** CRV Price Drops to $0.75 as Curve Token Tests Critical Support Levels
** Curve (CRV) trades at $0.75 after a 0.67% decline, approaching key support as technical indicators flash mixed signals for DeFi protocol.
CRV Price Drops to $0.78 as Curve Shows Mixed Technical Signals
Curve (CRV) trades at $0.78 with -0.61% daily decline. RSI neutral at 42.30 while price sits below key moving averages, signaling potential consolidation phase.
CRV Price Tests Key Support at $0.78 as Technical Indicators Signal Mixed Outlook
Curve (CRV) trades at $0.78 with neutral RSI at 42, testing critical pivot point while momentum indicators suggest potential downside risk ahead.
CRV Price Tests Critical Support at $0.77 as Bearish Momentum Builds
Curve (CRV) trades at $0.77 with bearish MACD signals and RSI at 40.20, testing immediate support while approaching oversold territory.
CRV Price Drops 5.5% as Curve Tests Critical Support at $0.75
Curve (CRV) trades at $0.77 after a 5.5% decline, with technical indicators showing bearish momentum as the token approaches key support levels.
CRV Price Falls to $0.79 as Curve Faces Technical Breakdown After Sharp Sell-Off
CRV trades at $0.79 (-3.86% in 24h) with bearish momentum building as technical indicators signal potential further downside below key support levels.
CRV Price Struggles at $0.87 as Bearish Momentum Builds Despite Emission Cuts
CRV trades at $0.87 with bearish MACD signals and key support at $0.83 being tested, despite recent 15.9% emission reduction creating deflationary pressure.
CRV Price Surges as Curve Finance Cuts Token Emissions by 15.9%
CRV trades at $0.88 (+1.93%) following Curve's anniversary emission cut. Strong bullish momentum signals potential breakout above key resistance levels.
Curve (CRV) Drops 10.6% Despite Token Emission Reduction - Key Support at $0.85
CRV price falls to $0.93 after 10.6% decline, testing critical support levels despite Curve Finance implementing 15.9% emission reduction on its fifth anniversary.
CRV Price Surges to $1.05 as Curve Finance Cuts Token Emissions by 15.9%
CRV trades at $1.05 (+3.06% daily) following Curve's emission reduction and 40K monthly user milestone, with technical indicators showing strong bullish momentum.
CRV Price Surges to $1.00 as Curve Finance Cuts Emissions on 5th Anniversary
CRV trades at $1.00 (+6.51% daily) after Curve Finance reduced emissions by 15.9% on its fifth anniversary, with technical indicators showing bullish momentum continues.
CRV Price Falls 8.2% Despite Strong Bullish Trend - Key Support at $0.85
Curve (CRV) trades at $0.92 after an 8.2% decline, but technical indicators show bullish momentum with price holding above critical support levels.
CRV Price Surges to $0.99 as Curve Shows Very Strong Bullish Momentum
Curve (CRV) trades at $0.99 with 1.44% daily gains as technical indicators signal very strong bullish trend despite bearish MACD divergence warning.
CRV Price Consolidates at $0.97 After 85% Surge as Curve Hits 40K Users
CRV trades at $0.97 (-1.40% today) following record user growth to 40,000 monthly actives and massive 85% monthly gains, with technical indicators showing consolidation phase.
CRV Price Soars to $0.96 as Curve Finance Hits 40,000 User Milestone
CRV trades at $0.96 (+2.79% daily) after 85.25% monthly surge driven by record 40,000 active users and 140M token lockup, with technical indicators showing bullish momentum.
CRV Price Surges Above $0.90 as Curve Shows Very Strong Bullish Momentum
Curve (CRV) trades at $0.92 with 3.35% daily gains, displaying very strong bullish signals across multiple timeframes while approaching key resistance levels.
CRV Price Breaks $0.90 as Curve Shows Very Strong Bullish Momentum
CRV trades at $0.90 with 0.76% daily gains, displaying very strong bullish technical signals after recent breakout from consolidation phase.
CRV Price Rebounds 2.18% as Curve Token Tests Critical Support After Major Pullback
** CRV trades at $0.91 with 2.18% daily gains, finding support after a 9% correction from recent highs above $1. Technical indicators suggest consolidation phase.
CRV Price Holds Above $0.90 as Curve Shows Mixed Technical Signals
CRV trades at $0.90 with -0.79% decline amid neutral RSI and conflicting momentum indicators suggesting consolidation phase ahead for Curve protocol.
CRV Price Drops to $0.90 Despite Recent 79% Rally - Curve Token Faces Technical Correction
CRV trades at $0.90 after a -2.23% daily decline, pulling back from last week's explosive 79% surge that pushed Curve above $1 amid strong bullish momentum.
CRV Price Drops 9% Despite Recent Bullish Breakout Above $1 Resistance**
CRV price trades at $0.93 after a 9.19% pullback, testing key support levels following last week's impressive 79% surge above $1 resistance.**
CRV Price Surges 3.75% as Curve Shows Very Strong Bullish Momentum Above $1
CRV price hits $1.04 with strong bullish signals as Curve breaks above key moving averages, though MACD shows slight bearish divergence requiring caution.
CRV Price Drops 5.34% to $0.96 as Profit-Taking Follows Massive 79% Rally
CRV price retreats to $0.96 after massive weekly surge, with technical indicators showing mixed signals as traders take profits from recent 79% rally.
CRV Price Retreats to $1.01 After 79% Rally - Will Bulls Defend Key Support?
CRV trades at $1.01 following a pullback from $1.07 highs, as profit-taking emerges after the token's impressive 79% weekly surge driven by technical breakouts.
CRV Price Retreats to $1.01 After Massive 79% Rally Faces Technical Correction
CRV trades at $1.01 with a -3.86% daily decline as profit-taking emerges following last week's explosive 79% surge that pushed Curve to $1.07 highs.
CRV Price Soars to $1.07 After 79% Weekly Rally - Technical Breakout Fuels Bullish Momentum
CRV trades at $1.07 with 1.45% daily gains following a massive 79% weekly surge. Technical indicators show overbought conditions but bullish momentum remains strong.
CRV Price Explodes Past $1 as Curve Token Hits 79% Weekly Surge
CRV price surged to $1.06 with 79% weekly gains as Curve breaks key resistance levels. Technical indicators signal potential continuation despite overbought conditions.
CRV Price Surges 79% as Curve (CRV) Breaks $1 Resistance in Bullish Breakout
CRV price currently sits at $1.02 after a massive 79% weekly surge, with technical indicators showing overbought conditions but sustained bullish momentum.
CRV Price Surges 79% Weekly But Overbought RSI Signals Potential Pullback
CRV trades at $0.98 after explosive 79% weekly rally breaks key resistance, though technical indicators warn of overbought conditions ahead.
CRV Price Rallies 79% Weekly Despite Overbought RSI Signals Caution
Curve (CRV) trades at $0.95 after explosive 79% weekly gains, but technical indicators suggest potential correction as CRV RSI hits overbought territory.
CRV Price Explodes 25% to $1.04 as Curve Breaks Key Resistance - Technical Targets in Focus
Curve DAO Token trades at $0.98 after surging 25% this week. CRV RSI hits overbought territory while bulls eye $1.08 resistance for potential 70% rally continuation.
Curve DAO (CRV) Surges 79% in One Week: Technical Breakout Signals Potential 70% Upside to $1.27
CRV rockets from $0.60 to $0.98 with massive 79% weekly gains. Technical breakout above descending resistance, rising TVL, and bullish momentum suggest continued upside potential.
Curve (CRV) Explodes 79% After Bullish Breakout - Is $1.27 Next Target for July 2025?
CRV surges 79% in 7 days breaking key resistance at $1, driven by short squeeze, U.S. policy optimism, and massive 103% volume spike to $860M. Technical analysis reveals potential 70% upside.
Curve DAO Token (CRV) Surges 25% Amid Bullish Breakout: Is $1.27 Next?
Curve DAO Token (CRV) has surged 25% this week, fueled by technical breakouts, reduced exchange supply, and U.S. policy optimism. Explore its price outlook and trading strategies.
Curve DAO Token (CRV) Targets $1 as Bullish Momentum Surges
Curve DAO Token (CRV) has surged 34% this week, fueled by strong bullish sentiment, increased trading volume, and technical breakout patterns. CRV eyes the $1 mark.
Curve DAO (CRV) Surges 34% Amid Bullish Momentum: Key Insights and Future Outlook
Curve DAO (CRV) is making headlines with a 34% weekly surge and a current price of $0.78. Explore its recent market developments, bullish technicals, and future price outlook.
Curve DAO Token (CRV) Surges 34%: Bullish Momentum, Key Drivers, and Future Outlook
Curve DAO Token (CRV) surged 34% this week as TVL growth, staking yields, and technical momentum drive bullish sentiment. Explore technical insights and price forecasts.
Curve DAO Token (CRV) Surges 34%: Key Updates, Technical Insights, and Future Outlook
Curve DAO Token (CRV) sees a remarkable 34% weekly price surge amid rising TVL, strong DAO performance, and positive investor sentiment. Is this momentum sustainable?
Curve DAO (CRV) Surges 15% Amid Positive TVL Growth and Yield Opportunities
Curve DAO (CRV) sees a 15.64% 24-hour price surge, supported by rising TVL, improved crvUSD borrowing, and high Ethereum-based yields. What's next for CRV?
Seizable Crypto Assets in 2025: Analyzing the Illicit Landscape
Explore the 2025 landscape of seizable crypto assets, revealing $15 billion held by illicit entities and $60 billion in downstream wallets, with insights into law enforcement strategies.
The Unstoppable Growth of Crypto Market
Nothing has stopped the cryptocurrency market to continue growing in recent years.
Will Crypto Recover? Experts Bet Market May Look Different
Choppiness in the crypto market is expected as investors are bracing for a year of rising interest rates.
Perpetual DEXs Surge 15% to Historic $70 Billion Daily Volume as Aster Dominates Market
Cryptocurrency Perpetual decentralized exchanges (DEXs) have shattered records with a historic $70 billion in daily trading volume on Thursday, marking a 15%...
Crypto Price Today: Bitcoin Tops $63,935.12, Nears to Break April’s ATH, Altcoins Rally in Low-Level Buying
Led by Bitcoin, most cryptocurrencies are seeing high-level buying. In recent weeks, there has been some sense of stability in the crypto spectrum.
Crypto Prices Today Bounce Back from Friday Sell-Off, Bitcoin, Ether, Solana, Polkadot, and others Surge Higher
Cryptocurrency markets have regained important values just a few days after China’s fresh crackdown. Some experts have explained the recent happenings in the market.
Crypto Price Today: Bulls Pull Bitcoin Above $57K, Ethereum Rises and Altcoin Market Loses Stream
In today’s market, Bitcoin surges further while most altcoins see the price decline. Some crypto analysts have explained the reasons behind such latest trends.
Crypto Price Today: Bitcoin, Ethereum, And Others Gain, Experts See October As Green for The Market
While September was a difficult month for the market, cryptocurrency prices, including Bitcoin, have renewed their performance since the beginning of October. Experts predict more upsides to be experienced in October.
APAC Law Enforcement Halts $47 Million in 'Pig Butchering' Scam Funds
In a significant crackdown, APAC authorities, with help from Chainalysis and major crypto firms, froze $47 million linked to 'pig butchering' scams.
VanEck's August 2024 Crypto Recap: Market Volatility and Regulatory Challenges
VanEck's August 2024 Crypto Recap highlights significant declines in Bitcoin, Ethereum, and Solana amid rising market volatility and regulatory challenges.
Glassnode's LPOC Metrics Enhance Understanding of Crypto Leverage Dynamics
Glassnode's new Leverage Position Openings and Closures (LPOC) metrics provide insights into crypto leverage trends by analyzing price and open interest, offering a comprehensive view of market dynamics.
LUNA Charts a Bullish Course as Crypto Markets Opens Monday With Gains
Amidst this re-awakening, here is an insight into what the coming week may hold for LUNA ahead of the likely protocol forking.
Arthur Hayes Discusses Crypto Market Turbulence, US Tax Season, Federal Reserve uncertainty and Bitcoin halving
Arthur Hayes, in the latest edition of Crypto Trader Digest, provides insights into the recent market volatility and its impact on the crypto industry. He discusses the factors contributing to the market fluctuations, including US tax season, the Bitcoin halving event, and the tapering of quantitative tightening by the Federal Reserve. Hayes also highlights the US Treasury's quarterly refunding announcement and the response of the monetary authorities to the failure of Republic First Bank.
Bitcoin Price on Verge of $20,000 amid Fed’s Interest Rates Announcement
Crypto prices drop are more likely as the Fed is set to announce interest rate hikes on Friday this week.
Bitcoin Price Holds Firm Around $19,000 Amid Institutional Adoption Surge
Institutional adoption appears to be a crucial driver for holding Bitcoin prices steady.
Bitcoin, Ether, And Other Crypto Prices Fall, But Experts Optimise Rebound on Horizon
Despite the current bearish week, experts identify potential cryptocurrencies that could still perform the rest of September and enable investors to earn money.
Crypto Market Analysis: BTC, ETH, DOT, LINK, ATOM Price Charts Show Bullish Signs
Bitcoin, Ethereum, Polkadot, Cosmos Network, and Chainlink prices indicate new signs of bullishness. Top crypto traders and analysts show where they see the biggest opportunities in the crypto market in the next few days.
Bitcoin, Ethereum, Solana And Other Crypto Prices Further Plunge Following China’s Fresh Crypto Ban
Cryptocurrency markets have experienced other crashes on Friday amid China’s Central bank renewed ban on cryptocurrency transactions.
Experts Suggest Merely Tokens Might Survive after LUNA's Collapse
Major market players have explained the key to the future of cryptocurrencies. However, some of them suggest only merely tokens might survive after LUNA's event , taking reference to the bubble outbreak of Dot-Com's collapse.
53% of the Top 100 Cryptocurrencies are Trading Below Their 200-Day Moving Average
Due to massive liquidations experienced nearly two weeks ago, 53% of the top 100 cryptocurrencies have not fully recovered because they are still trading below their 200-day moving average.
Almost $98 Billion Evaporated in the Crypto Space Triggered by a Big Sell-Off in the Global Stock Market
About $98 billion has been evaporated in the crypto market as Bitcoin sinks below $30K for the second time since mid-May.
Top Crypto Assets are in Fear Trajectory, Could this Signal a Bounce?
The crypto market continues to be in the red based on more liquidation. As a result, the leading cryptocurrencies are in the fear zone.
Crypto Controls Needed in Lending Sector to Stem Depression, Expert Says
For depression and crashes to be averted in the crypto market, regulation and capital controls are needed to supervise fast-growing trading platforms, according to a quantitative risk modeller.
$2.3 Billion Liquidated on Crypto Exchanges as Bitcoin Price Crashes By $5.4k In Minutes
According to Glassnode blockchain analytics, the crypto sector lost around $110 billion in marketcap because after $2.3 billion in crypto was sold off, crashing BTC by $5,000.
Cryptocurrency Market Remains Steady as Traders Anticipate U.S. CPI Data
Major cryptocurrencies like Bitcoin and Ethereum remain stable as traders await U.S. CPI data. The global crypto market cap sees slight fluctuations.
Crypto Market Faces Downturn as Major Assets Decline
The global cryptocurrency market sees a decline, with major assets such as Bitcoin (BTC) and Ethereum (ETH) trading lower. Key factors influencing the market's performance are explored.
Binance Coin (BNB) and Tron (TRX) Defy Market Trends with Gains
Despite a challenging week for the crypto market, Binance Coin (BNB) and Tron (TRX) managed to stay in the green, showcasing resilience amid widespread declines.
Ethereum (ETH) to Bitcoin (BTC) Ratio Stays Below 0.05 for Over a Year
The ETH/BTC ratio has remained under 0.05 for 14 consecutive months, highlighting a potential shift in market dynamics driven by Bitcoin's resilience and altcoin trends.
Fundraising by Crypto Companies Accounts for $8.2B in Q3
A study says that as cryptocurrencies continue gaining steam, crypto companies raised capital worth $8.2 billion in the third quarter of 2021.
Study Reveals Similar Drivers for Crypto and Traditional Asset Prices
New research highlights how traditional financial factors like U.S. monetary policy impact crypto prices, showing similarities between digital and traditional assets.
Analyzing Market Extremes with Cost Basis Distribution
Explore how Cost Basis Distribution (CBD) helps identify market tops and bottoms by analyzing profit-driven and loss-driven spending patterns, providing insights into market psychology.
Enthusiasm to Sell in the Crypto Market Subsided amid Prices Stabilize
The urge to sell in the cryptocurrency market has dwindled based on the surge of leading coins, according to on-chain insight provider Santiment.
Crypto Gets Resilience in the Past Month as Forced Selling Exit
The exodus of forced selling made cryptocurrencies partly resilient in the last month, according to Galaxy Digital Holdings founder Mike Novogratz.
Money Laundering in Cryptocurrency: Trends and Detection Techniques
Chainalysis highlights emerging trends and innovative techniques for detecting and investigating money laundering in the cryptocurrency ecosystem.
Understanding Volume and OBV: A Guide to Smart Money Tracking in Crypto
Explore the significance of Volume and On-Balance Volume (OBV) indicators in identifying institutional money flow in cryptocurrency markets, as discussed in Bitfinex's Chart Decoder Series.
Bitcoin, Ether and Other Top Cryptos See Minor Market Recovery
Top cryptocurrencies have made some slight new highs in the midst of the market crash.
IntelBroker Arrest Highlights Bitcoin's Role in Cybercrime Bust
The takedown of BreachForum's IntelBroker showcases the pivotal role of cryptocurrency analysis in dismantling cybercrime networks. Learn how blockchain analytics aided in the arrest.
Aster leads perp DEX surge to $70B daily trading volume
Aster Leads Perpetual DEX Surge to $70 Billion Daily Trading Volume In a remarkable development within the decentralized finance (DeFi) sector, perpetual decentralized exchanges (perp DEXs) have...
DOGE Price Prediction: Targeting $0.16-$0.18 Recovery Within 2 Weeks as Technical Indicators Signal Oversold Bounce
DOGE price prediction suggests a near-term recovery to $0.16-$0.18 range as RSI neutrality and bullish MACD histogram indicate oversold conditions may reverse.
DOGE Price Prediction: $0.16-$0.18 Target in 7-10 Days as Technical Indicators Signal Recovery
DOGE price prediction shows potential 7-13% upside to $0.16-$0.18 range as RSI neutrality and bullish MACD histogram suggest oversold bounce from current $0.15 level.
DOGE Price Prediction: Targeting $0.16-$0.18 Recovery Within 7-10 Days
DOGE price prediction points to potential 14-28% upside to $0.16-$0.18 range as technical indicators show early bullish momentum despite recent weakness.
DOGE Price Prediction: Dogecoin Eyes $0.21 Recovery Despite Bearish Headwinds - December 2025 Forecast
DOGE price prediction suggests potential recovery to $0.21 resistance level within 2-4 weeks, though bears maintain control below key $0.50 breakout zone.
DOGE Price Prediction: Dogecoin Targets $0.17-$0.22 as Technical Indicators Signal Potential 25-57% Rally
Latest DOGE price prediction shows Dogecoin poised for a breakout above $0.165 resistance, with technical analysis pointing to $0.17-$0.22 targets within 2-4 weeks.
DOGE Price Prediction: Targeting $0.22-$0.25 Within 4-6 Weeks as Key Breakout Patterns Emerge
DOGE price prediction suggests potential 47-67% upside to $0.22-$0.25 range if critical $0.165 resistance breaks, supported by falling wedge pattern and improving MACD momentum.
DOGE Price Prediction: Targeting $0.21-$0.25 by January 2025 as Technical Indicators Signal Cautious Recovery
DOGE price prediction suggests a potential 40-67% rally to $0.21-$0.25 range within 4-6 weeks if key resistance at $0.17 breaks with volume confirmation.
DOGE Price Prediction: Targeting $0.22 Recovery by Year-End 2025 Amid Technical Oversold Bounce
DOGE price prediction shows potential 57% upside to $0.22 target as technical indicators signal oversold bounce from $0.14 support level with bullish MACD divergence emerging.
DOGE Price Prediction: Targeting $0.22-$0.25 Recovery After Technical Bounce from $0.14 Support
DOGE price prediction suggests potential 57-79% upside to $0.22-$0.25 range within 4-6 weeks as technical indicators signal oversold bounce from critical support levels.
DOGE Tests $0.15 Support as Crypto Regulatory Scrutiny Weighs on Meme Coin Sentiment
Dogecoin trades at $0.15 amid regulatory headwinds from House committee report targeting Trump's crypto policies, testing key technical support levels.
DOGE Price Prediction: Targeting $0.20 Breakout Within 2 Weeks as Technical Setup Improves
DOGE price prediction shows potential rally to $0.20 target as technical indicators suggest early trend reversal from current $0.15 support zone.
DOGE Price Prediction: Dogecoin Eyes $0.19 Breakout Target Within 2 Weeks Despite Current Consolidation
DOGE price prediction suggests a potential move to $0.19 resistance within two weeks, though risk remains if $0.13 support fails. Current technical setup shows mixed signals.
First U.S. Spot Dogecoin ETF Debuts as Whale Accumulation Drives DOGE Above $0.15
Dogecoin trades at $0.15 following the launch of America's first spot DOGE ETF and massive whale accumulation totaling $153 million in recent days.
DOGE Price Consolidates Near $0.15 as Weak Bullish Momentum Emerges Amid Light Trading
Dogecoin trades at $0.15 with modest 1.07% gains as technical indicators show early signs of bullish momentum despite trading below key moving averages in absence of major catalysts.
DOGE Price Prediction: Dogecoin Eyes $0.165 Recovery Within 7 Days as Technical Indicators Signal Oversold Bounce
DOGE price prediction shows potential 10% upside to $0.165 short-term as RSI neutral zone and bullish MACD histogram suggest recovery from current oversold levels.
DOGE Price Prediction: Recovery to $0.165-$0.175 Expected by December 2025 Despite Current Oversold Conditions
DOGE price prediction targets $0.165-$0.175 recovery by December 2025 as RSI at 31.17 signals oversold bounce potential from current $0.14 support level.
Dogecoin Drops to $0.14 as Bitcoin Selloff Triggers $700M DOGE Whale Exit
DOGE price falls 5.9% to $0.14 amid Bitcoin's retreat below $90,000, with massive whale outflows of $700 million intensifying selling pressure across the meme coin sector.
DOGE Price Prediction: Testing Critical $0.15 Support Before Potential Rally to $0.20 Target
DOGE faces crucial test at $0.15 support after 10.86% decline. Technical analysis suggests potential bounce to $0.20 if support holds, downside risk to $0.13.
DOGE Consolidates Near $0.16 as Bitcoin Recovery Fails to Lift Meme Coin Market
Dogecoin trades at $0.16 with modest 1% gains as technical indicators suggest weakening momentum despite broader crypto market attempting recovery from recent selloff.
DOGE Price Prediction: Targeting $0.165-$0.175 Range by December 2025 Amid Technical Recovery
DOGE price prediction shows potential recovery to $0.165-$0.175 by December 2025 as technical indicators suggest oversold bounce from current $0.16 levels.
Dogecoin Rebounds 4.3% as Bitcoin Recovers, Testing Key $0.16 Resistance Level
DOGE price climbs to $0.16 amid Bitcoin's recovery from sub-$100k levels, while whale accumulation of 4.72 billion tokens suggests potential upside despite recent volatility.
DOGE Price Prediction: Targeting $0.13-0.15 Range as Bears Take Control Through December 2025
DOGE price prediction shows bearish momentum targeting $0.13-0.15 support zone over next 4 weeks, with critical resistance at $0.19 capping upside potential.
Dogecoin Tests Critical $0.16 Support as Meme Coin Rally Fades After Trump Comments
DOGE price retreats to $0.16 support level following last week's 5.2% surge driven by speculative asset interest after Trump's tariff comments, with technical indicators showing bearish momentum.
DOGE Price Prediction: Dogecoin Eyes $0.185-$0.25 Recovery Despite Current Weakness
DOGE price prediction suggests a potential 15-56% upside to $0.185-$0.25 over the next month, but must first reclaim $0.17 resistance to confirm bullish momentum.
Dogecoin Futures Hit 2.16 Billion DOGE as Whale Accumulation Counters 6% Weekly Decline
DOGE price trades at $0.16 following mixed signals as massive futures activity and whale buying of 4.72 billion tokens offset broader market weakness and technical breakdown below key support le...
DOGE Price Prediction: Target $0.40-$0.70 by Q1 2026 After Breaking $0.21 Resistance
DOGE price prediction suggests potential 150-350% gains to $0.40-$0.70 range by Q1 2026, but must first break critical $0.21 resistance amid current consolidation.
DOGE Price Prediction: Targeting $0.182 Recovery Within 7 Days as Technical Setup Improves
Dogecoin shows bullish momentum signals with MACD histogram turning positive, targeting $0.182 near-term as analysts align on modest recovery ahead.
Dogecoin Tests Weekly EMA Support as Bears Drive 5% Slide to $0.17
DOGE price fell 5.5% to $0.1730 during European trading as bears broke critical $0.1720 support on heavy volume, testing weekly exponential moving average levels amid broader crypto weakness.
DOGE Price Prediction: Targeting $0.21-$0.23 Range as Technical Indicators Signal Bullish Momentum Building
DOGE price prediction points to $0.21-$0.23 targets over next 4-6 weeks as MACD histogram turns positive and key resistance levels await breakout attempts.
DOGE Rallies 6% to $0.18 Following Trump's $2K Stimulus Proposal Amid ETF Filing Buzz
Dogecoin surged to $0.18 after President Trump's stimulus comments sparked speculative asset buying, while Bitwise's ETF filing adds institutional legitimacy to DOGE markets.
Dogecoin Rebounds 2.8% to $0.18 as Technical Indicators Signal Potential Bottom Formation
DOGE price recovers to $0.18 with 2.8% gains as MACD shows early bullish divergence, though key resistance at $0.21 remains the critical test for sustained recovery momentum.
DOGE Price Prediction: Targeting $0.21-$0.25 in November 2025 Despite Mixed Analyst Views
DOGE price prediction shows potential 24-47% upside to $0.21-$0.25 range despite current weakness, with key resistance at $0.21 acting as critical breakout level.
DOGE Price Prediction: Targeting $0.23 by Late November 2025 Amid Technical Recovery
DOGE price prediction shows bullish momentum building with $0.21 immediate target and $0.23 by month-end as technical indicators align for potential breakout from current consolidation.
DOGE Price Prediction: Targeting $0.21 Resistance Break Within 2 Weeks
DOGE price prediction shows potential for 17% upside to $0.21 resistance if current momentum sustains, with Dogecoin forecast indicating neutral RSI providing room for growth.
Dogecoin Falls to $0.16 as Death Cross Pattern Triggers Technical Selloff
DOGE price drops 1.6% to $0.16 following yesterday's sharp decline amid broader crypto market weakness and bearish technical signals emerging across multiple timeframes.
DOGE Price Prediction: Targeting $0.21 Resistance Before Potential Rally to $0.25
Dogecoin shows oversold signals at $0.16 with immediate target of $0.21 resistance. Technical analysis suggests potential 56% upside to $0.25 within 4-6 weeks.
DOGE Price Prediction: $0.18-$0.26 Target Range as Dogecoin Tests Critical Support
DOGE price prediction points to $0.18 retest with potential bounce to $0.26. Technical analysis shows oversold conditions creating buying opportunity near current levels.
DOGE Tests $0.18 Support as Fed Rate Cut Uncertainty Triggers 8% Weekly Decline
Dogecoin trades at $0.18 after Fed Chair Powell's hawkish comments sparked broader crypto selloff, with DOGE price testing critical support amid $2B volume surge.
DOGE Price Prediction: Targeting $0.22-$0.24 Breakout Within 2 Weeks
DOGE price prediction points to $0.22-$0.24 upside potential as technical indicators show early bullish momentum despite neutral RSI at 40.80.
DOGE Consolidates at $0.19 as Bitcoin Volatility Weighs on Meme Coin Sector
Dogecoin holds steady at $0.19 following Tuesday's 3% decline amid FOMC-driven market turbulence, while institutional futures activity shows growing long positioning despite broader crypto weakn...
DOGE Price Prediction: Targeting $0.22-$0.24 Range in Next 2 Weeks as Technical Momentum Builds
DOGE price prediction shows bullish momentum emerging with $0.22-$0.24 targets over 2 weeks. Current technical setup suggests 16-26% upside potential from $0.19 levels.
DOGE Price Rebounds 3.4% to $0.19 as Bulls Test Resistance After Mid-Week Selloff
Dogecoin recovers from Tuesday's 3% decline with modest gains to $0.19, testing key technical resistance as traders assess next directional move amid broader crypto volatility.
DOGE Price Prediction: Target $0.22 by November as Technical Indicators Signal Potential 16% Rally
DOGE price prediction shows bullish momentum building with MACD histogram turning positive. Dogecoin forecast targets $0.22 resistance break for November rally.
DOGE Price Prediction: Dogecoin Eyes $0.19 Target Amid Technical Consolidation Through November 2025
DOGE price prediction points to $0.19 short-term target as Dogecoin consolidates below $0.21 resistance, with analyst forecasts suggesting bearish momentum ahead.
DOGE Price Prediction: Targeting $0.265 by October 30th with Potential Rally to $0.31
Latest DOGE price prediction targets $0.265 by month-end, with technical analysis suggesting a potential breakout above $0.27 resistance could drive Dogecoin to $0.31.
DOGE Price Tests $0.19 Support as Technical Indicators Signal Consolidation Phase
Dogecoin trades at $0.19 after 1.2% decline, with technical analysis revealing mixed signals as the meme coin consolidates below key moving averages in quiet market conditions.
DOGE Price Prediction: Targeting $0.24-$0.27 Range by November with Breakout Potential
DOGE price prediction shows potential rally to $0.24-$0.27 by early November 2025, with analysts targeting $0.248 amid neutral RSI and Bollinger Band positioning.
DOGE Price Tests $0.19 Support as Technical Indicators Signal Neutral Territory
Dogecoin trades at $0.19 following a 2.7% decline, with RSI at 40.78 indicating neutral momentum as traders watch key support levels in absence of major catalysts.
Dogecoin Rebounds 7% to $0.20 Despite Technical Warning of Potential $0.16 Decline
DOGE price recovers to $0.20 with 7.1% daily gains as traders weigh technical analysis suggesting further downside risk if $0.18 support fails to hold in coming sessions.
Microsoft's DOGE Payment Integration Drives Muted Response as Price Hovers Near $0.19
Dogecoin trades at $0.19 following Microsoft's payment acceptance announcement, but technical indicators suggest limited momentum despite the major adoption milestone.
DOGE Tests Critical Support as Bearish Momentum Builds Below $0.20 Level
Dogecoin trades at $0.18 after 2.7% decline, approaching Bollinger Band lower support as technical indicators signal continued weakness ahead.
DOGE Technical Setup: Neutral Momentum Above Key Moving Averages with $0.27 Resistance Test Ahead
Dogecoin trades at $0.25 with minimal 24-hour movement, positioned above all major moving averages while approaching critical resistance at $0.27 in a consolidation phase.
Dogecoin Holds Above Key Moving Averages as DOGE Tests Neutral Territory at $0.25
DOGE trades at $0.25 with modest 1.09% daily gains, positioning above all major moving averages while RSI sits in neutral territory, setting up potential breakout scenarios.
DOGE Price Watch: Technical Consolidation Presents Measured Risk Entry at $0.25
Dogecoin trades at $0.25 after a 4.66% decline, holding above key moving averages while neutral RSI suggests consolidation phase may offer strategic entry opportunities.
DOGE Price Watch: Bullish Setup Above Key Moving Averages Targets $0.29 Resistance
Dogecoin trades at $0.26 with 2.79% daily gains, positioning above all major moving averages as technical indicators signal potential continuation toward $0.29 resistance.
DOGE Analysis: Technical Breakout Setup as Price Holds Above Key Moving Averages
Dogecoin trades at $0.26 with bullish momentum building above critical support levels. DOGE shows strong relative strength against major moving averages.
Dogecoin Consolidates Above Key Support as Bulls Eye 30-Cent Resistance Level
DOGE trades at $0.26 with modest 1.57% gains as technical indicators suggest potential breakout above moving averages toward next resistance zone.
Dogecoin Holds Above 200-Day Average Despite Mixed Technical Signals at $0.23
EXCERPT: DOGE trades at $0.23 with minimal movement as whales accumulate 158 million tokens while technical indicators show conflicting signals near key support levels.
DOGE Consolidates Near Key Support as Whale Accumulation Signals Potential Reversal
Dogecoin trades at $0.23 amid neutral momentum, with whales accumulating 158 million DOGE in September while technical indicators suggest consolidation phase.
DOGE Trading Update: Dogecoin Shows Resilience After Week of Market Turbulence
DOGE price recovers to $0.23 (+1.44%) following last week's 10.97% plunge, with technical indicators suggesting cautious optimism amid ongoing volatility.
DOGE Price Hovers Near Support at $0.23 as Technical Indicators Signal Mixed Outlook
Dogecoin trades at $0.23 with bearish momentum building as DOGE RSI sits in neutral territory while price approaches critical support levels.
DOGE Price Under Pressure Despite Whale Accumulation - Technical Analysis Shows Mixed Signals
Dogecoin trades at $0.23 (-3.25% daily) as whales accumulated 158M DOGE in September, but bearish momentum indicators suggest caution for traders.
DOGE Price Struggles Despite ETF Launch as Technical Indicators Signal Mixed Momentum
Dogecoin trades at $0.23 (-1.77%) as new ETF launch fails to provide immediate price boost while whale accumulation suggests underlying strength for DOGE.
Dogecoin (DOGE) Shows Mixed Signals as Whales Accumulate 158M Tokens Despite Technical Resistance
DOGE trades at $0.24 (+0.96% daily) as millionaire investors accumulate heavily, but technical indicators suggest potential downside to $0.21 support.
DOGE Price Drops 10.86% Despite Whale Accumulation of 158 Million Tokens
Dogecoin trades at $0.24 after sharp decline, but millionaire investors add 158M DOGE showing confidence amid technical bearish signals.
Dogecoin Surges as Whales Accumulate 158M DOGE - Technical Breakout Eyes $0.30
DOGE trades at $0.27 (+1.01% daily) following massive whale accumulation and technical breakout above key resistance, with analysts targeting $0.30 next.
Dogecoin (DOGE) Holds Above $0.27 Despite 3.3% Daily Decline - Bulls Still in Control
DOGE price trades at $0.27 after a 3.3% pullback, but technical indicators suggest the broader bullish trend remains intact with strong momentum signals emerging.
DOGE Price Shows Bullish Momentum Despite Minor Correction at $0.28
Dogecoin trades at $0.28 with strong technical indicators suggesting upward momentum, despite a 1.03% daily decline in volatile crypto markets.
Dogecoin (DOGE) Surges to $0.28 as First ETF Approval Ignites Bull Run
DOGE price jumps 5.12% to $0.28 following SEC's historic approval of the first Dogecoin ETF, with technical indicators showing strong bullish momentum.
Dogecoin (DOGE) Faces Critical Resistance at $0.29 After Corporate Adoption Surge
DOGE trades at $0.27 (+0.33%) but encounters key resistance near $0.29. CleanCore's $68M purchase and ETF launch boost sentiment amid technical challenges.
Dogecoin ETF Launch Pushes DOGE Price Toward $0.31 Resistance
DOGE trades at $0.26 despite -0.32% daily decline as REX-Osprey Dogecoin ETF launch creates bullish momentum with strong institutional interest driving volumes.
DOGE Price Drops 10% Despite Bullish Technical Momentum - Can $0.26 Support Hold?
Dogecoin trades at $0.26 after a sharp 10% decline, but technical indicators suggest underlying bullish momentum remains intact with DOGE RSI holding neutral territory.
Dogecoin (DOGE) Surges Above $0.29 Despite Overbought RSI Signals
DOGE trades at $0.29 with 74.77 RSI showing overbought conditions as whale accumulation and $0.25 target breach drive momentum despite bearish market sentiment.
Dogecoin (DOGE) Soars 10% Breaking Key Resistance - Eyes $0.30 Target
DOGE price surges to $0.29 after breaking trendline resistance with strong bullish momentum. Technical indicators show overbought conditions as traders target $0.30.
DOGE Price Surges 3.49% to $0.26 as Bullish Momentum Builds
Dogecoin trades at $0.26 with strong bullish signals as DOGE RSI hits 66.49 and technical indicators point to continued upward momentum following recent institutional activity.
Dogecoin Price Surges Past $0.24 as DOGE Bulls Target Cup-and-Handle Breakout
DOGE trades at $0.24 (+0.53% daily) as technical patterns suggest potential rally toward $0.30, with strong momentum indicators supporting bullish outlook.
DOGE Price Surges 3.69% as Dogecoin Technical Analysis Shows Strong Bullish Momentum
Dogecoin trades at $0.24 with bullish MACD signals and RSI at 60. Technical indicators suggest potential breakout above key resistance levels.
Dogecoin (DOGE) Surges 7% as ETF Filing and Treasury Adoption Fuel Bullish Momentum
DOGE price jumps to $0.23 with 7% daily gains as REX-Osprey files for Dogecoin ETF and $175M treasury initiative signals growing institutional adoption momentum.
Dogecoin (DOGE) Tests $0.22 Pivot as Cup-and-Handle Pattern Eyes $0.30 Target
DOGE price holds steady at $0.22 (+1.50% daily) as technical patterns suggest potential 36% rally while institutional accumulation provides underlying support.
Dogecoin (DOGE) Tests $0.21 Support as September Rally Potential Builds
DOGE price holds crucial $0.21 support level despite 1.25% daily decline, with technical patterns suggesting potential breakout toward $0.30 target.
Dogecoin (DOGE) Price Holds Critical $0.21 Support as Technical Patterns Signal Potential $2 Rally
DOGE trades at $0.21 with analysts eyeing 850% rally potential to $2. Cup-and-handle pattern emerges after successful defense of key support level.
Dogecoin (DOGE) Consolidates at $0.22 as Technical Patterns Point to Potential $0.30 Breakout
DOGE trades at $0.22 with neutral momentum as cup-and-handle pattern emerges, offering bullish outlook despite recent whale selling pressure.
** Dogecoin (DOGE) Rebounds From $0.21 Support: Cup-and-Handle Pattern Eyes $0.30 Target
** DOGE price holds steady at $0.22 (+1.58% in 24h) as whale activity subsides and technical patterns suggest potential breakout above key resistance levels.
Dogecoin (DOGE) Tests $0.21 Support as Cup-and-Handle Pattern Eyes $0.30 Target
DOGE trades at $0.21 after a 1.93% decline, but technical patterns and 680M DOGE institutional accumulation suggest potential upside to $0.30 remains intact.
Dogecoin (DOGE) Tests $0.21 Support as Cup-and-Handle Pattern Targets $0.30
DOGE price trades at $0.21 after 4% decline, but technical patterns suggest potential breakout to $0.30 amid strong institutional accumulation of 680M tokens.
Dogecoin (DOGE) Rebounds From $0.21 Support as Cup-and-Handle Pattern Targets $0.30
DOGE price currently at $0.22 (+0.91% in 24h) showing recovery from key support level with technical patterns suggesting potential breakout to $0.30
Dogecoin Price Struggles at $0.22 as DOGE Technical Indicators Flash Mixed Signals
DOGE trades at $0.22 with neutral RSI at 47.23 amid institutional selling pressure. Recent whale accumulation conflicts with bearish momentum indicators.
Dogecoin (DOGE) Faces Bearish Pressure Despite Recent Whale Accumulation
DOGE trades at $0.21 after a 4.01% decline, testing key support levels while technical indicators signal mixed momentum ahead of potential September breakout.
Dogecoin Price Flashes TD Sequential Buy Signal as DOGE Eyes $0.25 Breakout
DOGE price trades at $0.22 with technical indicators suggesting potential reversal after whale-driven volatility. Cup-and-handle pattern targets $0.82.
DOGE Price Faces Security Concerns as 51% Attack Threat Emerges
Dogecoin trades at $0.22 (-5.11%) as Qubic community plans 51% attack, overshadowing recent whale accumulation and altcoin rally gains.
Dogecoin Price Tests $0.23 Support as Whale Activity Triggers Mixed Signals
DOGE trades at $0.23 (-0.13% in 24h) while whale accumulation creates conflicting technical signals. Golden cross formation battles recent bearish pressure.
Dogecoin (DOGE) Drops 9% Despite Massive Whale Accumulation - Technical Analysis Shows Mixed Signals
DOGE trades at $0.23 after sharp declines from inflation data, but whale accumulation of 2B+ coins suggests institutional confidence remains strong.
Dogecoin (DOGE) Faces 9% Correction Despite Strong Bullish Momentum From Musk's X Payment Hints
DOGE trades at $0.22 after a 9% daily decline, testing key support levels while maintaining strong weekly gains of 25.5% driven by whale accumulation and adoption news.
** DOGE Surges 6.6% as Bull Flag Breakout Targets $0.30 Resistance
** Dogecoin trades at $0.25 (+6.6%) following institutional accumulation and technical breakout signals pointing toward 30-cent resistance zone.
Dogecoin (DOGE) Rebounds 6% After Whale Selloff Creates Buying Opportunity
DOGE trades at $0.24 (+5.90%) as technical indicators turn bullish following recent whale-driven volatility that tested key support levels.
DOGE Price Drops 5.6% Despite Recent Rally - Critical Support Test at $0.19
Dogecoin trades at $0.23 after a 5.58% decline, testing key support levels while technical indicators show mixed signals for DOGE's next move.
Dogecoin Price Surges Past $0.23 as DOGE Whale Activity and Musk Integration Hints Drive Rally
DOGE trades at $0.23 (+0.91%) as whale accumulation and Elon Musk's X platform payment hints fuel bullish momentum, with technical indicators signaling potential breakout.
Dogecoin (DOGE) Surges to $0.24 Following Elon Musk's X Payment Integration Hints
Dogecoin trades at $0.24 (+0.17% daily) after Musk's X platform payment hint sparked 8% rally, with technical indicators showing bullish momentum continuation.
Dogecoin Surges 4% as DOGE Price Breaks Above $0.23 Following Whale Accumulation
DOGE trades at $0.23 after 3.97% daily gains, with whale buying driving institutional interest and technical indicators showing bullish momentum above key resistance.
DOGE Price Surges 8% to $0.22 Despite Recent Bearish Signals
Dogecoin rebounds to $0.22 with 8.12% daily gains, testing key resistance as technical indicators show mixed signals following last week's death cross pattern.
DOGE Price Holds $0.20 Support Despite Mixed Technical Signals
Dogecoin trades at $0.20 with 2.98% daily gains, but technical indicators show conflicting signals as DOGE RSI remains neutral at 46.18 amid bearish MACD momentum.
Dogecoin (DOGE) Drops to $0.20 as Institutional Accumulation Signals Mixed Market Sentiment
DOGE trades at $0.20 (-2.86% in 24h) amid institutional buying during recent selloff, with technical indicators showing oversold conditions near key support levels.
Dogecoin (DOGE) Hovers at Critical $0.20 Support as Institutional Buying Emerges
DOGE trades at $0.20 after 8% correction, but institutional accumulation of 310M tokens during the dip suggests smart money confidence in current levels.
DOGE Price Drops 8% to $0.21 as Institutional Accumulation Signals Potential Bottom
Dogecoin fell 8% to $0.21 amid market volatility, but institutional wallets accumulated 310 million DOGE during the selloff, suggesting potential price floor formation.
Dogecoin (DOGE) Shows Recovery Signs at $0.22 After Volatile Week
Dogecoin trades at $0.22 with neutral momentum indicators as bulls attempt recovery following recent 11% selloff and institutional exit pressure.
Dogecoin (DOGE) Struggles at $0.22 After 11% Weekly Plunge Triggers Technical Reset
DOGE trades at $0.22 following institutional sell-offs and broader crypto weakness, with key support at $0.19 now critical for bulls to defend.
DOGE Price Drops 7.3% Despite Strong Bullish Trend - Key Support at $0.18 in Focus
Dogecoin trades at $0.23 after a 7.3% decline, but technical indicators suggest the overall bullish trend remains intact with neutral RSI providing potential buying opportunities.
Dogecoin (DOGE) Retreats to $0.23 After Breaking Key Resistance - Technical Signals Flash Mixed
DOGE trades at $0.23 (-3.89% daily) after volatile week saw institutional ETF optimism drive 77% monthly gains before recent correction pulled price below $0.25 resistance.
Dogecoin (DOGE) Recovers to $0.24 as Bulls Fight Back After Recent Volatility
DOGE price stabilizes at $0.24 with a modest 0.37% gain, showing resilience after dropping to $0.23 earlier this week despite July's impressive 77% rally.
Dogecoin (DOGE) Rebounds 3.6% After Sharp Selloff - Technical Analysis Points to Recovery
DOGE price recovers to $0.24 with 3.6% daily gains following this week's institutional selloff. Technical indicators suggest potential bullish momentum amid oversold conditions.
Dogecoin (DOGE) Plunges 7% Despite Institutional Interest as Volatility Surges
DOGE trades at $0.23 after sharp selloff, down 7.15% in 24h. Mixed signals emerge as institutional buying clashes with heavy profit-taking pressure.
Dogecoin (DOGE) Tests $0.24 Support After Sharp Pullback From Weekly Highs
DOGE trades at $0.24 (-2.73% daily) after hitting $0.25 resistance. Strong whale accumulation and $3.78B futures interest suggest bullish continuation potential.
Dogecoin Surges to $0.27 as Technical Breakout Triggers 14% Rally
DOGE price jumps 8.27% to $0.27 after breaking key resistance, with RSI hitting overbought levels and massive volume spike signaling continued bullish momentum.
Dogecoin Surges to $0.25 as Futures Open Interest Hits $3.78 Billion - Technical Analysis Shows Strong Bullish Momentum
DOGE rallies 4.07% to $0.25 with record futures activity and whale rotation from XRP driving institutional interest. RSI at 81 signals overbought conditions.
Dogecoin Surges to $0.25 as Whale Activity and Technical Breakouts Signal Strong Bullish Momentum
DOGE hits $0.25 with 7.83% daily gains as whale-driven rallies and technical indicators point to continued upside potential despite overbought conditions.
Dogecoin Surges Amid Whale Activity: A Comprehensive Market Analysis and Price Outlook
Dogecoin (DOGE) has soared past $0.23, fueled by whale activity and institutional interest. With a strong bullish trend and key resistance at $0.24, what lies ahead for DOGE?
Dogecoin (DOGE) Surges Amid Supply Shock and Institutional Interest: What’s Next?
Dogecoin rises 5% this week, driven by scarcity and institutional interest. Amid technical upgrades and market volatility, explore DOGE’s bullish momentum and future outlook.
Dogecoin (DOGE) Surges Amid Institutional Interest, Adoption, and Technical Upgrades
Dogecoin gains momentum with a 4.27% weekly surge, bolstered by institutional accumulation, faster transactions, and e-commerce adoption, despite regulatory uncertainty.
Dogecoin (DOGE) Gains Momentum: Institutional Interest, Technical Upgrades, and Adoption Drive Bullish Sentiment
Dogecoin rallies with a 4.27% surge amid institutional inflows, ETF speculation, and improved adoption. Technical upgrades and bullish momentum point to potential growth.
Dogecoin's Bullish Surge: Institutional Interest, ETF Speculation, and Growing Adoption Propel DOGE Forward
Dogecoin (DOGE) gains 4.27% in 24 hours, trading at $0.21. Institutional inflows, ETF speculation, and adoption drive market optimism, but regulatory uncertainty lingers.
Dogecoin (DOGE): ETF Delays, Institutional Adoption, and Bullish Momentum Highlight Recent Developments
Dogecoin's price surged amid institutional interest and market optimism, despite ETF delays. Explore recent developments, technical analysis, and price predictions for July 2025.
Dogecoin Price Surges Amid Bullish Momentum: Key Technical Insights and Future Outlook
Dogecoin (DOGE) breaks critical resistance at $0.21, fueled by Elon Musk's political announcement and bullish market sentiment. Can it hit $1 by the end of 2025?
Dogecoin (DOGE) Poised for Breakout as Accumulation Intensifies at $0.18
Dogecoin consolidates above $0.18, hinting at a breakout to $0.26. Accumulation strengthens as investors eye potential gains.
Dogecoin Becomes The 8th Largest Cryptocurrency, Overtaking Cardano
Dogecoin overtook Cardano to become the world’s 8th most valuable crypto asset by market cap at $17.9 billion
Dogwifhat (WIF) Faces Potential Downside Risk Amid Declining Volume
Dogwifhat (WIF) struggles to maintain its $0.48 support as diminishing trading volume raises concerns of a possible downside risk. Analysts emphasize the need for increased demand.
Polkadot Slides 3.2% as Crypto Treasury Bubble Threatens 2025 Market Stability
Polkadot (DOT) fell 3.2% to $3.92 in the past 24 hours as growing concerns over crypto treasury companies spark comparisons to the dotcom bubble, triggering ...
DOT Price Prediction: Polkadot Eyes $2.40-$2.60 Recovery Within 2-3 Weeks
DOT price prediction suggests recovery to $2.40-$2.60 range as bullish MACD histogram and oversold conditions signal potential 20-30% upside from current $1.99 levels.
DOT Price Prediction: Targeting $2.40-$2.60 Recovery Within 2-4 Weeks as Technical Momentum Builds
DOT price prediction suggests upside to $2.40-$2.60 range over next month as MACD shows bullish divergence and RSI remains neutral, though key resistance at $2.59 must break.
DOT Price Prediction: Targeting $2.75-$3.30 Recovery Rally Within 4-6 Weeks
DOT price prediction suggests potential 31-57% upside to $2.75-$3.30 range as oversold conditions and bullish MACD divergence signal medium-term recovery despite near-term weakness.
DOT Price Prediction: Targeting $2.05-$2.30 Range Despite Recent 4% Surge - December 2025 Forecast
DOT price prediction shows consolidation between $2.05-$2.30 despite today's 4.12% gain. Technical analysis suggests limited upside potential with bearish medium-term outlook.
DOT Price Prediction: Recovery Rally to $2.75-$3.30 Expected by January 2026
Technical analysis suggests DOT could bounce from current oversold levels to test $2.75-$3.30 resistance zone within 4-6 weeks, with critical support holding at $1.96.
DOT Price Prediction: Targeting $2.75-$3.30 Recovery Within 6 Weeks Despite Recent Bearish Breakdown
DOT price prediction shows potential recovery to $2.75-$3.30 range after breaking critical $2.05 support, with technical indicators suggesting oversold bounce ahead.
DOT Price Prediction: Recovery Rally to $2.89-$3.30 Expected Within 30 Days
Polkadot technical analysis suggests DOT could rally 26-44% to $2.89-$3.30 range after testing $2.08 support, with bullish MACD momentum building despite neutral RSI.
DOT Price Prediction: Polkadot Eyes $2.89 Recovery Despite Near-Term Weakness Through December 2025
DOT price prediction targets $2.08 short-term decline before potential recovery to $2.89-$3.97 range as oversold RSI signals possible bounce from current levels.
DOT Price Prediction: Recovery Rally to $2.75-$3.30 Expected Within 30 Days
DOT oversold at $2.02 with RSI at 26.32 signals potential bounce to $2.75-$3.30 range over next month as technical indicators suggest reversal from current levels.
DOT Tests Multi-Month Lows as Polkadot Struggles Below All Major Moving Averages
Polkadot trades at $2.29 after touching yearly lows, with technical indicators signaling continued weakness as DOT remains trapped below key resistance levels.
DOT Price Prediction: Targeting $2.36-$2.40 Within Two Weeks as Technical Indicators Suggest Recovery
DOT price prediction shows potential 3-5% upside to $2.36-$2.40 over the next two weeks, with key resistance at $2.39 and critical support holding at $2.30.
DOT Price Prediction: $2.75-$3.30 Recovery Target by December 2025
Polkadot trades near oversold levels at $2.33 with analyst consensus pointing to $2.75-$3.30 recovery targets within 4-6 weeks as technical indicators suggest potential reversal.
DOT Tests Critical $2.30 Support as Bitcoin Decline Pressures Altcoins Below Key Moving Averages
Polkadot (DOT) trades at $2.33 amid broader crypto weakness, as Bitcoin's continued decline to $87,388 weighs on altcoin sentiment and technical structure.
DOT Tests Multi-Month Lows at $2.27 as Fed Hawkish Stance Crushes Risk Assets
Polkadot trades at $2.27 near 52-week lows as Federal Reserve's hawkish messaging triggers broad cryptocurrency selloff, with DOT breaking below key technical support levels.
DOT Price Prediction: Polkadot Eyes $2.75-$2.83 Recovery Rally Despite Medium-Term Risk to $1.97
DOT price prediction shows oversold bounce potential to $2.75-$2.83 within 1-2 weeks, but medium-term Polkadot forecast warns of possible decline to $1.97 by December 8.
DOT Price Prediction: Polkadot Eyes $3.20 Recovery Despite Technical Weakness Through December 2025
DOT price prediction targets $2.75-$3.20 recovery in coming weeks as oversold conditions and upcoming upgrades could spark Polkadot reversal from current $2.29 lows.
DOT Tests New 52-Week Low at $2.33 as Phala Network Parachain Slot Concludes
Polkadot (DOT) touched a new yearly low of $2.33 following a 7.8% decline, coinciding with Phala Network's parachain slot conclusion and broader crypto market weakness.
DOT Price Prediction: Critical $3.69 Support Test Could Trigger 45% Rally to $3.97 by December 2025
Polkadot faces crucial support at $3.69 with analysts targeting $3.97-$4.01 medium-term recovery, but break below could send DOT to $2.74 bearish target.
DOT Consolidates Near $2.72 as Phala Network Parachain Slot Ends, sub0 Conference Drives Ecosystem Optimism
Polkadot trades at $2.72 with 1.8% daily gains as Phala Network's parachain slot concludes while Buenos Aires conference showcases ecosystem growth amid neutral technical signals.
DOT Price Prediction: Polkadot Eyes $3.38 Target Despite Short-Term Headwinds - Technical Breakout Imminent
DOT price prediction shows potential recovery to $3.38 in coming weeks, despite current bearish momentum. Critical $2.75 level holds the key to bullish continuation.
DOT Rebounds 4% as Sub0 Conference Spotlights Polkadot Ecosystem Amid Crypto Market Recovery
Polkadot's DOT token trades at $2.79, up 3.96% as the Sub0 Symbiosis conference in Buenos Aires highlights ecosystem developments while Bitcoin shows signs of stabilization after last week's 10%...
DOT Price Prediction: Polkadot Targets $3.28 Recovery Before Testing $10.40 by Late 2025
DOT price prediction shows short-term recovery to $3.28 with medium-term Polkadot forecast targeting $3.00-$3.38 range. Technical analysis suggests bullish momentum building despite recent weakness.
DOT Price Consolidates Around $2.81 as Polkadot Tests Key Support Amid Quiet Market Conditions
Polkadot trades at $2.81 with modest 0.3% decline as DOT price action remains range-bound below moving averages while awaiting fresh catalysts to break current consolidation pattern.
DOT Price Prediction: Polkadot Eyes $3.28 Target by December 2025 Despite Current Weakness
DOT price prediction shows potential 17% upside to $3.28 by December 2025, with technical indicators suggesting bullish momentum building despite recent weakness.
DOT Tests Monthly Lows as Polkadot Struggles Below Key Moving Averages
Polkadot trades at $2.81 after a 2.1% decline, testing support near $2.78 as technical indicators signal continued weakness below all major moving averages.
DOT Price Prediction: Targeting $3.28 by December 2025 Amid Technical Recovery
DOT price prediction shows potential 14% upside to $3.28 short-term, while Polkadot forecast suggests $4.85-$6.50 medium-term if key $4.37 resistance breaks.
DOT Price Prediction: Targeting $3.30 Within One Week Despite Current Weakness
DOT price prediction shows potential 14% upside to $3.30 target amid bullish MACD momentum, though immediate support at $2.75 remains critical for bulls.
DOT Price Prediction: Polkadot Eyes $3.40 Target as Technical Indicators Signal Modest Recovery
Polkadot (DOT) shows bullish momentum with MACD histogram turning positive, targeting $3.40 resistance while analysts forecast range of $3.05-$3.34 over next two weeks.
DOT Price Consolidates Above $3 as Polkadot Tests Key Technical Resistance Amid Bitcoin Rally
Polkadot trades at $3.20 following a modest 1.1% daily gain, with technical indicators suggesting potential upside as DOT approaches critical resistance levels.
DOT Consolidates Above Pivot as Crypto Markets Show Mixed Signals Amid Quiet News Cycle
Polkadot trades at $3.19 with modest 1.2% gains as technical indicators suggest potential momentum shift while broader crypto markets digest recent volatility.
DOT Price Prediction: Targeting $3.92 Breakout Before $4.40 Resistance Challenge
DOT price prediction shows potential rally to $3.92 short-term with medium-term Polkadot forecast targeting $4.40 resistance if momentum sustains above $3.19 pivot.
DOT Price Prediction: Target $3.80 by November 15th as Polkadot Breaks Key Resistance
DOT eyes $3.80 short-term target after breaking above $3.29 resistance. Technical indicators show bullish momentum building for Polkadot's next leg up.
DOT Price Prediction: $3.50-$3.80 Target Within Two Weeks as Bullish Momentum Builds
DOT price prediction suggests potential 7-23% upside to $3.50-$3.80 range within two weeks, supported by bullish MACD histogram and breakout above key resistance levels.
Polkadot Hub Launch Fails to Sustain DOT Price Rally as SEC ETF Decision Looms
DOT price retreats to $2.54 (-2.5%) despite yesterday's Polkadot Hub announcement, with traders awaiting November 8th SEC ETF ruling while technical indicators flash oversold conditions.
DOT Price Prediction: Polkadot Eyes $2.90 Recovery Despite Technical Headwinds Through November 2025
DOT price prediction targets $2.90-$2.95 recovery in coming weeks if key $2.97 resistance breaks, though technical indicators show mixed signals for Polkadot forecast.
DOT Price Prediction: Polkadot Eyes $2.90 Recovery Despite Technical Weakness Through November 2025
DOT price prediction suggests potential recovery to $2.90-$2.95 range in coming days, though bearish momentum persists with critical support at $2.50.
Polkadot System Chains Upgrade Passes as DOT Tests Lower Bollinger Band Support at $2.88
DOT price trades at $2.88 down 2.7% as unanimous referendum approval for system chains upgrade provides positive catalyst amid broader crypto weakness testing key technical support levels.
DOT Price Prediction: Polkadot Targets $3.20-$3.44 Short-Term as MACD Signals Bullish Momentum
DOT price prediction shows potential for 7-13% gains to $3.20-$3.44 within two weeks as technical indicators align bullishly despite current consolidation.
Polkadot Asset Hub Migration Proposal Lifts DOT Price as SEC ETF Decision Looms
DOT price climbs to $2.94 (+1.4%) following Polkadot's Asset Hub Migration proposal, while traders await SEC's November 8 ETF decision that could catalyze further movement.
DOT Price Prediction: Targeting $3.04-$3.20 Recovery Within 2-3 Weeks as Technical Indicators Show Early Reversal Signs
Polkadot shows bullish momentum signals with MACD histogram turning positive. DOT price prediction targets $3.04 short-term, $3.20 medium-term despite current weakness.
DOT Consolidates Near 52-Week Lows as SEC Delays Polkadot ETF Decision to November
Polkadot trades at $2.86 following SEC's postponement of 21Shares DOT ETF decision, with technical indicators suggesting potential reversal from oversold conditions.
DOT Price Prediction: Polkadot Eyes $3.44 Recovery as Technical Indicators Show Early Bullish Signals
DOT price prediction targets $3.44 in the near term as MACD histogram turns bullish despite current consolidation around $2.88 support levels.
DOT Price Prediction: Polkadot Eyes $4.29 Resistance Break for 35% Rally to $4.88
DOT price prediction shows potential 35% upside to $4.88 if Polkadot breaks $4.29 resistance, supported by bullish MACD momentum and analyst targets up to $13.90.
DOT Price Prediction: Polkadot Eyes $4.01 Target as Bulls Battle for $3.25 Breakout by Week-End
DOT price prediction suggests a potential rally to $3.25 short-term and $4.01 medium-term, but critical support at $2.96 must hold for bullish continuation.
DOT Price Prediction: Targeting $4.01-$4.44 Range Despite Current Bearish Momentum
DOT price prediction suggests potential recovery to $4.01-$4.44 resistance zone within 4-6 weeks, though immediate support at $2.96 must hold for bullish Polkadot forecast.
DOT Consolidates Near $3 as Network Adoption Drives Recent 3.15% Weekly Gain
Polkadot trades at $2.99 after last week's 3.15% surge driven by rising network adoption and increased exchange activity, now testing key technical levels.
DOT Price Prediction: Polkadot Eyes $2.95 Target Amid Bearish Technical Setup - Recovery Possible to $4.00 by November
DOT price prediction suggests immediate downside to $2.95 with recovery potential to $4.00. Technical analysis shows bearish momentum but oversold conditions may trigger bounce.
DOT Slips Below Key Moving Averages as Bearish Momentum Builds Despite Oversold Conditions
Polkadot trades at $3.02 after a 2.45% decline, breaking below the 7-day moving average while technical indicators signal growing bearish pressure in the absence of major catalysts.
DOT Tests Multi-Month Lows Near $2.90 as Polkadot Faces Technical Breakdown Risk
Polkadot trades at $2.93 after touching its 52-week low of $2.89, with DOT price showing weak momentum as technical indicators signal potential further downside ahead.
[DOT] Polkadot Tests Critical Support Near $2.90 as Version 2.0 Launch Fails to Offset Broader Market Weakness
DOT price drops 4.27% to $2.91 despite positive Version 2.0 upgrade news, as Federal Reserve hawkish stance weighs on crypto markets and technical indicators signal oversold conditions.
Polkadot Consolidates Near $4.09 as Technical Indicators Signal Neutral Momentum
DOT trades at $4.09 with minimal 24-hour volatility as the token maintains position above key moving averages despite bearish MACD signals pointing to potential weakness. CONTENT: Market Overview ...
Polkadot Consolidates Above Key Moving Averages as DOT Holds $4.10 Support Zone
DOT trades at $4.11 with minimal 0.07% daily gain, maintaining position above all major moving averages while technical indicators suggest continued sideways action near critical pivot levels.
DOT Price Watch: Polkadot Tests Key Moving Averages After 4.5% Daily Decline
Polkadot trades at $4.15 following a 4.49% decline, positioning above all major moving averages with neutral RSI suggesting potential reversal opportunity.
Polkadot Tests Key Support at 3.91 as Technical Indicators Signal Neutral to Bearish Momentum
EXCERPT: DOT trades at $3.91 with a 0.79% daily decline, testing critical support levels while technical indicators suggest continued sideways pressure below key moving averages.
DOT Consolidates Below Key Moving Averages as Technical Indicators Signal Neutral Territory
Polkadot trades at $3.93 with mild downside pressure as DOT remains below all major moving averages while RSI holds neutral at 45.2 amid declining volume patterns.
Polkadot Analysis: DOT's Neutral Territory Signals Potential Breakout as Technical Indicators Diverge
DOT price sits at $3.94 with conflicting signals - RSI shows neutral momentum while MACD hints at bearish pressure. Key support at $3.77 could determine next move.
Polkadot (DOT) Tests Critical Support at $3.81 Amid Bearish Technical Signals
DOT price drops 1.88% to $3.81, approaching key support at $3.77. RSI signals oversold conditions while technical indicators point to continued weakness.
Polkadot (DOT) Tests Lower Bollinger Band as Bears Take Control
DOT price drops 2.68% to $3.92, approaching key support at $3.78 as technical indicators signal continued weakness ahead.
Polkadot (DOT) Consolidates Near $4.07 as Technical Indicators Show Mixed Signals
DOT price trades at $4.07 with modest 1.14% gains as Polkadot's RSI remains neutral while MACD suggests weakening momentum in the near term.
Polkadot (DOT) Price Hovers at $3.99 Despite Treasury Developments
DOT trades at $3.99 (-3.34% daily) as technical indicators signal neutral momentum while Polkadot Treasury moves to acquire USDT and USDC with 96.3% referendum support.
DOT Price Plunges 8.7% to $3.99 as Polkadot Faces Technical Breakdown
Polkadot (DOT) trades at $3.99 after an 8.69% daily decline, with technical indicators showing bearish momentum despite neutral RSI levels.
Polkadot (DOT) Breaks Above Key Resistance as Treasury Reforms Signal Major Upgrade
DOT trades at $4.38 (+0.28%) after community caps supply at 2.1B tokens. Technical indicators show bullish momentum with potential breakout above $4.88 resistance.
DOT Price Rallies Above Key Resistance Despite Recent Pullback - Polkadot Supply Cap Fuels Bullish Momentum
DOT price trades at $4.40 with strong bullish signals intact despite 4.18% daily decline. Supply cap decision and technical breakout suggest upside potential remains.
DOT Price Surges 2.85% as Polkadot Community Caps Supply at 2.1 Billion Tokens
DOT trades at $4.59 with bullish momentum following community approval of supply cap referendum, marking shift from inflationary to scarcity-driven tokenomics.
Polkadot (DOT) Surges 8.87% as Supply Cap Vote Sparks Rally Above $4.50
DOT price reaches $4.54 with strong bullish momentum after community approves 2.1 billion token supply cap, breaking key resistance levels on heavy volume.
Polkadot (DOT) Tests $4.18 as Supply Cap Sparks Bullish Momentum
DOT trades at $4.18 despite 0.52% daily decline, with community vote to cap supply at 2.1B tokens driving positive sentiment and technical indicators showing bullish divergence.
Polkadot (DOT) Eyes $4.63 Resistance as Bullish Momentum Builds
DOT price trades at $4.17 with bullish MACD signals and RSI in neutral territory, setting up potential breakout above key resistance levels.
Polkadot (DOT) Faces Resistance at $4.18 Despite Recent Rally Momentum
DOT price currently trades at $4.18 after a 6.29% decline, testing key support levels while technical indicators suggest mixed signals for short-term direction.
** Polkadot (DOT) Surges Near Resistance at $4.45 Despite Minor Daily Pullback
** DOT trades at $4.45 with bullish momentum intact following Snowbridge upgrade announcement, though facing key resistance at $4.63 level.
DOT Price Surges 6.61% as Polkadot Technical Analysis Shows Bullish Momentum
DOT trades at $4.50 with strong 6.61% daily gains. Technical indicators signal continued upside potential as Polkadot breaks key resistance levels.
Polkadot (DOT) Eyes $4.37 Resistance as Treasury Vote and Technical Indicators Align
DOT trades at $4.20 with bullish momentum as Polkadot Treasury's USDC/USDT acquisition proposal gains 96.3% support, while technical analysis shows strength above key moving averages.
Polkadot (DOT) Breaks Above $4 as Major Announcement Sparks Bullish Momentum
DOT trades at $4.18 with technical indicators flashing bullish signals after September 8 announcement catalyst. RSI neutral at 59, key resistance at $4.28.
Polkadot (DOT) Surges 3.65% as Network 2.0 Launch Approaches - Bulls Eye $4.55 Resistance
DOT trades at $4.17 (+3.65%) with bullish momentum building ahead of Polkadot 2.0 launch. Technical indicators suggest potential breakout above $4.28 resistance.
Polkadot (DOT) Price Surges 3.8% Ahead of Major September 8 Announcement
DOT trades at $4.00 with 3.82% daily gains as Polkadot prepares for significant announcement today. Technical indicators show bullish momentum building.
Polkadot (DOT) Hovers Near $3.86 as Technical Indicators Flash Mixed Signals
DOT price trades at $3.86 with neutral momentum as Polkadot technical analysis reveals key resistance at $4.28 while support holds at $3.61 levels.
DOT Price Hovers Near $3.82 as Polkadot Shows Mixed Technical Signals
Polkadot trades at $3.82 with neutral momentum indicators suggesting consolidation phase. Key support at $3.61 critical for bulls.
Polkadot (DOT) Eyes $4.28 Resistance as Trading Volume Surges 47%
DOT trades at $3.80 (+0.53%) with technical indicators showing mixed signals while Polkadot 2.0 upgrades drive increased market interest amid neutral RSI conditions.
Polkadot (DOT) Tests $3.78 Support as Paraguay Investment Battles Staking Reward Cuts
DOT price holds $3.78 amid mixed signals - Paraguay's $6M commitment countered by Bitvavo's staking reward reduction. Technical indicators show neutral momentum.
DOT Price Rallies 1.85% as Paraguay Invests $6M in Polkadot Infrastructure
DOT trades at $3.84 with neutral RSI at 48.79 following Paraguay's $6 million Polkadot investment and successful Asset Hub migration on testnet.
Polkadot (DOT) Holds Above Key Support as Elastic Scaling Referendum Gains Momentum
DOT trades at $3.77 (-0.27%) while technical upgrades and neutral RSI suggest potential consolidation ahead of October's Polkadot Build Party.
DOT Price Analysis: Polkadot Tests Critical Support at $3.65 Amid Bearish Momentum
Polkadot (DOT) trades at $3.71, down 2.50% as technical indicators signal neutral to bearish conditions with RSI at 44.58 and key support at $3.65.
Polkadot (DOT) Struggles Below Key Resistance as RSI Shows Neutral Momentum
DOT price trades at $3.80 amid sideways action, with technical indicators suggesting limited bullish momentum despite recent governance upgrades and leadership changes.
DOT Price Drops to $3.78 as Polkadot Faces Technical Headwinds
Polkadot trades at $3.78 (-1.02% in 24h) with bearish momentum indicators and key support at $3.69 under pressure as DOT struggles below moving averages.
DOT Price Drops 3.3% as Polkadot Tests Critical Support at $3.82
Polkadot (DOT) trades at $3.82 after a 3.31% decline, with technical indicators showing neutral momentum and key support levels in focus.
Polkadot (DOT) Price Hovers at $3.92 as Treasury Vote Shows 83% Support for USDC/USDT Acquisition
DOT trades at $3.92 with neutral technical signals while Polkadot Treasury referendum proposing USDC and USDT acquisition gains overwhelming community support at 83.4%.
Polkadot (DOT) Tests Key Support at $3.90 Amid Governance Tensions
DOT trades at $3.90 (-3.98% in 24h) as treasury disputes overshadow Gavin Wood's return as Parity CEO, with technical indicators showing neutral momentum.
DOT Rallies 2.19% as Polkadot 2.0 Launch and Gavin Wood's Return Fuel Optimism
DOT trades at $4.02 with bullish momentum emerging from Polkadot 2.0 elastic scaling launch and founder Gavin Wood's CEO return, signaling potential breakout above key resistance.
DOT Price Faces $3.91 Test as Polkadot 2.0 Launch Approaches
DOT trades at $3.91 (-2.18%) despite Gavin Wood's return as Parity CEO, with technical indicators showing mixed signals ahead of major network upgrade.
DOT Price Drops 6.5% Despite Gavin Wood's Return as Parity CEO
Polkadot trades at $4.00 after a 6.55% daily decline, even as founder Gavin Wood announces his return as CEO of Parity Technologies in late August.
DOT Price Surges 4.17% as Polkadot Technical Indicators Flash Bullish Signals
Polkadot (DOT) trades at $4.32 with strong momentum indicators and RSI at 61.05, suggesting continued upside potential despite approaching key resistance levels.
DOT Surges 7.13% as Polkadot Technical Indicators Signal Bullish Momentum
Polkadot (DOT) trades at $4.16 with strong bullish signals emerging from MACD and Stochastic indicators as the token approaches key resistance levels.
Polkadot (DOT) Holds Above $3.90 as Bullish Momentum Builds Despite 24h Decline
DOT price trades at $3.93 after a 3.82% daily drop, but technical indicators suggest potential recovery with MACD showing bullish momentum and RSI in neutral territory.
DOT Price Surges 4% as Institutional Buying Drives Polkadot Rally
Polkadot (DOT) trades at $4.04, up 0.82% in 24h, following a strong 4% breakout driven by institutional demand and triple-average trading volume.
DOT Price Holds Above $4 as Polkadot Shows Weak Bullish Momentum
DOT price trades at $4.07 with neutral momentum. Technical analysis reveals mixed signals as Polkadot faces key resistance at $4.55 while maintaining support above $3.43.
DOT Price Surges 3.75% as Polkadot Tests Critical $4.00 Resistance Zone
DOT price climbs to $4.02 with bullish MACD signals emerging, while community governance discussions and recent deflationary proposals fuel optimism.
DOT Price Recovers 6% as Polkadot Shows Neutral Technical Signals
DOT trades at $3.88 (+5.99%) following Vietnam adoption push, but technical indicators show mixed signals as market faces broader volatility concerns.
DOT Price Slides Below Key Moving Averages as Polkadot Tests Critical Support
DOT price trades at $3.65 with bearish MACD signals emerging. Polkadot technical analysis reveals key support at $3.43 as momentum indicators flash caution.
Polkadot (DOT) Tests $3.60 Support as Technical Indicators Flash Mixed Signals
DOT price hovers at $3.63 with bearish momentum indicators, but Gavin Wood's deflationary proposal provides bullish catalyst for potential reversal.
DOT Price Tests $3.45 Support as Polkadot Technical Analysis Shows Oversold Conditions
DOT currently trades at $3.58 (-1.65% in 24h) near critical support levels, with RSI at 38.17 suggesting potential oversold bounce opportunity for traders.
DOT Price Holds Above $3.88 as Polkadot Shows Mixed Technical Signals
Polkadot trades at $3.88 with 0.44% daily gains, but technical indicators suggest cautious optimism as DOT faces key resistance at $4.67 amid neutral momentum.
Polkadot (DOT) Tests Support at $3.83 Despite JAM Upgrade Optimism
DOT trades at $3.83 with 4% daily decline as technical indicators show mixed signals despite positive JAM upgrade news driving 8% weekly gains.
DOT Price Falls 7% to $3.97 as Polkadot Tests Critical Support Levels
Polkadot (DOT) drops to $3.97 amid bearish momentum, with RSI at neutral 48.57 and key support at $3.59 coming into focus for traders.
DOT Price Tests $4 Support as Polkadot Faces Mixed Technical Signals
Polkadot (DOT) trades at $4.03 after a 3.57% decline, with neutral RSI and bearish MACD suggesting consolidation ahead of next major move.
DOT Price Surges 32% Following Polkadot's Elastic Scaling Upgrade and PoP Proposal
DOT trades at $4.17 (+1.88% daily) after Polkadot's major technical upgrades and founder Gavin Wood's sustainability proposal drive institutional interest.
Polkadot (DOT) Rebounds to $4.09 as Institutional Buyers Step In After 7% Drop
DOT recovers to $4.09 (+2.76%) following strong institutional buying interest after Thursday's decline, with technical indicators showing mixed signals ahead.
Polkadot (DOT) Faces Bearish Pressure Despite Technical Upgrades - Key Levels to Watch
DOT trades at $3.99 (-3.90% daily) as recent technical advances clash with broader market weakness. Critical support at $3.32 holds firm while resistance looms.
Polkadot (DOT) Struggles at $4.11 Despite JAM Upgrade Momentum
DOT trades at $4.11 after a 2.61% decline, testing key support despite recent JAM upgrade driving price above $4.50. Technical indicators show mixed signals.
Polkadot (DOT) Holds Above $4.40 Despite Overbought Conditions and Major Network Upgrades
DOT trades at $4.48 with RSI at 73.55 showing overbought levels. Recent Proof of Personality proposal and Elastic Scaling upgrade drive bullish sentiment despite technical caution signals.
Polkadot Surges Past $4.40 as Elastic Scaling Upgrade Fuels Bullish Momentum
DOT trades at $4.43 with overbought RSI at 70.57, testing key resistance at $4.62 following technical upgrades and nova wallet debit card launch driving adoption.
Polkadot Price Soars 3.96% as Proof of Personality Model and DOT Stablecoin Plans Drive Bullish Momentum
DOT surges amid Gavin Wood's innovative PoP proposal to cut validator costs by 80% and plans for native stablecoin, despite Grayscale fund removal creating mixed signals.
Polkadot (DOT) Breaks Key Resistance Amid Proof of Personality Proposal and Elastic Scaling Upgrade - July 2025 Analysis
DOT surges past $4.30 with 69.74 RSI as Gavin Wood's Proof of Personality model and elastic scaling upgrades drive bullish momentum toward $4.96 target resistance.
Polkadot (DOT) Surges 120% in July Amid Technical Upgrades and Market Momentum
Polkadot (DOT) is riding a 120% July surge, fueled by groundbreaking technical upgrades like Elastic Scaling and growing institutional adoption. Is DOT set for a breakout?
Polkadot (DOT) Gains Momentum with Technical Upgrades and Institutional Interest in July 2025
Polkadot (DOT) is surging with a 20% weekly gain, driven by Elastic Scaling upgrades and institutional adoption. While whale sell-offs add volatility, analysts remain bullish.
Polkadot (DOT) Gains Momentum in July 2025: Technical Upgrades, Institutional Adoption, and Mixed Market Sentiment
Polkadot (DOT) is making waves in July 2025 with Elastic Scaling and JAM protocol upgrades, institutional adoption, and cross-chain innovations. Despite whale sell-offs, mixed signals suggest poten...
Polkadot (DOT) Gains Momentum with Technical Upgrades and Institutional Adoption in July 2025
Polkadot (DOT) surges amid Elastic Scaling upgrades, cross-chain innovations, and institutional adoption. Despite security concerns and whale sell-offs, bullish momentum persists.
Polkadot (DOT) Surges Amid Cross-Chain Innovations and Bullish Momentum
Polkadot (DOT) gains traction with a 20% weekly rally, driven by cross-chain upgrades, Ethereum compatibility, and bullish momentum. Analysts target $4.50-$6.00.
Polkadot (DOT) Gains Momentum Amid Cross-Chain Innovations and Technical Upgrades
Polkadot (DOT) shows signs of recovery with a 5% price surge, fueled by Bitcoin momentum and cross-chain innovations. Technical upgrades and institutional adoption bolster its outlook.
Polkadot (DOT) Price Analysis: Recent Surge Signals Weak Bullish Trend – What’s Next?
Polkadot (DOT) is up 7.61% in the last 24 hours, trading at $3.93. With weak bullish momentum and key resistance at $4.02, is now the time to buy or hold? Let’s analyze.
DYDX Tests Annual Lows at $0.32 as Foundation's Analyst Call Fails to Spark Rally
DYDX price drops 1.3% to $0.32 despite dYdX Foundation's analyst call highlighting 2026 roadmap and U.S. market expansion plans, with RSI signaling oversold conditions.
DYDX Plunges to Annual Lows After Chain Downtime Triggers Technical Sell-Off
DYDX trades at $0.33 following temporary blockchain downtime on October 10, with oversold RSI at 27 signaling potential bounce as broader crypto markets stabilize amid Bitcoin rally.
DYDX Technical Breakdown: Platform Upgrade Catalyst Meets Mixed Momentum Signals
DYDX price holds at $0.61 despite mixed technical indicators as traders digest the September 24 platform upgrade announcement that sparked a 7% rally.
DYDX Price Retreats Despite Major Announcement Tease - Technical Analysis Shows Mixed Signals
DYDX trades at $0.59 (-0.69% daily) as momentum fades from recent positive catalysts. Technical indicators show neutral RSI but bearish MACD signals.
DYDX Price Drops 8.5% Despite Recent Rally - Technical Analysis Shows Key Support Test
DYDX trades at $0.59 after an 8.5% decline, testing crucial support levels near $0.57 despite last week's 7% surge on upcoming announcement speculation.
DYDX Price Climbs 4.21% Despite Mixed Technical Signals at $0.64
DYDX trades at $0.64 with 4.21% daily gains, but bearish MACD and neutral RSI suggest caution as price approaches key resistance levels.
DYDX Price Drops 3.4% as Technical Indicators Signal Neutral Zone Trading
DYDX trades at $0.61 after declining 3.41% in 24 hours, with RSI at 44.62 suggesting neutral momentum despite weak bullish overall trend signals.
DYDX Price Surges 2% as Bulls Target $0.77 Resistance Level
DYDX trades at $0.69 with bullish momentum building as technical indicators signal potential breakout above key resistance at $0.77.
DYDX Price Surges Above Key Moving Averages as Bullish Momentum Builds
DYDX trades at $0.68 with +1% daily gains as technical indicators signal strengthening bullish momentum across multiple timeframes.
** DYDX Price Surges Above $0.67 as Platform Upgrades Drive 3.76% Weekly Gains
** DYDX trades at $0.67 with bullish momentum following successful v9.0 upgrade and $1M trader rewards program, showing strong technical signals for continued upside.
DYDX Price Surges 9.25% to $0.68 as Institutional ETP and Platform Upgrades Fuel Rally
DYDX trades at $0.68 with strong 9.25% daily gains, driven by 21Shares ETP launch and v9.0 upgrade boosting institutional adoption and trader incentives.
DYDX Price Hovers at $0.62 as Mixed Technical Signals Create Trading Uncertainty
DYDX trades at $0.62 after a 1.63% daily decline, with technical indicators showing neutral momentum despite bullish MACD crossover signals emerging.
DYDX Price Surges 3.76% as Platform Upgrades and Trading Incentives Drive Momentum
DYDX trades at $0.63 with 3.76% daily gains following successful v9.0 upgrade and $1M trader rewards program launch, showing strong bullish technical signals.
DYDX Price Tests Support at $0.62 as Bulls Fight Back Despite 4.55% Daily Drop
DYDX trades at $0.62 (-4.55% daily) but maintains bullish outlook with MACD momentum and strong platform fundamentals following v9.0 upgrade.
** DYDX Price Drops 6% Despite Platform Upgrades as Crypto Markets Turn Bearish
** DYDX trades at $0.64 after a 6.07% daily decline, testing key support levels despite recent platform improvements and trader incentive programs boosting ecosystem momentum.
DYDX Surges Above $0.68 as Platform Upgrade and Trading Incentives Drive Momentum
DYDX price climbs 3.46% to $0.68 following successful v9.0 upgrade and $1M trader rewards program, with technical indicators showing strong bullish momentum.
DYDX Price Surges 2.55% as Platform Upgrade and Trading Incentives Boost Momentum
DYDX trades at $0.66 following successful v9.0 upgrade and $1M trader rewards program. Technical indicators show bullish momentum with RSI at 56.66 and strong resistance at $0.71.
DYDX Price Surges 2.64% as Bulls Target $0.72 Resistance
DYDX trades at $0.63 with bullish momentum emerging as technical indicators signal potential breakout above key resistance levels in the decentralized exchange token.
DYDX Price Eyes $0.72 Resistance as DeFi Boom Predictions Fuel Bullish Momentum
DYDX trades at $0.63 (+2.65%) as CEO predicts September DeFi boom and Telegram trading launch promises $3M monthly rewards, while technical indicators show strong bullish trend.
DYDX Price Holds Ground at $0.61 as Major Platform Upgrade and Trader Incentives Launch
DYDX trades at $0.61 (+2.08% daily) following successful v9.0 upgrade and new trader rewards program, but technical signals remain mixed with neutral RSI.
DYDX Price Holds $0.60 Despite Platform Upgrades and DeFi Festival Predictions
DYDX trades at $0.60 with mixed signals as recent v9.0 upgrade fails to boost price despite CEO's bullish DeFi predictions for September.
** DYDX Price Falls to $0.59 Despite Major Platform Upgrades and Telegram Trading Launch
** DYDX trades at $0.59 with weak bullish signals as technical upgrades and upcoming Telegram trading fail to prevent recent price decline.
DYDX Price Struggles at $0.59 Despite Major v9.0 Chain Upgrade Completion
DYDX trades at $0.59 with modest 1.14% daily gains, but technical indicators show bearish momentum despite successful v9.0 software upgrade completion on September 2nd.
DYDX Price Tests Critical $0.58 Support Despite Platform Upgrades
DYDX trades at $0.58 after declining 0.56% in 24 hours, testing key support levels as technical indicators show mixed signals amid recent community developments.
DYDX Price Analysis: Technical Upgrades Drive 1.36% Gain Amid Neutral RSI Signals
DYDX trades at $0.60 with 1.36% daily gains as community votes on v9.0 upgrade. Neutral RSI at 45.36 suggests consolidation before next major move.
DYDX Price Drops 4.19% Despite Platform Upgrade Announcements - Technical Analysis Shows Bearish Momentum
DYDX trades at $0.59 with bearish technical signals emerging despite recent platform upgrade announcements and community governance activities from dYdX Foundation.
DYDX Price Tests $0.59 Support Despite Community Upgrade Vote - Technical Analysis
DYDX trades at $0.61 after 4.5% decline, testing critical support levels despite positive v9.0 upgrade developments and new platform launches.
DYDX Price Tests $0.59 Support Despite Platform Upgrade Momentum
DYDX trades at $0.61 after a 4.5% decline, testing critical support levels while the community votes on v9.0 upgrades through August 31st.
DYDX Price Struggles at $0.62 Despite Platform Upgrades and New Launches
DYDX trades at $0.62 (+0.96% today) as technical indicators show mixed signals while recent platform developments fail to drive immediate price momentum.
DYDX Price Drops 4.5% Despite Community Upgrade Votes - Key Support at $0.59
DYDX trades at $0.61 after falling 4.5% in 24h, testing critical support despite positive community developments around platform upgrades.
DYDX Price Surges Above $0.63 Following Multiple Platform Launches and Community Upgrade Vote
DYDX trades at $0.63 (+2.11% in 24h) after breaking key resistance. New launches announced while community votes on v9.0 upgrade amid mixed technical signals.
DYDX Price Retreats 6.3% as Mixed Technical Signals Create Trading Uncertainty
DYDX trades at $0.64 after declining 6.3% in 24 hours, with technical indicators showing conflicting bullish and bearish signals creating uncertainty for traders.
DYDX Breaks Above Key Moving Averages as Bullish Momentum Builds
DYDX price surges 2.75% to $0.68 as technical indicators signal potential breakout above critical resistance levels with RSI in neutral territory.
DYDX Price Drops 9% to $0.67 as Technical Indicators Show Mixed Signals
DYDX price falls to $0.67 with 9.22% daily decline, but bullish MACD momentum suggests potential reversal as token trades above key moving averages.
DYDX Price Analysis: Token Hovers at $0.63 Amid Volume Surge and Technical Neutrality
DYDX trades at $0.63 with mixed signals as dYdX Chain records $2.14B daily volume surge while RSI remains neutral at 53.44, creating uncertainty for traders.
DYDX Price Holds Above Key Support as Technical Indicators Signal Neutral Momentum
DYDX trades at $0.64 with mixed signals as the RSI sits in neutral territory while MACD shows bullish momentum, creating uncertainty for traders.
DYDX Price Holds Above Key Support Levels Despite 2.66% Daily Decline
DYDX trades at $0.64 with technical indicators showing mixed signals as the token tests crucial support zones while maintaining weak bullish momentum.
DYDX Price Surges 5% to $0.65 as Trading Volume Hits Multi-Month Highs
DYDX rallies to $0.65 with bullish momentum indicators showing strength above key moving averages, while the platform records $2.14B daily volume amid market volatility.
DYDX Price Surges 11% as Bulls Target Key Resistance at $0.72
DYDX price rallies to $0.61 with strong 11% daily gains, but technical indicators show mixed signals as the token approaches critical resistance levels.
DYDX Price Consolidates at $0.56 as Token Unlock Creates Trading Uncertainty
DYDX trades at $0.56 (-0.52% daily) near critical support as 13.95M token unlock anticipation weighs on sentiment despite recent community emission discussions.
DYDX Price Consolidates Near $0.55 as Token Unlock Anticipation Builds
DYDX trades at $0.55 (+1.49% daily) with mixed technical signals as traders await 13.95M token unlock impact and community emission reduction discussions.
** DYDX Price Tests Critical Support at $0.54 Despite Recent Volatility
** DYDX trades at $0.54 with modest 0.87% gains, but technical indicators suggest caution as the token hovers near crucial support levels after recent selloff.
DYDX Price Drops to $0.54 as Bears Target Key Support Levels
DYDX trades at $0.54 (-1.54% daily) with RSI at oversold 37.73 level. Technical indicators suggest potential bounce from $0.52 support despite bearish momentum.
** DYDX Price Faces Resistance at $0.72 Despite Recent Rally - Mixed Signals for Traders
** DYDX trades at $0.60 with 2.33% daily gains but faces key resistance levels. Technical indicators show neutral momentum while recent regulatory developments provide support.
DYDX Price Drops 5.6% Despite Recent Rally - Technical Analysis Shows Mixed Signals
DYDX trades at $0.58 after a 5.6% decline, testing support levels despite recent 30% surge from Craft Ventures investment and positive ecosystem developments.
DYDX Price Falls to $0.62 Despite MiCA Compliance Boost - Technical Analysis Shows Mixed Signals
DYDX trades at $0.62 after 6.42% decline, but MiCA-compliant whitepaper and neutral RSI suggest potential recovery opportunities ahead for traders.
DYDX Price Drops 7.6% Despite Major Token Burn and $10M Investment
DYDX trades at $0.60 after a sharp decline, but recent $15.7M token burn and regulatory advances suggest potential recovery ahead for the decentralized exchange token.
DYDX Price Analysis: Bulls and Bears Battle at $0.64 as Technical Indicators Show Mixed Signals
DYDX trades at $0.64 with a modest 1.34% daily gain, but technical indicators reveal conflicting signals as the token navigates between key support and resistance levels.
DYDX Price Holds Above Key Support as Regulatory Compliance Boosts Long-Term Outlook
DYDX trades at $0.63 with modest 0.55% gains while MiCA-compliant whitepaper release and network upgrade strengthen fundamentals despite mixed technical signals.
DYDX Price Holds Above $0.67 Despite 4.6% Drop as Network Upgrades Show Technical Strength
DYDX trades at $0.67 after a 4.58% decline, but recent network upgrades and bullish technical indicators suggest potential recovery ahead for the decentralized exchange token.
EigenLayer Tests Bearish Momentum as EIGEN Price Slides to $1.12 Amid Market-Wide Crypto Weakness
EIGEN price drops 3.86% to $1.12 as technical indicators signal continued bearish pressure, with the token approaching lower Bollinger Band support amid broader crypto market weakness.
EIGEN Pressured by 37M Token Unlock as Price Tests $1.17 Support Level
EigenLayer (EIGEN) trades at $1.17 following a massive 13.77% token unlock that released 36.82M tokens into circulation, creating selling pressure despite positive liquid restaking developments.
EigenLayer Analysis: EIGEN Faces Critical Resistance Test at $2.10 Despite Strong Bullish Foundation
EIGEN price drops 5.59% to $1.74 amid neutral RSI signals, but technical structure remains bullish with key resistance at $2.10 creating major trading opportunity.
EigenLayer (EIGEN) Surges 7.96% to $1.86 Despite Recent Technical Resistance
EIGEN price climbs to $1.86 with 7.96% daily gains, recovering from falling wedge breakout as technical indicators show bullish momentum above key moving averages.
EigenLayer (EIGEN) Down 8% as Bulls Face Critical $1.75 Test
EIGEN price drops to $1.69 amid bearish momentum, but technical indicators suggest potential reversal as EigenLayer tests key pivot point support levels.
EigenLayer (EIGEN) Surges 3% to $1.82 as Bullish Technical Signals Strengthen
EIGEN price climbs 3% to $1.82 with RSI at 60.57 and MACD showing bullish momentum. Technical indicators suggest continued upward pressure for EigenLayer.
EigenLayer (EIGEN) Shows Bullish Momentum Above $1.70 Despite Modest 0.65% Daily Gain
EIGEN price trades at $1.71 with bullish MACD signals and RSI at 57.24. Technical indicators suggest potential breakout above key resistance levels.
EigenLayer (EIGEN) Holds Above Key Support Despite 2.7% Daily Decline - Technical Analysis Points to Continued Bullish Momentum
EIGEN price currently trades at $1.81, down 2.74% in 24h but maintaining bullish trend above all major moving averages with RSI at 64.14 in neutral territory.
EigenLayer EIGEN Price Soars: Technical Analysis Shows Bullish Momentum Ahead of Token Unlock
EIGEN trades at $1.86 with strong bullish signals across multiple timeframes as the market anticipates September 30 token transferability unlock.
EigenLayer (EIGEN) Tests $1.90 Resistance as RSI Approaches Overbought Territory
EIGEN price holds at $1.89 despite 1.30% daily decline, with technical indicators showing mixed signals as the token approaches key resistance levels.
EigenLayer (EIGEN) Surges 26% to $1.93 as Technical Indicators Flash Overbought
EIGEN price jumps 25.91% to $1.93 with RSI hitting 70.38, signaling strong bullish momentum but potential short-term consolidation ahead for EigenLayer traders.
EigenLayer (EIGEN) Price Analysis: Strong Bullish Momentum Despite 3.44% Daily Decline
EIGEN price currently at $1.54 with technical indicators showing very strong bullish trend despite recent pullback. Key resistance at $1.77 presents opportunity.
EigenLayer (EIGEN) Surges 3.59% as Bulls Target $1.77 Resistance
EIGEN price climbs to $1.59 with strong bullish momentum across all timeframes. Technical indicators suggest potential breakout above key resistance levels.
EigenLayer (EIGEN) Surges Above $1.58 Following Binance and Coinbase Listings
EIGEN price climbs to $1.58 after major exchange listings, with technical indicators showing bullish momentum despite minor daily pullback of 0.06%.
EigenLayer (EIGEN) Consolidates Near $1.59 After Exchange Listing Rally
EIGEN price trades at $1.59 with -2.58% daily decline following major Binance and Coinbase listings that drove significant momentum above key resistance levels.
EigenLayer (EIGEN) Surges 12% as Technical Indicators Flash Bullish Signals
EIGEN price jumps to $1.63 with strong momentum indicators suggesting further upside potential as the token breaks above key resistance levels.
EigenLayer (EIGEN) Surges Past $1.47 as Major Exchange Listings Drive Bullish Momentum
EIGEN price hits $1.47 (+0.89% daily) following Binance and Coinbase listings, with technical indicators showing strong bullish signals ahead of September 30 token transferability.
EIGEN Price Analysis - September 10, 2025
** EIGEN price reaches $1.43 (+3.39%) as Binance and Coinbase listings drive momentum ahead of September 30 token unlock, with technical indicators showing strong bullish signals.
** EigenLayer (EIGEN) Rallies 6.58% Despite Technical Pullback - Major Exchange Listings Drive Momentum
** EIGEN price trades at $1.40 after major Binance and Coinbase listings fuel 91% weekly surge, with technical indicators showing mixed signals ahead of September 30 unlock.
EigenLayer (EIGEN) Surges 7.65% as Exchange Listings Drive Bullish Momentum Above $1.49
EIGEN price climbs to $1.49 with strong bullish signals as major exchange listings and upcoming token transferability unlock fuel investor confidence.
EigenLayer (EIGEN) Price Surges on Major Exchange Listings Despite Technical Pullback
EIGEN trades at $1.39 with 6.58% daily gains as Binance and Coinbase listings drive momentum ahead of September 30 token transferability unlock.
EigenLayer (EIGEN) Rallies 14% on Binance Listing News Despite 4% Daily Pullback
EIGEN price trades at $1.29 after pullback from recent highs, as Binance confirms listing following Coinbase announcement. Technical analysis shows bullish momentum building.
EigenLayer (EIGEN) Rallies 6.33% as Technical Indicators Signal Neutral Territory
EIGEN price surges to $1.29 with bullish momentum despite mixed technical signals. Key resistance at $1.53 could determine next move for EigenLayer traders.
EigenLayer (EIGEN) Consolidates Near $1.21 as Technical Indicators Signal Mixed Momentum
EIGEN price trades at $1.21 with neutral RSI at 46.26, showing weak bullish trend despite trading below key moving averages on Binance spot market.
EIGEN Price Technical Analysis: Neutral RSI Signals Potential Breakout at $1.23
EigenLayer (EIGEN) trades at $1.23 with 1.83% daily gains as technical indicators show mixed signals. EIGEN RSI at 46.81 suggests neutral momentum ahead of key resistance test.
EigenLayer EIGEN Price Surges 2.49% After Binance Listing Confirmation
EIGEN trades at $1.19 (+2.49%) following Binance's listing announcement. Technical indicators show mixed signals as token transferability approaches Sept 30.
EigenLayer (EIGEN) Tests Critical Support as RSI Signals Neutral Territory
EIGEN price trades at $1.21 with -1.39% decline in 24h. Technical analysis reveals neutral RSI at 44.80 while bears pressure key support levels around $1.15.
EigenLayer (EIGEN) Price Consolidates at $1.22 as Protocol Prepares for Major Token Support Upgrade
EIGEN trades flat at $1.22 with neutral RSI at 45.47 while upcoming permissionless token support could unlock new growth catalysts for the restaking protocol.
EigenLayer (EIGEN) Tests Critical $1.18 Support Amid Mixed Technical Signals
EIGEN price hovers at $1.22 despite recent recovery, as technical indicators show conflicting signals while the token battles to hold above key support levels.
EigenLayer (EIGEN) Tests Critical Support at $1.18 as Technical Indicators Flash Mixed Signals
EIGEN price drops 4.6% to $1.20 despite positive ERC-20 expansion news, with technical analysis showing bearish momentum but potential support zone forming near $1.18.
EigenLayer (EIGEN) Shows Bullish Momentum Despite 5% Daily Decline - Key Levels to Watch
EIGEN price drops 5% to $1.35 but technical indicators signal potential reversal with MACD turning bullish and RSI holding neutral territory above 50.
EigenLayer (EIGEN) Surges 7.72% to $1.42 Despite Recent Security Concerns
EIGEN price rallies to $1.42 with strong bullish momentum as technical indicators signal potential continuation despite ongoing investigation concerns.
EIGEN Price Falls 11.26% to $1.44 Amid Security Concerns Despite Technical Bullish Signals
EigenLayer (EIGEN) trades at $1.44 after an 11.26% daily decline as unauthorized token sale investigation overshadows positive technical momentum and Coinbase listing prospects.
EigenLayer (EIGEN) Price Drops 4.6% Despite Coinbase Listing News and Technical Partnership
EIGEN trades at $1.33 with mixed signals as unauthorized token sale investigation weighs on price despite Coinbase listing roadmap inclusion and Caldera partnership.
EigenLayer (EIGEN) Shows Bullish Momentum as Price Holds Above Key Moving Averages
EIGEN price trades at $1.38 with 0.73% daily gains. Technical indicators signal bullish momentum despite recent consolidation around key resistance levels.
** EIGEN Price Holds Above Key Support as EigenLayer Shows Mixed Technical Signals
** EIGEN trades at $1.36 (-4.75% today) with RSI neutral at 55.25. Bullish MACD histogram suggests potential recovery despite recent selling pressure in restaking protocol.
EigenLayer (EIGEN) Surges 12.33% as Technical Indicators Signal Bullish Momentum
EIGEN price climbs to $1.43 amid positive technical signals and strategic partnerships, with RSI at 59.75 showing room for further upside momentum.
EIGEN Price Tests $1.14 as Technical Indicators Flash Mixed Signals
EigenLayer (EIGEN) trades at $1.14 with modest 1.33% daily gains, but technical analysis reveals concerning bearish momentum despite neutral RSI positioning.
EigenLayer (EIGEN) Tests Critical Support at $1.03 Amid Bearish Momentum
EIGEN price trades at $1.12 (+0.99% daily) but faces bearish pressure with RSI at 38.65 and MACD showing negative momentum as token approaches key support levels.
EIGEN Price Hits $1.10 as EigenLayer Shows Mixed Signals Despite Technical Upgrade
EIGEN trades at $1.10 with +2.79% daily gains, but bearish momentum persists despite multi-chain verification launch as key support levels face pressure.
EigenLayer (EIGEN) Drops to $1.08 as Bearish Momentum Intensifies Despite Multi-Chain Launch
EIGEN price falls 3.75% to $1.08 as technical indicators signal continued weakness, with RSI at 34.68 despite recent multi-chain verification breakthrough.
EigenLayer (EIGEN) Drops to $1.29 Despite Multi-Chain Breakthrough
EIGEN trades at $1.29 after 6.3% weekly decline, with technical indicators showing mixed signals as EigenLayer advances multi-chain verification technology.
EigenLayer (EIGEN) Price Drops 6.3% Despite Multi-Chain Verification Launch
EIGEN price falls to $1.25 amid broader market weakness, testing crucial support levels despite recent positive technical developments including multi-chain verification.
El Salvador’s Bitcoin Fortune Nosedives with At Least $11M Loss: Bloomberg Analysts
With the crypto market witnessing massive liquidations affecting retail and institutional investors, El Salvador has also been on the receiving end with a loss of more than $11 million, given that it holds at least 1,391 Bitcoin, according to Bloomberg.
El Salvador Buys the Dip by Adding 100 Bitcoin to its Portfolio
After slipping to lows of $54,000, a scenario not seen in the last six weeks, El Salvador saw this as a perfect opportunity to buy the dip for additional 100 BTCs.
El Salvador Plans to Build 20 New Schools by Using Bitcoin Profits
El Salvador has started reaping from its Bitcoin investment because profits have started being channeled towards infrastructural development.
Elliptic Debunks Claims of Substantial Crypto Funding to Hamas
Elliptic, a blockchain analytics firm, refuted claims of significant cryptocurrency funding to Hamas, following a wave of reports and a letter from US lawmakers to the White House. The firm highlighted the lack of substantial evidence supporting the alleged $130 million crypto funding between August 2021 and June 2023. Despite historical endeavors by Hamas to solicit crypto donations, recent analysis reveals that the amounts garnered remain minuscule compared to the figures cited in misinformed reports.
Binance Confirms Equity Investment in Musk's Acquisition, Dogecoin Stimulated over Deal
The acquisition of Twitter by Elon Musk has finally been made. Binance confirmed the crypto exchange has invested as an equity investor in Elon Musk's $44 billion deal.
ENS Tests Lower Bollinger Band Support at $15.06 as Bearish Momentum Persists
Ethereum Name Service trades at $15.06 amid continued selling pressure, with technical indicators suggesting further downside risk as ENS approaches key support levels.
ENS Price Drops 2% as Bitcoin Correlation Weakens Amid Fed Rate Decision
Ethereum Name Service trades at $15.20 after Fed maintains rates, testing lower Bollinger Band support while Bitcoin correlation shows signs of decoupling.
ENS Trading Update: Support Zone Test Creates Strategic Entry Opportunity
ENS price trades at $20.06 with bearish momentum indicators suggesting potential bounce from lower Bollinger Band support at current levels.
ENS Price Drops 1.36% as Ethereum Name Service Tests Critical Support at $19.36
ENS trades at $19.62 after a 1.36% decline, approaching key support levels while technical indicators suggest oversold conditions may present buying opportunities.
ENS Price Drops 3.8% as Ethereum Name Service Tests Critical Support at $20
ENS price currently at $20.20 after falling 3.8% in 24h. Technical indicators suggest bearish momentum as Ethereum Name Service approaches key support levels.
ENS Price Analysis: Ethereum Name Service Tests Critical Support at $21 After Technical Breakdown
ENS trades at $21.08 with weak bullish signals as technical indicators suggest potential bounce from key support levels amid bearish momentum.
ENS Price Hovers Near Support at $21 as Technical Indicators Signal Oversold Conditions
Ethereum Name Service trades at $21.05 with ENS RSI at 35.67, suggesting potential bounce from Bollinger Band lower support amid weak bullish momentum.
ENS Price Drops 9.78% as Ethereum Name Service Tests Critical Support at $19.65
ENS price falls to $20.76 amid bearish momentum signals. Technical analysis shows ENS RSI at 34.60 with immediate support testing underway.
ENS Price Shows Bullish MACD Signal Despite 0.34% Daily Decline - Key Support at $21.90
Ethereum Name Service trades at $23.13 with bullish MACD momentum emerging despite short-term weakness, as ENS RSI holds neutral at 45.28 signaling potential reversal.
ENS Price Analysis: Ethereum Name Service Shows Bullish Momentum Despite 2.6% Daily Decline
ENS trades at $23.14 with bullish MACD signals emerging. Technical analysis reveals key resistance at $25.25 as Ethereum Name Service approaches critical support levels.
ENS Price Holds Above $23 Despite 2.3% Decline as Technical Indicators Show Mixed Signals
Ethereum Name Service trades at $23.78 with bearish pressure, but bullish MACD momentum and strong support at $21.50 suggest potential recovery ahead.
ENS Price Surges 4.78% as Ethereum Name Service Breaks Above Key Moving Averages
ENS trades at $24.33 with bullish momentum emerging as Ethereum Name Service reclaims critical technical levels and shows strong buying pressure near resistance.
ENS Price Holds Above $23 as Ethereum Name Service Shows Mixed Technical Signals
ENS trades at $23.18 (-0.34% today) with bullish MACD momentum offsetting neutral RSI readings as traders eye key $25.25 resistance level ahead.
ENS Price Shows Bullish Momentum Above $23 as Technical Indicators Signal Recovery
ENS trades at $23.44 (+2.13% today) with MACD histogram turning positive and price holding above key support levels, suggesting potential upside continuation.
ENS Price Drops 4% as Ethereum Name Service Tests Critical Support at $21.50
ENS trades at $23.13 after a 3.94% decline, with technical analysis showing mixed signals as the token approaches key support levels.
ENS Price Analysis: Ethereum Name Service Shows Mixed Signals Near $24 Support
ENS trades at $23.93 after a 4.89% daily decline, testing key support levels while technical indicators suggest potential bullish momentum building.
ENS Price Analysis: Ethereum Name Service Tests $25 After 4% Daily Surge
ENS price reaches $25.15 with 4.18% gains as Ethereum Name Service technical analysis shows bullish momentum emerging despite mixed signals from key indicators.
ENS Price Surges 2.66% Above $24 as Bullish Momentum Builds
Ethereum Name Service trades at $24.33 with strong technical indicators suggesting continued upward movement. ENS RSI neutral at 52 while MACD shows bullish divergence.
ENS Price Analysis: Ethereum Name Service Shows Bullish Momentum Despite Mixed Signals
ENS trades at $23.60 (+3.55% today) with bullish MACD histogram and neutral RSI presenting mixed technical signals for traders watching key resistance levels.
ENS Price Analysis: Ethereum Name Service Shows Mixed Signals as RSI Holds Neutral Territory
ENS trades at $22.91 (-1.04% in 24h) with bullish MACD momentum emerging despite neutral RSI readings and declining short-term moving averages.
ENS Price Analysis - Ethereum Name Service Shows Mixed Signals at $22.87
ENS trades at $22.87 with 3.11% daily gains, but technical indicators reveal conflicting signals as the token navigates between key support and resistance levels.
ENS Price Struggles Below Key Resistance as Technical Indicators Signal Mixed Outlook
Ethereum Name Service trades at $22.25 with modest 0.72% gains, but ENS price faces headwinds below crucial resistance levels as momentum indicators show bearish divergence.
ENS Price Analysis: Ethereum Name Service Shows Mixed Signals at $22.12
ENS trades at $22.12 with neutral RSI at 39.3, facing resistance near $28 while holding above key support at $21.50 in today's technical analysis.
ENS Price Analysis: Ethereum Name Service Tests Critical Support at $22.56 Amid Mixed Signals
ENS trades at $22.56 with +0.45% daily gains as technical indicators show neutral momentum while price action hovers near key support levels around $21.50.
ENS Price Drops to $22.45 as Ethereum Name Service Tests Critical Support Levels
ENS trades at $22.45 (-0.31% today) near crucial $21.50 support zone. Technical indicators suggest consolidation phase with mixed signals for traders.
ENS Price Surges 3.26% as Layer 2 Migration Begins - Will ENS Break $28 Resistance?
ENS price climbs to $22.80 (+3.26%) following Layer 2 migration news. Technical analysis shows mixed signals with RSI at 41.11 and key resistance at $28.09.
ENS Price Holds Above Key Support at $22.59 as Technical Indicators Show Mixed Signals
Ethereum Name Service trades at $22.59 (+1.30% today) near crucial support levels while ENS RSI suggests potential oversold bounce opportunity for traders.
ENS Price Analysis: Ethereum Name Service Tests $21.67 Support as RSI Shows Neutral Signals
ENS trades at $22.84 (-2.39% in 24h) near critical support levels. Technical indicators suggest mixed signals as Ethereum Name Service hovers close to lower Bollinger Band.
ENS Price Faces Bearish Pressure Despite Ethereum's Bullish Rally Above $4,900
ENS trades at $23.39 with mixed signals as Ethereum hits new highs but technical indicators show weakening momentum for the domain service token.
ENS Price Drops 0.30% as Ethereum Name Service Tests Lower Bollinger Band Support
ENS trades at $23.14 after a slight decline, with technical indicators showing mixed signals as the token approaches key support levels near $22.74.
ENS Price Falls 4.76% as Ethereum Name Service Tests Key Support at $23.19
ENS drops to $23.19 amid bearish momentum, with technical indicators pointing to potential further downside as Ethereum Name Service approaches critical support levels.
ENS Price Analysis: Ethereum Name Service Tests Support at $23.98 Amid Bearish Momentum
ENS trades at $23.98 (-2.52% in 24h) near crucial support levels as technical indicators signal potential further downside pressure for Ethereum Name Service.
ENS Price Drops 6% Despite Ethereum's Rally - Technical Analysis Shows Mixed Signals
ENS trades at $25.27 after a 5.99% decline, testing key support levels while Ethereum Name Service technical analysis reveals neutral RSI and bearish momentum indicators.
ENS Price Analysis: Ethereum Name Service Tests $27 Amid Rebranding Momentum
ENS trades at $27.00 (+3.17%) following strong week driven by rebranding announcement. Technical indicators show mixed signals as price consolidates near resistance.
ENS Price Drops 8.3% Despite Positive Ecosystem Developments - Technical Analysis Points to Key Support Test
ENS trades at $27.22 after an 8.29% decline, testing crucial support levels while ecosystem developments suggest long-term strength amid short-term bearish momentum.
ENS Price Surges 5.06% to $29.70 as Technical Indicators Flash Bullish Signals
ENS trades at $29.70 with 5.06% daily gains as Ethereum Name Service technical analysis reveals bullish MACD momentum and strong resistance test at $32.21 zone.
ENS Price Drops 4.25% Despite Recent Rebranding Boost - Can Bulls Defend $27 Support?
Ethereum Name Service trades at $27.71 after a 4.25% decline, testing key support levels despite positive rebranding news driving earlier gains this week.
ENS Price Surges Above $28 as Ethereum Name Service Rebranding Drives Bullish Momentum
ENS trades at $28.81 with strong technical signals following recent rebranding announcement, while Ethereum Name Service shows mixed indicators amid market volatility.
ENS Price Analysis: Ethereum Name Service Shows Bullish Momentum Despite Recent Pullback
ENS trades at $29.25 after a 1.78% daily decline, but technical indicators signal continued strength with price holding above key moving averages and RSI in neutral territory.
ENS Price Surges 4.97% to $29.12 as Technical Indicators Flash Mixed Signals
ENS trades at $29.12 with a 4.97% daily gain, showing bullish momentum above key moving averages despite bearish MACD divergence signaling potential consolidation ahead.
ENS Price Holds $26.15 as Mixed Technical Signals Create Trading Opportunity
Ethereum Name Service trades at $26.15 with neutral RSI at 50.93, showing conflicting momentum signals as traders navigate post-ETF volatility and profit-taking pressure.
ENS Price Struggles at $25.84 as Ethereum Name Service Shows Conflicting Technical Signals
ENS trades at $25.84 down 2.31% today, caught between bearish MACD divergence and bullish long-term trend as post-ETF volatility continues affecting price action.
ENS Price Recovers to $26.08 as Ethereum Name Service Shows Mixed Technical Signals
ENS trades at $26.08 (+3.99% in 24h) after recovering from recent profit-taking selloff, with technical indicators showing conflicting signals amid post-ETF volatility.
ENS Price Analysis: Ethereum Name Service Tests Lower Bollinger Band at $25.00
ENS trades at $25.00 after 0.91% decline, approaching lower Bollinger Band support with bearish MACD momentum despite maintaining bullish long-term trend above key moving averages.
ENS Price Retreats to $25.25 Despite Exchange Outflows as Technical Indicators Turn Mixed
Ethereum Name Service trades at $25.25 (-2.55%) as bulls pause following last week's 60% surge driven by 250K token withdrawals from exchanges.
ENS Price Drops 8.16% to $25.53 Despite Recent Ethereum ETF Rally Momentum
Ethereum Name Service retreats to $25.53 after hitting $28.56 highs, with ENS RSI at 48.21 signaling potential oversold bounce opportunity ahead.
** ENS Price Analysis: Ethereum Name Service Rallies to $28.56 Amid ETF Surge
** ENS trades at $28.56 with bullish momentum following Ethereum ETF launches. Technical indicators show neutral RSI at 61.72 while massive exchange withdrawals signal accumulation.
ENS Price Falls 4.14% Despite Strong Bullish Trend - Key Levels to Watch
Ethereum Name Service trades at $27.81 after a 4.14% daily decline, but technical indicators suggest the overall bullish momentum remains intact with key support at $20.85.
ENS Price Drops 5.3% Despite Strong Bullish Trend - Key Levels to Watch
Ethereum Name Service trades at $29.43 after a 5.3% daily decline, but technical indicators suggest the broader uptrend remains intact with ENS RSI at 65.60.
ENS Price Retreats 6.5% Despite Strong Bullish Momentum Following Exchange Exodus
ENS trades at $29.14 after yesterday's pullback, but technical indicators remain bullish with RSI at 65.31 and MACD signaling continued upward momentum.
ENS Price Explodes 60% as 250,000 Tokens Exit Exchanges - Technical Breakout Continues
ENS trades at $30.61 (+1.93%) following massive exchange outflows and Ethereum ETF launch momentum, but RSI signals caution for new buyers entering positions.
ENS Price Surges 9.7% as Ethereum ETF Momentum Continues - Technical Breakout in Play
ENS trades at $30.39 (+9.71% daily) as Ethereum ETF partnerships and record domain registrations fuel bullish momentum with ENS RSI hitting overbought levels at 75.89.
ENS Price Surges 3.09% as Ethereum Name Service Shows Strong Bullish Momentum
ENS price hits $27.71 with bullish technical indicators pointing to potential breakout above $30 resistance as Ethereum Name Service RSI remains in neutral territory.
ENS Price Surges 5.6% as Ethereum ETF Launch Drives Momentum - Technical Analysis Shows Overbought Conditions
ENS trades at $29.32 (+5.62% daily) following Ethereum ETF approval and Bitwise partnership. Technical indicators signal strong bullish trend but overbought conditions emerge.
ENS Faces Correction Despite 50% Rally - Technical Analysis Shows Key Levels
Ethereum Name Service trades at $27.26 (-4.25% daily) after massive 50% surge. RSI at 70 signals overbought conditions while resistance looms at $30.16.
ENS Price Surges 50% Following Technical Breakout and Record Domain Registrations
Ethereum Name Service trades at $28.58 after breaking key resistance, with ENS RSI hitting overbought levels as domain registrations reach all-time highs.
Captide Transforms Equity Research with LangGraph and LangSmith Integration
Captide revolutionizes financial analysis by integrating LangGraph and LangSmith, offering unparalleled efficiency in extracting insights from financial data.
ETH Price Prediction: Ethereum Targets $3,350-$3,450 Range in December 2025 Rally
ETH price prediction shows bullish momentum building with technical indicators supporting a move to $3,350-$3,450 by year-end, despite current consolidation phase.
ETH Price Prediction: Targeting $3,537 Within 7 Days as Technical Momentum Builds
Ethereum shows bullish momentum with MACD histogram turning positive. ETH price prediction targets $3,537 short-term, supported by analyst consensus and technical breakout signals.
ETH Price Prediction: Target $3,537 Within 5 Days as Technical Momentum Builds
ETH price prediction points to $3,537 target in 5 days based on bullish MACD momentum and analyst consensus. Current $3,106 presents strategic entry opportunity.
ETH Price Prediction: Target $3,400-$3,550 by Year-End with $4,295 Extension Possible
ETH price prediction points to $3,400-$3,550 short-term targets as Ethereum breaks key resistance. Bullish momentum building toward potential $4,295 extension.
ETH Price Prediction: $4,200 Target by January with Potential Rally to $7,500
Ethereum technical analysis suggests ETH could reach $4,200 by January 2025, with bullish momentum building despite current weakness below key moving averages.
ETH Price Prediction: Targeting $3,400 by Year-End with $3,850 Medium-Term Upside
ETH price prediction shows bullish momentum building despite recent consolidation, with technical indicators supporting a move to $3,400 short-term and $3,850 medium-term targets.
ETH Price Prediction: Ethereum Targets $3,400 by December 20 Before Year-End Consolidation
ETH price prediction shows bullish momentum toward $3,400 resistance within two weeks, supported by MACD histogram turning positive at 57.98 despite neutral RSI conditions.
ETH Price Prediction: Targeting $3,400-$3,850 by Mid-December 2025 Amid Bullish Momentum Recovery
ETH price prediction points to $3,400-$3,850 target within 2 weeks as technical indicators show emerging bullish momentum despite trading below key moving averages.
ETH Price Prediction: Recovery to $3,200-$3,400 Expected by Mid-December 2025
Ethereum forecast points to 14-21% upside potential as ETH shows bullish MACD divergence and approaches oversold territory, targeting $3,200-$3,400 range within two weeks.
ETH Price Prediction: Ethereum Eyes $3,300 Recovery by Mid-December 2025 Despite Current Weakness
ETH price prediction targets $3,300-$3,400 range within 2 weeks as technical indicators show mixed signals with bullish MACD momentum fighting oversold conditions.
ETH Price Stabilizes at $3,031 as BitMine's $9 Billion Ethereum Holdings Signal Institutional Confidence
Ethereum trades at $3,031.04 following BitMine's expansion to 3.63 million ETH holdings, while technical indicators show mixed signals ahead of the Fusaka upgrade.
ETH Price Prediction: Targeting $3,500-$4,000 Rally Through December 2025
Ethereum technical analysis points to $3,500-$4,000 price target by year-end, with bullish MACD momentum and key support at $2,900 level setting up potential breakout.
ETH Price Prediction: Targeting $3,100-$3,200 by December 2025 Despite Mixed Signals
ETH price prediction points to $3,100-$3,200 target within 2-3 weeks as technical indicators show early bullish momentum despite trading below key moving averages.
Ethereum Rebounds 3% Above $3,000 as Technical Indicators Signal Potential Bullish Momentum Shift
ETH price recovers to $3,033.24 with improving MACD histogram suggesting momentum building despite trading below key moving averages in quiet news cycle.
ETH Consolidates Near $2,927 as Technical Indicators Signal Potential Bullish Momentum Shift
Ethereum trades at $2,927.29 with modest 0.6% gains as MACD histogram shows early bullish divergence despite price remaining below key moving averages in thin holiday trading.
ETH Price Prediction: Ethereum Targets $3,400 Despite Technical Headwinds - 7-Day Forecast Analysis
ETH price prediction shows mixed signals as Ethereum trades at $2,950 with bullish MACD momentum but faces resistance at $3,132. Target: $3,400 within 7 days.
ETH Price Prediction: Ethereum Eyes $3,170 Recovery Target Within 5 Days Despite Oversold Conditions
ETH price prediction points to $3,170 target as oversold RSI at 27.28 signals potential bounce from current $2,743 level, with analysts forecasting 10-15% upside.
Ethereum Crashes to Nine-Month Low at $2,800 as $500B Crypto Market Selloff Intensifies
ETH price plunged to $2,761.32 amid a brutal crypto market selloff that erased over $500 billion in value, driven by escalating U.S.-China trade tensions and aggressive Fed policy shifts.
ETH Price Prediction: Ethereum Eyes $3,200 Recovery After Oversold Bounce - Bull Target $4,455
ETH price prediction targets $3,200 within one week as oversold RSI signals potential bounce from $2,665 support, with bullish case targeting $4,455.
ETH Tests $3,000 Pivot as Whale Accumulation Offsets Technical Weakness
Ethereum trades at $3,037.24 amid $1.38B whale accumulation, but technical indicators show bearish momentum as ETH price struggles below key moving averages in consolidation phase.
ETH Price Prediction: Targeting $4,300-$4,800 Range by December 2025 Despite Current Technical Weakness
ETH price prediction suggests recovery to $4,300-$4,800 range within 4-6 weeks, though current bearish momentum at $3,051 requires break above $3,539 resistance first.
ETH Price Prediction: Ethereum Eyes $3,757 Recovery Rally in Next 5 Days
ETH price prediction indicates potential 23.6% surge to $3,757 as technical indicators signal oversold bounce from current $3,040 support level.
ETH Rebounds to $3,131 Despite $177M BlackRock Ethereum ETF Outflow Creating Market Pressure
Ethereum recovers to $3,131.51 (+2.47%) after testing $2,946 lows, as BlackRock's massive ETF selling pressure creates technical uncertainty around key support levels.
ETH Price Prediction: Ethereum Eyes $3,900 Recovery Within 5 Days as Technical Indicators Signal Oversold Bounce
ETH price prediction targets $3,900 short-term recovery from current oversold levels at $3,059, with medium-term Ethereum forecast reaching $4,400-$5,500 range.
ETH Outflows Pressure Price to $3,198 as Institutional Demand Shifts
Ethereum trades at $3,198.25 amid $177M ETF outflows, testing technical support as institutional flows create headwinds despite positive adoption signals from 21Shares launch.
ETH Price Prediction: Ethereum Eyes $3,934 Target as Technical Indicators Signal 23% Upside by December 2025
ETH price prediction points to $3,934 short-term target with medium-term Ethereum forecast reaching $4,300-$4,800 range, supported by upcoming Fusaka upgrade.
Ethereum Whales Accumulate $1.37B as ETH Tests Lower Bollinger Band at $3,159
ETH trades at $3,159.27 near critical support as institutional whales deploy $1.37B during November's 12% correction, while 21Shares launches new crypto index ETFs.
ETH Price Prediction: Ethereum Eyes $3,750-$3,815 Recovery Despite Technical Weakness
ETH price prediction targets $3,750-$3,815 by November 30 as analysts see recovery potential despite current bearish momentum signals.
ETH Price Prediction: Targeting $4,200 Recovery by December 2025 Despite Current Bearish Signals
Ethereum faces immediate support test at $3,057 but analyst targets of $4,295 suggest December recovery potential if key resistance breaks.
ETH Tests $3,300 Support as 21Shares Launches Multi-Crypto ETFs Amid Broader Market Weakness
Ethereum trades at $3,302.81 down 3.1% as new institutional crypto ETF launches provide positive backdrop while broader market weakness weighs on ETH price action.
ETH Price Prediction: Targeting $4,200 Resistance Break Within 2 Weeks Despite Current Bearish Momentum
ETH price prediction suggests potential rally to $4,200-$4,250 resistance zone within two weeks if bulls can defend $3,400 support, despite MACD showing bearish momentum.
Ethereum Consolidates Above $3,500 as Technical Indicators Signal Mixed Momentum
ETH price holds $3,547 with modest 1.15% gains as traders eye key resistance levels while momentum indicators show neutral-to-bearish divergence in absence of major catalysts.
ETH Rallies 5.5% to $3,559 as Technical Indicators Signal Potential Breakout Above Key Moving Averages
Ethereum price climbs to $3,559.22 in strong 5.5% daily gain, breaking above 7-day moving average as traders eye potential test of $3,750 resistance level in absence of major catalysts.
ETH Price Prediction: Ethereum Eyes $3,757 Target Amid Technical Consolidation - December Forecast Shows 11.76% Upside Potential
ETH price prediction targets $3,757 in the next week with analysts forecasting 11.76% gains by December 7th. Technical analysis reveals mixed signals as Ethereum tests key support.
ETH Price Prediction: Ethereum Targets $4,295 by November 15th Despite Current Bearish Momentum
ETH price prediction points to $4,295 short-term target as analysts forecast 10-25% gains despite current technical weakness at $3,438 support level.
ETH Price Prediction: $4,200 Breakout Target Within 2 Weeks, But $3,100 Risk Looms
ETH price prediction suggests a potential rally to $4,200-$4,300 by late November, though bears could drive prices to $3,100 if current support fails.
Ethereum Crashes Below $3,300 as $1.3 Billion Crypto Sell-Off Intensifies Amid Fed Rate Uncertainty
ETH price plunges to $3,288.53 (-5.8%) as Federal Reserve hawkish commentary triggers massive liquidations, pushing Ethereum below critical $3,500 support level in broader market rout.
ETH Price Prediction: Targeting $4,200-$4,600 Recovery Within 2-3 Weeks Despite Current Oversold Conditions
Ethereum shows oversold signals at $3,330 with RSI at 31.27, creating potential for bounce to $4,200-$4,600 range as historical November patterns suggest bullish momentum ahead.
ETH Price Prediction: $4,200-$4,500 Target by December 2025 as Ethereum Tests Critical Support
ETH price prediction points to $4,200-$4,500 recovery by December 2025 as Ethereum bounces from $3,638 Bollinger Band support with bullish divergence signals emerging.
ETH Tests $3,800 Support as Technical Consolidation Continues Below Key Moving Averages
Ethereum trades at $3,827.61, down 1.16% as ETH price consolidates below the 20-day moving average amid neutral RSI readings and emerging bullish MACD divergence signals.
ETH Price Prediction: Ethereum Targets $4,200-$4,500 by December 2025 as Technical Indicators Signal Bullish Momentum
ETH price prediction suggests targets of $4,200-$4,500 by December 2025, with bullish MACD histogram and strong support at $3,674 confirming upward momentum despite neutral RSI.
Ethereum Drops Below $4,000 as Fed Signals End to Rate Cuts, Fusaka Upgrade Testing Continues
ETH price trades at $3,876.42 after falling 2.2% following Federal Reserve Chair Powell's indication that the latest rate cut may be the last of 2025, while Fusaka upgrade enters final testing p...
ETH Price Prediction: Targeting $4,300-$4,400 by Mid-November 2025
Ethereum shows bullish momentum with MACD histogram turning positive. ETH price prediction targets $4,300-$4,400 range within 2 weeks based on technical breakout patterns.
ETH Tests $3,800 Support as Technical Consolidation Continues Below Key Moving Averages
Ethereum trades at $3,817.52 with modest 1.7% gains as ETH price consolidates below critical resistance levels while Bitcoin correlation remains strong in absence of major catalysts.
ETH Price Prediction: Targeting $4,295 by November 4th with Potential Rally to $5,765
ETH price prediction shows bullish momentum building despite recent correction, with technical analysis pointing to $4,295 short-term target and potential breakout above $5,765.
ETH Price Prediction: Ethereum Targets $4,500 by November as Technical Setup Favors Bulls
ETH price prediction shows Ethereum eyeing $4,500 in the next 2-3 weeks, with current consolidation above $3,900 support setting up potential breakout above $4,060 resistance.
ETH Price Prediction: Ethereum Eyes $4,350 Target Despite Near-Term Headwinds
ETH price prediction targets $4,350 within 2-3 weeks as Ethereum tests critical $3,814 pivot point, with potential for $4,943 if bulls reclaim momentum
ETH Price Prediction: Ethereum Targets $4,500 by November 2025 Despite Near-Term Consolidation
Current ETH price prediction indicates potential rally to $4,500 within 4 weeks, though immediate consolidation between $3,915-$4,200 expected as Ethereum faces mixed technical signals.
ETH Tests Key Support at $3,892 as Technical Indicators Flash Mixed Signals
Ethereum trades at $3,892.14 following a 3.5% decline, testing critical support levels as RSI shows neutral conditions amid broader crypto market weakness.
ETH Hits $4,073 as Record Transaction Volume Signals Strong Network Demand
Ethereum trades at $4,073.21 with 4.7% daily gains as network transactions surge to unprecedented 1.6-1.7M daily, while exchange reserves hit nine-year lows signaling bullish accumulation.
ETH Consolidates Near $3,900 as Technical Indicators Signal Neutral Momentum Amid Quiet News Cycle
Ethereum trades at $3,901.18 with modest 1.45% gains as ETH price action remains constrained below key moving averages while traders await fresh catalysts to drive directional momentum.
ETH Tests Lower Bollinger Band Support as Technical Correction Deepens Below $3,900
Ethereum trades at $3,822.54 down 2.15% as ETH price action tests critical support near $3,435 amid ongoing technical correction from October highs.
ETH Tests Critical $4,000 Support as Network Activity Hits Record Highs Despite 2.7% Daily Decline
Ethereum trades at $3,990 as record transaction volumes clash with technical selling pressure, creating key inflection point for traders watching $4,000 psychological support.
ETH Plunges 13% to $3,786 as Technical Breakdown Triggers Widespread Selling
Ethereum crashes to $3,786 amid bearish technical signals, breaking below key moving averages with $6.8 billion in trading volume as selling pressure intensifies.
ETH Analysis: Second-Largest Crypto Shows Technical Neutrality Despite Market Weakness
Ethereum trades at $4,348 with neutral RSI at 48.9, maintaining distance above 200-day moving average while broader crypto sentiment remains bearish across markets.
ETH Technical Setup Shows Consolidation Above Key Moving Averages With Resistance at 4755
Ethereum trades at $4,448.95 with minimal 24h gains as ETH maintains position above critical technical levels while approaching key resistance zones.
Ethereum Tests Critical Support as Technical Indicators Signal Potential Reversal Zone
ETH trades at $4,479.89 after a 4.76% decline, approaching key support levels while maintaining bullish positioning above major moving averages.
Ethereum Breaks Above Key Moving Averages as ETH Price Surges 52% Above 200-Day SMA
Ethereum trades at $4,637 with strong momentum above all major moving averages, showing 52% premium to 200-day SMA as technical indicators signal continued bullish pressure.
ETH Consolidates Above Key Support as Bulls Eye $4,644 Resistance Break
Ethereum trades at $4,538 with modest 1.2% daily gains as technical indicators signal potential upside momentum toward major resistance levels ahead.
ETH Technical Setup: Strong Momentum Above Key Moving Averages with Bullish MACD Signal
Ethereum trades at $4,474.66, up 1.93% in 24 hours, showing technical strength above all major moving averages with RSI in neutral territory allowing for continued upside.
ETH Consolidates Below Key Moving Averages as SEC ETF Streamlining Provides Limited Boost
Ethereum trades at $4,143.71 with modest declines as streamlined SEC ETF approval process fails to sustain earlier gains despite positive regulatory developments.
ETH Consolidates Above $4,000 as Bears Test Critical Support Zone
Ethereum trades at $4,182.87 with 1.85% daily gains, but technical indicators suggest consolidation phase as price remains below key moving averages.
Ethereum Market Alert: ETH Battles Below $4,200 as Institutional ETF Flows Surge Despite On-Chain Outflows
Ethereum trades at $4,103 (+2.6%) as conflicting signals emerge - massive ETF inflows of $1.12B counter $274M on-chain outflows, creating critical technical setup.
ETH Price Tests $4,000 Support as Technical Indicators Flash Mixed Signals
Ethereum trades at $4,009 with bearish momentum indicators despite maintaining bullish long-term trend above key support levels.
ETH Price Falls to $3,946 as Technical Indicators Flash Mixed Signals
Ethereum drops 1.53% to $3,946 amid bearish momentum, but institutional ETF flows remain strong. Key support at $3,815 comes into focus for ETH traders.
Ethereum Price Drops to $3,995 as ETH RSI Signals Oversold Conditions Despite $7,500 Target
ETH trades at $3,995 (-4.42%) near critical support levels as technical indicators show oversold conditions while Standard Chartered raises price target to $7,500.
Ethereum (ETH) Tests Lower Support as Bears Gain Control Near $4,180
ETH price hovers at $4,180 with RSI at 40, signaling potential further downside despite SEC's streamlined ETF approval process reducing timeline to 75 days.
Ethereum (ETH) Price Drops 3% Amid Mixed Institutional Signals and Bearish Technical Setup
ETH trades at $4,168 down 3.07% as technical indicators show bearish momentum despite Citigroup's $4,300 year-end target and DeepSeek's bullish forecast.
ETH Price Drops 6.6% as Ethereum Tests Critical $4,000 Support Zone
Ethereum trades at $4,192 after breaking below key moving averages, with technical indicators pointing to potential decline toward $4,250 support level.
Ethereum (ETH) Price Holds Above $4,400 Despite Mixed Analyst Signals
ETH trades at $4,469.73 with neutral momentum as Citigroup's conservative $4,300 target contrasts with bullish $5,200 predictions from other analysts.
Ethereum Price Retreats to $4,473 Despite Strong Weekly Gains - ETH Technical Analysis
ETH trades at $4,473.20 (-1.41% daily) after hitting $4,759.96 this week. Citigroup's $4,300 year-end target creates resistance as technical indicators show mixed signals.
Ethereum (ETH) Holds Above $4,500 Despite Market Uncertainty - Citigroup Sets $4,300 Target
ETH trades at $4,535.67 (-0.69% today) as Citigroup's conservative $4,300 year-end target contrasts with strong technical indicators showing bullish momentum.
ETH Price Consolidates Near $4,600 as Stablecoin Liquidity Hits $171B Record
Ethereum trades at $4,574 (+1.80%) while consolidating below key resistance. Massive stablecoin liquidity and $77.6M outflows signal accumulation despite sideways action.
Ethereum (ETH) Holds Above $4,500 as Citigroup Projects Conservative Year-End Target
ETH trades at $4,506 with bullish technical momentum while Citigroup sets cautious $4,300 year-end target amid growing network activity and institutional interest.
ETH Price Holds $4,437 as Whale Activity and Technical Indicators Signal Mixed Momentum
Ethereum trades at $4,437 amid $86M whale purchase and Citigroup's $4,300 target, while ETH RSI remains neutral despite bullish MACD signals.
Ethereum (ETH) Tests Key Support at $4,516 as Bulls Fight Back
ETH price drops 3.02% to $4,516.22 but technical indicators suggest bullish momentum may return. Strong support at $4,211 offers buying opportunity for traders.
Ethereum Price Analysis: ETH Tests $4,659 Amid Mixed Signals and Fusaka Fork Anticipation
ETH trades at $4,659 (-1.41% daily) near Bollinger Band resistance as September correction creates potential buying opportunity while Fusaka hard fork development progresses.
Ethereum Breaks Above $4,700 as ETH Gains 4.34% Following SharpLink's $3.7B Treasury Move
ETH price surges to $4,717 with strong momentum indicators flashing bullish signals after major institutional investment announcement.
Ethereum Price Surges to $4,513 as SharpLink's $3.7B Investment Sparks ETH Rally
ETH trades at $4,513 (+1.94%) following SharpLink's massive $3.7 billion treasury allocation, with technical indicators showing bullish momentum above key support levels.
Ethereum Price Analysis: ETH Holds Above $4,300 as Bulls Target $4,950 Resistance
ETH trades at $4,367 (+0.36%) with strong bullish momentum intact. Technical indicators suggest potential breakout toward $5,000 despite recent September correction concerns.
Ethereum (ETH) Holds Strong Above $4,350 Despite September Seasonality Concerns
ETH trades at $4,352.99 with 1.14% daily gains as ecosystem tokens surge triple-digits, defying historical September weakness patterns.
Ethereum (ETH) Tests Neutral Territory at $4,300 Amid Fed Rate Cut Speculation
ETH price trades at $4,300.23 with neutral RSI signals as September volatility emerges following Federal Reserve rate cut expectations and technical scalability updates.
ETH Breaks $4,300 Despite Mixed Signals - Institutional Flows vs September Weakness
Ethereum trades at $4,302.88 (+0.22% daily) as $4B August ETF inflows clash with historical September selloff patterns and bearish MACD divergence.
Ethereum (ETH) Price Tests $4,290 Support as Technical Indicators Flash Mixed Signals
ETH trades at $4,294.53 (-2.82% daily) as momentum indicators suggest potential reversal near key support levels amid neutral RSI conditions.
Ethereum (ETH) Tests $4,300 Support as September Pullback Concerns Mount
ETH price drops 1.02% to $4,327, testing key support amid record ETF inflows but September seasonality fears. Technical indicators show mixed signals.
Ethereum Consolidates Near $4,377 After Recent All-Time High Rally
ETH trades at $4,377 with neutral momentum following last week's record-breaking surge to $4,956, as traders assess next moves amid Fed rate cut optimism.
ETH Price Holds $4,300 Despite Bearish MACD as Institutional Money Pours In
Ethereum trades at $4,339 (-1.26%) amid mixed signals: bearish MACD contrasts with massive $4B ETF inflows and whale accumulation driving long-term bullish outlook.
Ethereum (ETH) Consolidates Near $4,400 Despite Record Institutional Inflows
ETH price holds steady at $4,388 amid massive $4B ETF inflows and $654M private financing, while technical indicators suggest potential volatility ahead.
Ethereum (ETH) Price Analysis: Pullback from All-Time High as Momentum Shifts
ETH trades at $4,396.76 (-1.22%) after hitting record $4,953.73. Technical indicators show bearish momentum despite strong institutional support and VanEck's commitment to core development.
Ethereum (ETH) Tests Key Support at $4,453 After All-Time High Rejection
ETH price currently at $4,453.93 (+1.24% in 24h) faces potential pullback to $4,400 support despite record $320B monthly transaction volume driving institutional confidence.
Ethereum ETH Price Holds Above $4,390 as Bulls Eye Fresh All-Time Highs
ETH trades at $4,392 after recently breaking 2021 highs. Technical indicators show mixed signals while institutional demand drives bullish momentum.
Ethereum (ETH) Pulls Back to $4,349 Despite Breaking All-Time High This Week
ETH trades at $4,349 (-5.62% today) after hitting new highs above $4,945. Technical indicators show mixed signals as institutional money flows continue.
Ethereum (ETH) Retreats 6% After Historic $4,956 Peak - Critical Support Test Ahead
ETH trades at $4,477.50 (-3.03%) following pullback from all-time high. Technical indicators suggest potential decline to $4,400 support level as momentum weakens.
Ethereum (ETH) Pulls Back to $4,289 After Testing $4,724 Annual High
ETH price retreats 5.53% to $4,289 following massive whale accumulation and institutional inflows that drove Ethereum to yearly highs above $4,700 this week.
Ethereum (ETH) Consolidates Near $4,459 as Bulls Eye $12K Target Amid Record ETF Inflows
ETH price holds above $4,450 following record $3B ETF inflows and bullish analyst forecasts, with technical indicators suggesting potential breakout toward $4,788 resistance.
ETH Price Retreats to $4,415 Despite Bullish Institutional Momentum - Key Levels to Watch
Ethereum trades at $4,415 (-4.89% today) as short-term profit-taking emerges despite record $3B ETF inflows and Standard Chartered's $7,500 year-end target.
Ethereum (ETH) Holds $4,500 Support Despite Pullback From $4,788 High
ETH price trades at $4,557 after a 3.88% daily decline, with technical indicators showing overbought conditions as institutional optimism drives long-term targets to $7,500.
Ethereum Surges Past $4,700 as Institutional FOMO Drives ETH to New Highs
ETH price hits $4,723.84 (+3.06% in 24h) as Standard Chartered raises year-end target to $7,500, signaling continued institutional bullishness despite overbought RSI conditions.
Ethereum Soars Past $4,600 as ETH Bulls Target $5,000 Resistance
ETH surges 8.67% to $4,604.80, hitting a new 52-week high as institutional adoption and bullish technicals fuel momentum toward the next major resistance level.
Ethereum Hits New Yearly High at $4,300 as Institutional Demand Drives ETH Breakout
ETH price surges to $4,300 amid BlackRock's massive accumulation and technical breakout from 45-month pattern, though overbought conditions signal caution ahead.
Ethereum Breaks $4,300 Resistance as ETH Price Surge Continues on Record Network Activity
ETH trades at $4,297 after breaking key resistance, with technical indicators showing overbought conditions but strong bullish momentum intact.
Ethereum (ETH) Breaks Above $4,200 as Whale Accumulation Fuels 6% Rally
ETH trades at $4,232 with strong bullish momentum as whales accumulate $667M, pushing Ethereum through key resistance levels despite overbought RSI conditions.
ETH Price Breaks 45-Month Pattern as Ethereum Surges Past $4,000 Resistance
Ethereum trades at $4,048.74 (+3.22%) after breaking from multi-year triangle pattern, driven by $222M ETF inflows and institutional accumulation signals.
Ethereum (ETH) Surges 7.38% to $3,928 Despite ETF Outflow Concerns
ETH price rallies to $3,928 (+7.38%) as network activity hits yearly highs, but record ETF outflows and technical resistance at $3,969 signal potential headwinds ahead.
Ethereum Price Consolidates Near $3,677 After Historic $5.4B ETF Inflows Drive 56% July Surge
ETH trades at $3,676.83 (+2.54% daily) as record Ethereum ETF inflows of $5.4 billion fuel bullish momentum, with technical indicators showing neutral RSI at 58.86.
Ethereum (ETH) Consolidates at $3,532 After July's 56% Rally - Bulls Eye $3,941 Resistance
ETH price trades at $3,532 (+2.27% today) as bulls test key resistance levels following record July gains driven by massive ETF inflows and institutional adoption.
Ethereum (ETH) Retreats to $3,446 Despite July's 56% Rally - Key Support Levels in Focus
ETH price drops 2.16% to $3,446.70 amid profit-taking after July's massive gains. Technical indicators show mixed signals as Ethereum tests crucial support zones.
Ethereum (ETH) Retreats to $3,523 Despite Record July Rally - Technical Signals Mixed
ETH trades at $3,523 (-4.21% daily) after July's stellar 54.83% gain. Mixed technical signals emerge as institutional inflows continue despite short-term pullback.
ETH Price Drops 6% as Ethereum Tests Key Support Levels
Ethereum trades at $3,624 after a 6% daily decline. Technical indicators show mixed signals as ETH approaches critical support zones near $2,932.
ETH Price Surges to $3,859 as Regulatory Clarity Fuels 54% July Rally
Ethereum trades at $3,859.74 (+1.33% in 24h) as the GENIUS Act and institutional ETF inflows drive July's remarkable 54% price surge despite overbought RSI signals.
ETH Price Surges to $3,787 as Ethereum Technical Analysis Shows Overbought Conditions
Ethereum trades at $3,787.74 with ETH RSI hitting 74.91, signaling overbought territory as bullish momentum continues despite daily volatility concerns.
Ethereum Surges Above $3,770 as ETH Price Eyes $4,000 Breakthrough Despite Market Volatility
ETH price hits $3,776 with 0.91% daily gains as institutional accumulation and The Ether Machine's $1.6B Nasdaq debut fuel bullish momentum despite recent market correction.
ETH Price Surges Above $3,700 as RSI Hits Overbought Territory
Ethereum trades at $3,724.84 (+1.26% in 24h) with technical indicators showing strong bullish momentum despite overbought RSI conditions signaling potential caution ahead.
ETH Price Surges to $3,681 as Ethereum Shows Very Strong Bullish Momentum
Ethereum trades at $3,681.31 with 1.40% daily gains as ETH RSI hits overbought territory at 76.18, signaling potential consolidation ahead despite strong bullish trend.
Ethereum (ETH) Battles Overbought Conditions as Validator Exits Surge to 18-Month High
ETH price holds $3,648 amid conflicting signals as institutional accumulation of $2.57B clashes with rising validator exit queue hitting 18-month highs.
Ethereum (ETH) Hits Six-Month High at $3,727 as Institutional Buying Accelerates
ETH trades at $3,727.22 (+0.38% daily) near six-month highs as institutional accumulation and stablecoin regulatory clarity drive bullish momentum.
Ethereum Surges to $3,764 as ETH RSI Hits Extreme Overbought Territory
ETH price climbs 0.57% to $3,764.99 as institutional inflows drive momentum, but extreme overbought conditions signal potential pullback ahead.
Ethereum Surges to $3,743 as Regulatory Clarity and Technical Breakout Drive Massive Rally
ETH price hits $3,743 (+4.54%) following bullish breakout above $2,900 resistance, backed by U.S. stablecoin legislation passage and institutional accumulation signals.
Ethereum Surges to $3,600+ as Congress Passes Stablecoin Legislation and Institutional Interest Peaks
ETH breaks $3,600 amid 20% weekly gains, regulatory clarity from Congress, and institutional adoption surge. Technical indicators signal strong bullish momentum continues.
Ethereum Surges to Six-Month High at $3,675 Amid Massive Institutional Accumulation and GENIUS Act Passage
ETH hits $3,675 six-month high as institutions accumulate 300K+ tokens. BlackRock adds $499M, while GENIUS Act provides stablecoin clarity. Technical indicators show overbought conditions.
Ethereum Surges to $3,575 as BlackRock ETF Buys $499M Worth, GENIUS Act Passes Congress
ETH breaks resistance at $3,350 with 95% whale accumulation surge and major regulatory wins driving institutional adoption in July 2025.
Ethereum Breaks $3,300: Bullish Momentum Fueled by Regulatory and Institutional Tailwinds
Ethereum surged past $3,300, driven by institutional demand, regulatory clarity, and strong technical performance. Explore the key factors propelling ETH's bullish rally.
Ethereum Price Surges to $3,432 Amid ETF Inflows and Institutional Adoption
Ethereum hits $3,432 as ETF inflows and institutional adoption fuel a 20% weekly rally. With zkEVM integration and bullish momentum, analysts predict $3,500 next.
Ethereum Surges to $3,374: Record ETF Inflows, Institutional Adoption, and zkEVM Milestone
Ethereum hits $3,374 amid record ETF inflows and institutional demand. Strong technical indicators and zkEVM integration boost bullish momentum, despite security concerns.
Ethereum (ETH) Surges Past $3,100 Amid Bullish Momentum and Institutional Interest
Ethereum climbs above $3,100, fueled by ETF inflows and bullish technical patterns. Despite SEC delays and record short positions, ETH shows strong bullish trends.
Ethereum Price Dips Below $3,000 Amid ETF Inflows and zkEVM Integration News
Ethereum faces mixed sentiment as its price dips below $3,000 despite bullish ETF inflows and institutional adoption. zkEVM integration promises scalability, yet security concerns loom.
Ethereum Surges Past $3,000: Strong Institutional Inflows and Technical Upgrades Drive Growth
Ethereum (ETH) breaks $3,000, fueled by ETF inflows, technical upgrades like zkEVM, and rising institutional adoption. Explore the bullish momentum and key risks.
Ethereum's Bullish Momentum: Institutional Adoption and zkEVM Integration Drive Growth
Ethereum surges amid institutional adoption, ETF inflows, and zkEVM plans, but security concerns persist. Explore the latest developments, technical analysis, and outlook.
Ethereum (ETH) Price Surges as Bullish Momentum Builds: What’s Next?
Ethereum (ETH) rallies 6.72% in 24 hours, climbing to $2,980.57. With strong bullish trends and key resistance at $3,029.55, is ETH poised to break higher? Expert insights ahead.
Ethereum 2.0 Continues to Gain Steam, Staked ETH Tops 10 Million
The transition to Ethereum 2.0, which was renamed the consensus layer, continues to gain momentum because the amount of staked Ether is nearly 10% of the entire ETH supply.
Massive Outflows and Burnt Ether Stimulate Ethereum Scarcity to Continue
Ever since the London Hardfork or EIP-1559 upgrade went live in August 2021, Ethereum’s supply continues to be depleted based on the burning mechanism incorporated.
Ethereum Gains Momentum and Multiple Altcoins Follow its Lead
Various altcoins are following Ethereum’s momentum footsteps. The market is looking at Ethereum climbing to the $2,400 level.
Ethereum (ETH) Surges to New Highs as Bitcoin (BTC) Consolidates Amid Economic Symposium
Ethereum reaches new all-time highs while Bitcoin consolidates following the Jackson Hole Economic Symposium. Fed's dovish stance and market dynamics influence digital asset trends.
Ethereum and Bitcoin Face Key Resistance Levels Amid Market Volatility
Ethereum's rally continues as it nears key resistance, while Bitcoin consolidates below its peak. Surging altcoin interest could lead to heightened market volatility, according to Glassnode.
More Money has Flowed into Ethereum than Bitcoin in 2021
Ethereum has emerged as the victor because more money has trickled into its network than Bitcoin in 2021 based on the market capitalization metrics.
Ethereum Beats Bitcoin on the Weekly Timeframe amid Increased Optimism
Ethereum was up by 19.24% in the last seven days, which is nearly twice Bitcoin's surge during the same period of time.
Ethereum is Burning at the Rate of 6.29 ETH per Minute
Burnt Ether is edging closer to the 1.2 million ETH mark, given that it's burning at a rate of 6.29 ETH, approximately $24,361, per minute.
Ethereum Adoption Continues to Scale Heights
More participants continue joining the Ethereum bandwagon, given that addresses holding 0.1 to 1 ETH hit record highs.
ETH Miner Balances Recovering with its Transactions Hitting $2.5 Trillion in Q2 of 2021
This renewed Ethereum momentum is propelling ETH miner balances on the road to recovery.
Ethereum Whales Continue Buying from Weak Hands, Ramping up their Position by 200,000 ETH
In the past few days, whales of Ethereum have been on a buying spree as their tokens accumulation continues.
The Tale of Ethereum’s 6-Year Journey from Lows of $0.4 to Highs of $4650
ETH has shined so far this quarter because after setting an all-time high (ATH) of $4,400 recently, it soared to new historic highs of $4,650.
Will Ethereum's Records Biggest Crypto Exchange Outflow in 2022 Propel More Upward Momentum?
Ethereum witnessed the largest crypto exchange outflow this year, given that coins exited in droves to the tune of more than 180,000 ETH.
Ethereum Layer 2 Continues to Gain Steam as ETH Realized Capitalization Soars
Ethereum layer 2 seeks to address the challenge of scalability, given that it’s a distinct network running on top of Ethereum Mainnet (layer 1).
Ethereum Performs Better than Bitcoin in Annual Returns with a 663% Gain
Ethereum's annual return stands at 663.7%, performing much stronger compared to Bitcoin’s 195.5%.
Ethereum Breaches $2,500 and Achieves Its Highest Daily Close
Market analyst Lark Davis has acknowledged that Ethereum has attained the highest daily close ever, topping $2,500, which is bullish.
Ethereum Surges Past $1,800 - What's Next?
On-chain metrics provider Santiment has noted that Ethereum's price surge to above $1,800 has triggered crowd skepticism, but this is a bullish sign.
Ethereum (ETH) Faces Critical Support Level at $3,800 Amid Market Volatility
Ethereum's price tests crucial support at $3,800 amid market volatility. Explore technical indicators and potential trends as ETH navigates pivotal moments.
Ethereum (ETH) Faces Bearish Risks as Price Struggles Below $4,200
Ethereum's price is under pressure after failing to surpass the $4,200 resistance level, indicating potential bearish trends as it approaches key support levels.
DeFi Users on Ethereum Hit 4M for the First Time
Ethereum DeFi users reached a historic high of 4 million based on continued adoption.
Staked Ethereum Surpasses Mined ETH
Ethereum locked in the ETH 2.0 deposit contract continues to outway the one being mined on a daily basis, which is a bullish sign.
Ethereum’s Open Interest Surges to Historic Highs of $13B
Ethereum's open interest has been rising in tandem with the price based on their strong correlation.
Ethereum’s Adoption Continues to Tick, Addresses Holding 1 to 10 ETH Cross the 1M Mark
Ethereum is not relenting in its quest to attract more players because addresses consisting of one to ten ETH reached a new milestone by hitting the 1 million mark.
Is Ethereum Eyeing A New All-Time High?
Market analysts believe that Ethereum may be aiming for a new all-time high.
Ethereum’s Upside Appears Limitless as ETH Breaches $2,400 For the First Time Ever
On-chain metrics provider Santiment has delved deeper into Ethereum’s uptrend and noted that its rally to $3k and beyond looks set.
Ethereum Price Retraces Below $1,100 With Plunging Crypto Market, Is ETH's Bull Run Over?
Ethereum is down more than 18% since yesterday, as the ETH dropped below the $1,100 price level. ETH is currently trading near $1,050. Where to next for the Ethereum price?
Ethereum Price Plunges Below $2000 As Inflation Worries Hit Markets Hard
Ethereum price has tanked $2,000 for the first time since late June.
Ethereum Miners Revenue Percentage Reaches Monthly Low
The percentage of miner revenue from fees on the ETH network reached a monthly low of 36.145%.
Ethereum Stands at Significant Support Based on the Purchase of Over 10 Million ETH
More than 10 million Ethereum was bought between $3,426 and $3,536, which is a very significant supply wall for support.
ETH's Average Fees Hit a 10-Month Low, Does Fear and Stagnancy Engulf the Market?
The hiccups experienced in the entire crypto market might have sparked fear and stagnancy in the Ethereum network based on low fee levels.
Ethereum Total Liquidity in DeFi Protocols Climbs to $90.7B, Despite Price Slip
The dominance of Ethereum in the DeFi ecosystem continues to gain steam because total value locked (TVL) in this space surged by 14.43% to hit $90.7 billion.
Burnt Ether Tops 1 Million ETH as Non-Zero Ethereum Addresses Break the Record
Ethereum has been making notable strides in terms of burnt Ether after crossing the 1 million ETH mark.
Ethereum’s Transaction Volume Hits a 5-Month High
Despite Ethereum (ETH) correcting from the historic high of $4,860 attained recently, the second-largest cryptocurrency is still experiencing high transaction volume on its network.
Ethereum Median Fees Slip to 6-Month Low, Will this Reignite Rebound?
Ethereum's median fees dropped to lows not seen since July 2021, raising the question of whether a rebound is on the horizon.
Ethereum Takes the Lead in GitHub Development Activity
Ethereum continues to scale heights because it has jumped to the top position in terms of GitHub development activity, according to market insight provider Santiment.
82% Ethereum Holders Still in Profitability Despite Price Slipping Below $4,000
Ethereum has yielded an annual return more than five times that of Bitcoin.
Ethereum Experiences Accumulation Trend as Price Continues Trading Above $3,000
Ethereum has been experiencing notable accumulation based on the mean coin age, illustrating more demand.
Ethereum Worth Nearly $195M Staked in ETH 2.0 Deposit Contract Over the Past Week
More investments continue trickling into Ethereum 2.0 deposit contract based on the historic highs noted.
Active Addresses of Ethereum Hit Monthly High with $22B Being Staked before the Merge
Ethereum continues to be at the centre stage after undergoing its biggest software upgrade called the Merge. As a result, active ETH addresses have skyrocketed after hitting a monthly high.
Ethereum Network Continues to Expand as Non-Zero Addresses Hit ATH
Ethereum has been experiencing notable expansion in its networks as new addresses continue scaling heights.
Ethereum Hits 6-Week High amid Addresses in Profitability Surging
Ethereum reached highs of $1,770; a scenario has last seen on June 10 as more momentum continued trickling into the network.
Ethereum Address Activity Continues Scaling the Heights
Ethereum has been experiencing an uptick in address activity, which has been instrumental in propelling notable momentum.
Ethereum’s Sentiment Drops as FOMC Meeting Nears
After experiencing considerable momentum, Ethereum’s sentiment has dropped as the Federal Open Market Committee (FOMC) meeting edges closer, according to Santiment.
Ethereum Token Circulation Hit Levels Last Seen in June Amid ETH Realized Cap Reaching ATH
Ethereum has been experiencing an uptick in different activities, despite the crypto market bleeding triggered by factors like a major liquidity crisis witnessed by leading Asian property developer China Evergrande.
Ethereum Needs to Hold $2,800 for Sustainable Bullish Momentum
With Ethereum being treated like a stone's throw away from the psychological price of $3,000, its upward momentum continues to gain steam.
Ethereum’s Speculative Action Goes through the Roof as the Merge Edges Closer
Since the Ethereum merge has been awaited with bated breath by the crypto community, the network’s speculative action has skyrocketed.
Ethereum Hits a Monthly High above $1,500, Merging Events Continues Engulfing the Market
Ethereum returned to levels last seen in June based on renewed momentum following the popping up of the merging events.
Ethereum Stays Steady Above $3,000 Based on Heightened Social Engagement
For the past ten days, Ethereum (ETH) has pitched camp above the psychological price of $3,000 based on increased social engagement.
Ethereum’s Low Median Fees Triggering more Utility, Burn Rate Stands at 6.16 ETH Per Minute
Utility on the Ethereum network is rising thanks to low median fees.
Social Discussion on Ethereum Hit a 2-Month High, Active Addresses Scale the Heights
Ethereum’s social volume and dominance reached levels last seen in February based on significant discussions about the second-largest cryptocurrency.
ETH Merge Will Propel Narrative of Cryptos Being Eco-Friendly: Head of Sales at Moneycorp
Once Ethereum shifts to a PoS consensus mechanism, validators will replace miners in the confirmation of blocks because they will use the staked Ether. As a result, prompting a more cost-efficient and environmentally friendly approach.
Citi Believes The Merge Will Make Ethereum a “Yield-Bearing Asset”
Citigroup Inc. or Citi, an American multinational investment bank, disclosed that the merge would make Ethereum (ETH) a deflationary asset. As a result, the second-largest cryptocurrency will become a “yield-bearing asset.”
Will Ethereum Merge Trigger a Shift from Selling to Buying Pressure?
DeFi educator Korpi believes the merge of Ethereum will be a game-changer because structural supply will shift to structural buying.
Ethereum Merge Might Happen in August as Testing Enters Final Round
Speaking at the Permissionless 2022 Conference in Florida, U.S., Ethereum Researcher Justin Drake disclosed that the merge might happen in August.
$5,000 Emerge as the Largest Open Interest Strike Price for Ethereum Options
Open interest is rising, with $5,000 being the largest strike price for Ethereum options.
Ethereum Whales Buy Dip, Increasing Holdings by 180,000 ETH
Ethereum whales took advantage of the recent dip by increasing their holdings by 180,000 ETH.
Ethereum Closed in Green for 7 Weeks amid Burnt Ether Topping $4b
Ethereum has made seven positive weekly closes, given that it has enjoyed a significant upward momentum this quarter.
Ethereum Supply Diminishes to a Record Low Amid ETH Breaking the Record at $4,400
Ethereum’s record-breaking surge is being attributed to diminished supply and high token circulation.
Buying Pressure Builds up on Ethereum Network, Pushing Price Above $1,300 Amid Merge News
Ethereum (ETH) experienced notable momentum that drove the price above $1,300 after news of the much-anticipated merge made the airwaves.
Ethereum Tumbles as Low As $2,115 Partly Triggered by Delayed London Hard Fork Release
Ethereum is likely to extend its drop as indicated by a rising wedge chart.
Ethereum's Median Fees Drop by 88.7%,Hitting a Two-Month Low
Ethereum traders have a reason to smile because transaction fees dropped from November highs of $34.19 to $3.84 per transaction, representing an 88.7% decline.
Ethereum’s Transaction Volume Scales the Heights by Topping 2.14B ETH in 2021
With an annual return rate of 399.2%, Ethereum (ETH) has scaled the heights in 2021 thanks to increased adoption and notable upgrades like the London Hard Fork.
Ethereum Validators Hit 300,000, Non-Zero ETH Addresses Reach ATH
The number of validators on the Ethereum network continues gaining steam after hitting the 300,000 mark.
Why Ethereum Whales Selling Their Holdings?
Data shows Ethereum whales' address holdings have reduced by more than 3 million ETHs over the last five weeks, indicating that whales have maintained redistribution of their holdings on the market since the Merge.
ETHFI Tests 200-Day Moving Average Support as Liquid Staking Token Faces Momentum Shift
Ether.Fi (ETHFI) trades at $1.05, down 1.8% as the liquid staking protocol's token hovers near its 200-day moving average amid broader crypto market weakness.
ETHFI Technical Breakdown: Season 3 Airdrop Claims Open Amid Neutral RSI Territory
ETHFI price sits at $1.53 with neutral RSI at 54.87 as Season 3 airdrop claims launch, creating potential trading opportunities near key support levels.
ETHFI Price Analysis: Neutral RSI Signals Mixed Momentum as Token Holds Above Key Moving Averages
ETHFI trades at $1.55 with neutral RSI at 56.69, showing consolidation above 20-day SMA despite bearish MACD divergence signaling potential downside risks.
ETHFI Price Analysis: Ether.Fi Shows Bullish Momentum Despite 3.35% Daily Decline
ETHFI trades at $1.56 with bullish technical indicators emerging. Strong momentum signals suggest potential recovery from recent pullback in the liquid staking token.
ETHFI Price Surges 5.51% to $1.59 as Ether.Fi Shows Very Strong Bullish Momentum
ETHFI price climbs to $1.59 with 5.51% daily gains, breaking above key moving averages as technical indicators signal continued bullish momentum for Ether.Fi.
ETHFI Price Surges 10.89% as Ether.Fi Technical Analysis Shows Bullish Momentum
ETHFI trades at $1.48 after a strong 10.89% daily gain, with technical indicators suggesting continued upside potential as the token breaks above key moving averages.
ETHFI Price Analysis: Ether.Fi Shows Mixed Signals at $1.48 Despite Bullish Trend
ETHFI trades at $1.48 (-1.99% daily) with bullish momentum indicators conflicting with recent price decline. RSI neutral at 58.30 suggests consolidation phase.
Ether.Fi (ETHFI) Holds Above $1.50 as Bulls Target $1.70 Resistance
ETHFI price trades at $1.51 despite a 3.65% daily decline, with technical indicators showing bullish momentum as the token maintains strong uptrend positioning.
Ether.Fi (ETHFI) Tests $1.70 Resistance as Technical Indicators Flash Mixed Signals
ETHFI trades at $1.56 after a 3.93% decline, approaching key resistance at $1.70 while RSI remains in neutral territory at 65.35, signaling potential consolidation ahead.
ETHFI Surges 10.38% to $1.64 as Technical Indicators Flash Overbought Signals
Ether.Fi (ETHFI) rallies to $1.64 with strong volume, but RSI at 70.05 suggests caution as price approaches key resistance at $1.68.
ETHFI Price Analysis - Bullish Momentum Builds Despite 3.85% Daily Decline
ETHFI price sits at $1.47 after declining 3.85% today, but technical indicators suggest underlying bullish momentum may drive recovery toward $1.61 resistance.
ETHFI Price Surges 5.85% as Ether.Fi Tests Key Resistance at $1.61
ETHFI trades at $1.50 with strong bullish momentum as technical indicators signal potential breakout above critical resistance levels.
ETHFI Price Holds Above $1.40 Despite 3.3% Daily Decline - Technical Indicators Signal Mixed Outlook
Ether.Fi (ETHFI) trades at $1.43 after a 3.32% daily drop, but technical analysis reveals bullish MACD momentum amid neutral RSI conditions in the ETHFI/USDT pair.
ETHFI Price Surges 54% Above 200-Day Average as Bullish Momentum Accelerates
ETHFI price trades at $1.48 with strong bullish momentum as technical indicators show the token near resistance at $1.61. Ether.Fi RSI at 64.79 signals continued upward potential.
ETHFI Price Breaks Above Bollinger Bands as Ether.Fi Shows Strong Bullish Momentum
ETHFI price surges 4.71% to $1.49 as technical indicators flash bullish signals with RSI at 69.48 and strong momentum building above key resistance levels.
Ether.Fi (ETHFI) Breaks Above Bollinger Bands as Bulls Push Toward $1.53 Resistance
ETHFI price surges to $1.42 with strong momentum indicators signaling potential breakout above key resistance levels in coming sessions.
** ETHFI Price Surges 4.8% as Ether.Fi Technical Indicators Flash Strong Bullish Signals
** Ether.Fi (ETHFI) trades at $1.29 with strong momentum indicators showing bullish divergence while approaching key resistance levels near $1.34.
ETHFI Price Surges 2.5% as Technical Indicators Signal Bullish Momentum
Ether.Fi trades at $1.23 with strong technical signals emerging as ETHFI breaks above key moving averages, setting up potential rally toward $1.34 resistance.
ETHFI Price Rallies Above $1.19 as Whale Accumulation and Revenue Buybacks Drive Momentum
ETHFI trades at $1.19 (+1.11% in 24h) with whale accumulation and upcoming September 15 token buybacks from 5% of Ether.fi's $2.19M August revenue creating bullish momentum.
ETHFI Price Holds Above Key Support as Technical Indicators Signal Potential Breakout
Ether.Fi trades at $1.17 with bullish momentum building. Technical analysis reveals ETHFI testing critical resistance levels with RSI in neutral territory.
ETHFI Price Analysis: Ether.Fi Shows Mixed Signals Near $1.15 Support
ETHFI trades at $1.15 with neutral RSI and bullish MACD divergence. Key resistance at $1.34 could trigger breakout as Ether.Fi maintains above critical support levels.
** ETHFI Price Surges 1.95% as Ether.Fi Shows Bullish Technical Breakout Signals
** ETHFI trades at $1.15 with bullish momentum emerging. Technical analysis reveals neutral RSI and positive MACD divergence signaling potential upside for Ether.Fi.
ETHFI Price Holds $1.12 as $100M Institutional Investment Sparks Bullish Momentum
ETHFI trades at $1.12 with 2.56% daily gains following ETHZilla's massive $100M deployment announcement, while technical indicators show mixed signals ahead.
ETHFI Price Surges 4.2% as Technical Indicators Signal Potential Breakout
Ether.Fi (ETHFI) trades at $1.14 after gaining 4.2% in 24h, with RSI neutral and bulls eyeing $1.34 resistance for next move up.
ETHFI Price Breaks Above Key Support at $1.08 Despite Mixed Technical Signals
Ether.Fi trades at $1.08 with 3.63% daily gains, but ETHFI technical analysis reveals conflicting momentum signals as traders eye $1.39 resistance level ahead.
ETHFI Price Analysis: Key Support Tested as Momentum Turns Bearish
ETHFI trades at $1.08 after a 1.10% decline, testing critical support levels while technical indicators suggest further downside pressure ahead.
ETHFI Price Analysis: Neutral RSI Signals Mixed Outlook Despite Recent Exchange Listing
ETHFI trades at $1.09 (-1.09% daily) with neutral RSI at 46.58, showing consolidation below key resistance levels despite positive exchange listing catalyst.
ETHFI Price Analysis: Liquid Staking Token Tests Key Support at $1.09
Ether.Fi (ETHFI) trades at $1.09 with mixed signals as the liquid staking protocol faces technical headwinds despite remaining above long-term support levels.
ETHFI Price Drops 3.12% as Ether.Fi Tests Key Support at $1.09
Ether.Fi (ETHFI) trades at $1.09 after declining 3.12% in 24 hours, with RSI at 46.31 suggesting potential oversold bounce near critical support levels.
ETHFI Price Drops 8% Despite Foundation Buyback Program as Technical Indicators Show Mixed Signals
ETHFI trades at $1.14 after an 8.16% decline, testing key support levels while RSI remains neutral despite recent Foundation buyback initiative providing temporary relief.
ETHFI Price Surges 7.65% to $1.22 Despite Foundation Buyback Program Struggles
ETHFI rebounds to $1.22 with strong bullish momentum as technical indicators show recovery potential despite recent Foundation buyback challenges affecting market sentiment.
ETHFI Price Drops 9.84% Despite Foundation Buyback Program Support
ETHFI trades at $1.20 after a sharp 9.84% decline, testing key support levels despite ongoing Foundation buyback program providing fundamental backing.
ETHFI Price Falls 6.4% Despite Foundation Buyback Program Launch
ETHFI trades at $1.16 after dropping 6.4% in 24 hours, testing key support levels despite Ether.Fi Foundation's recently announced buyback initiative.
ETHFI Breaks Above Key Moving Averages as Bullish Momentum Accelerates
Ether.Fi (ETHFI) trades at $1.22, up 3.30% in 24 hours, with technical indicators signaling continued upside potential as price action breaks key resistance levels.
ETHFI Price Holds Above $1 Despite 4.4% Drop as Foundation Buyback Program Provides Support
ETHFI trades at $1.18 after a 4.39% decline, but Ether.Fi Foundation's buyback program and strong technical indicators suggest potential recovery ahead.
ETHFI Soars 9% as Ether.Fi Foundation Buyback Program Drives Bullish Momentum
ETHFI trades at $1.22 (+9.03% in 24h) as the Foundation's $2.58M buyback program combines with strong technical signals to push prices above key resistance levels.
ETHFI Price Recovers 2.8% as Ether.Fi Foundation Buyback Program Boosts Sentiment
ETHFI trades at $1.03 (+2.8% daily) following Ether.fi Foundation's revenue buyback announcement, though technical indicators remain mixed with RSI at 45.11.
ETHFI Price Recovers 2.47% as Ether.Fi Tests $1.00 Pivot Point Amid Whale Selling Pressure
ETHFI trades at $1.00 (+2.47% in 24h) after bouncing from critical support. Technical indicators show oversold conditions while recent whale activity creates uncertainty.
ETHFI Price Recovers 4.37% as Ether.Fi Tests Critical Support Levels
ETHFI trades at $0.98 (+4.37% in 24h) after bouncing from $0.90 support. Technical indicators show oversold conditions while whale selling pressure persists.
Ether.Fi (ETHFI) Consolidates at $1.19 as One-Click Vaults Launch Amid Whale Selling
ETHFI trades at $1.19 (+0.17%) while testing critical support levels. New one-click vault feature launches as technical indicators show neutral momentum.
ETHFI Price Falls 5.11% as Ether.Fi Tests Critical Support Levels
ETHFI trades at $1.13 after declining 5.11% in 24 hours, approaching key support at $1.05 while technical indicators show mixed signals for the liquid staking protocol.
Ethereum PoW Fork Token Price Drops Over 60% A Day after Mainnet Launch
ETHPoW was trading as high as $60.68 on Thursday morning after the merge, but on Friday the new token experienced a huge plunge.
Fantom Price Surges 20% amid Andre Cronje's Unexpected Comeback
Andre Cronje is rumoured to have come back to work at Fantom blockchain network. Fantom prices reacted positively and are now up.
Fed’s Interest Rate Hikes Attributed to Primary Catalyst of Crypto Bear Market
The decision by the federal reserve (Fed) to continuously hike interest rates to tame runaway inflation has been detrimental to the crypto market as bears continue to bite.
Bitcoin Braces for Deeper Bear Market as Fed Eyeing Another Big Rate Hike
The Fed has already announced five rate hikes this year, but the institution has not yet been able to contain the surging inflation.
Bitcoin Holds Steady at $20,000 Level as The Fed Hikes Rates as Expected
The Federal Reserve enacted the 4th consecutive 75 basis point rate hike on Wednesday. Bitcoin reacted.
Fibonacci Retracements: Decoding Market Patterns with Mathematical Precision
Explore the use of Fibonacci retracements in predicting market behavior. Learn how these mathematical patterns identify potential support and resistance levels in trading.
Filecoin Price Tests Multi-Month Lows at $1.50 as Crypto Markets Diverge from Stabilizing Bitcoin
FIL price drops to $1.50 despite modest crypto market recovery, with oversold RSI signaling potential bounce as technical indicators remain bearish across key timeframes.
FIL Price Tumbles to 52-Week Low at $1.47 as Selling Pressure Overwhelms Technical Support
Filecoin drops to yearly lows at $1.47 following last week's 7% crash, with RSI showing deeply oversold conditions as sellers maintain control despite approaching critical support levels.
Filecoin Price Action: FIL Tests Multi-Month Lows as Support Levels Crumble
Filecoin trades at $2.18 after breaking critical support at $2.62, with technical indicators signaling potential deeper correction despite modest 1.82% daily recovery.
Filecoin (FIL) Breaks Below $2.20 Support as Bears Intensify Selling Pressure
FIL price drops to $2.14 (-1.43% in 24h) as technical indicators flash oversold signals while bears test critical support levels around $2.08.
Filecoin (FIL) Tests Critical Support at $2.17 as Bearish Momentum Builds
FIL price drops 2.96% to $2.20, approaching key support levels with RSI at 36.73 signaling potential oversold conditions for traders to watch.
Filecoin (FIL) Tests $2.28 Support as Bears Maintain Control
FIL price drops to $2.28 (-0.09% in 24h) as bears test critical support levels. RSI at 41.37 signals potential oversold bounce, but MACD remains bearish.
FIL Price Hovers Near Crucial Support as Filecoin Shows Mixed Signals
Filecoin trades at $2.26 (-0.22%) near key $2.23 support level. FIL RSI at 39.73 suggests potential oversold conditions while bearish momentum persists across indicators.
FIL Price Drops 7.4% as Filecoin Tests Critical Support Near $2.17
Filecoin (FIL) trades at $2.25, down 7.4% in 24h, as technical indicators signal bearish momentum with FIL RSI at 39.25 and price approaching key support levels.
Filecoin (FIL) Price Analysis: Neutral Territory as Bears Target $2.22 Support
FIL price trades at $2.45 with neutral RSI at 49.67, while bearish MACD signals suggest potential downside toward key support levels in coming sessions.
FIL Price Drops 4.16% as Filecoin Tests Critical Support at $2.44
Filecoin (FIL) trades at $2.44 after a 4.16% decline, with technical indicators showing neutral momentum despite testing key support levels around the 20-day moving average.
Filecoin (FIL) Tests Critical Support at $2.52 as Bears Take Control
FIL price drops to $2.52 (-1.06%) after breaking key $2.62 support, with mixed technical signals creating uncertainty for traders eyeing next move.
Filecoin (FIL) Shows Bullish Momentum as Price Tests $2.66 Resistance
FIL price rallies 3.68% to $2.56, approaching key resistance at $2.66 with RSI entering neutral territory and MACD showing bullish momentum signals.
Filecoin (FIL) Shows Weak Bullish Momentum as Price Holds Above $2.40 Support
FIL price trades at $2.46 with neutral RSI at 51.05, showing weak bullish signals despite limited volatility and consolidation near key resistance levels.
Filecoin (FIL) Surges 3.93% to $2.48 as Network Growth and Partnership Momentum Build
FIL price climbs to $2.48 with bullish MACD signals emerging as network utilization jumps 32% and Filecoin Foundation announces strategic GSR collaboration.
Filecoin (FIL) Breaks Below $2.62 Support as Bearish Momentum Accelerates
FIL price drops to $2.42 (-5.37%) after breaking key support, with technical indicators showing mixed signals as traders eye $2.22 support level ahead.
Filecoin (FIL) Tests $2.50 Resistance as Network Growth Drives Mixed Signals
FIL trades at $2.55 after testing $2.50 resistance, down 3.08% in 24h despite strong network utilization growth driving recent bullish momentum.
FIL Price Surges 4.92% as Filecoin Tests Upper Bollinger Band Resistance at $2.62
Filecoin (FIL) trades at $2.62 with strong bullish momentum as technical indicators signal potential breakout above key resistance levels.
Filecoin (FIL) Tests $2.50 Resistance as Bulls Eye Breakout Above Key Technical Levels
FIL price currently trades at $2.51, up 0.64% in 24h, showing bullish momentum signals despite facing resistance at $2.50 with trading volume surging to $10.2M on Binance.
FIL Price Surges 2.67% as Filecoin Shows Bullish Momentum Above Key Support
FIL trades at $2.50 (+2.67%) with bullish MACD signals and strong volume. Filecoin's Q2 growth report and recent volatility create mixed trading outlook.
Filecoin (FIL) Tests $2.45 as Technical Indicators Flash Mixed Signals
FIL price holds steady at $2.45 with neutral RSI at 53.89. Recent 3% rebound from $2.23 support zone suggests consolidation ahead of potential breakout.
Filecoin (FIL) Breaks Above $2.40 as Network Growth Drives Bullish Momentum
FIL trades at $2.43 (+2.36%) with bullish MACD signals emerging while Q2 reports show 32% network utilization growth despite ecosystem partnerships.
Filecoin (FIL) Shows Mixed Signals as New Partnerships Drive Development Activity
FIL price trades at $2.39 (+3.55%) with neutral RSI at 50.70. Recent partnerships boost ecosystem development while technical indicators suggest consolidation ahead.
Filecoin (FIL) Consolidates Near $2.32 as Bulls Eye Key Resistance Break
FIL trades at $2.32 (+0.69%) with neutral momentum as Filecoin faces critical resistance at $2.45 while technical indicators show mixed signals for short-term direction.
Filecoin (FIL) Holds Above $2.30 as Technical Indicators Signal Neutral Territory
FIL price trades at $2.32 with modest 2.16% daily gains, while RSI at 46.85 suggests neutral momentum amid mixed technical signals for the decentralized storage token.
FIL Price Hovers Near Critical Support as Filecoin Shows Mixed Technical Signals
Filecoin trades at $2.27 with neutral momentum as FIL approaches key support levels while technical indicators show conflicting signals for short-term direction.
Filecoin (FIL) Price Holds Above $2.28 as Technical Indicators Flash Mixed Signals
FIL trades at $2.28 with +2.15% gains amid neutral RSI at 44.05, while bearish MACD suggests caution for traders eyeing key resistance at $2.63.
FIL Price Drops to $2.27 as Filecoin Faces Technical Pressure
Filecoin (FIL) trades at $2.27 after a 2.78% decline, with bearish momentum indicators suggesting further downside potential in the near term.
FIL Price Rallies 6.21% as Filecoin Shows Bullish Recovery Signals
Filecoin (FIL) surges to $2.46 with strong daily gains, as technical indicators suggest potential continuation of the upward momentum despite neutral market conditions.
FIL Price Holds Above $2.30 as Filecoin Shows Mixed Technical Signals
Filecoin trades at $2.32 with +1% daily gains, but technical indicators paint a complex picture with bearish momentum and neutral RSI signaling potential consolidation.
Filecoin (FIL) Struggles Below $2.30 as Bearish Momentum Persists Despite Grayscale Boost
FIL price trades at $2.27 (-0.35%) as bearish sentiment overrides Grayscale's recent inclusion in Digital Large Cap Fund, with technical indicators signaling potential downside.
Filecoin (FIL) Tests Critical Support at $2.28 Amid Institutional Adoption Momentum
FIL trades at $2.28 (-3.71% daily) near oversold levels as Grayscale inclusion battles technical weakness at key support zone between $2.07-$2.25.
FIL Price Analysis: Filecoin Tests Support at $2.34 as Bears Maintain Control
Filecoin (FIL) trades at $2.34 with neutral RSI signals while technical indicators suggest continued downward pressure in the near term.
Filecoin (FIL) Faces Bearish Pressure Despite Grant Program Boost
FIL trades at $2.47 (-4.08% in 24h) as technical indicators turn mixed following recent ecosystem funding announcement worth over $3.6 million.
Filecoin (FIL) Surges 4% on AI Partnership Momentum - Technical Analysis Shows Bullish Signals
FIL price climbs to $2.57 with 3.96% daily gains as AI data storage partnership drives institutional accumulation and bullish technical momentum.
Filecoin (FIL) Drops 7.75% Despite $3.6M Grant Funding - Technical Analysis Shows Mixed Signals
FIL price trades at $2.54 after a 7.75% decline, but recent $3.68 million ProPGF grants and bullish MACD signals suggest potential recovery ahead for Filecoin traders.
Filecoin (FIL) Price Struggles at $2.47 Despite AI Partnership Boost
FIL trades at $2.47 after a 4.90% decline, testing crucial support levels despite recent AI data storage partnership announcement driving earlier gains.
Filecoin (FIL) Shows Bullish Momentum at $2.59 Following Major AI Partnership News
FIL trades at $2.59 (+0.66% daily) as Protocol Labs' AI data storage partnership and proposed staking mechanism drive technical indicators toward bullish territory.
Filecoin (FIL) Price Holds $2.59 Despite 24h Decline as AI Partnership Boosts Weekly Sentiment
FIL trades at $2.59 with -1.18% daily decline, but bullish MACD signals emerge following Protocol Labs' major AI data storage partnership announcement this week.
Filecoin (FIL) Price Surges 4% Despite Recent Support Break - Technical Recovery Signals
FIL trades at $2.60 (+4.09%) as bulls attempt recovery from key $2.38 support break. NV23 upgrade and AI showcase fuel optimism despite recent volatility.
Filecoin (FIL) Struggles at $2.38 as Bears Test Critical Support Levels
FIL trades at $2.38 (+1.54%) after breaking key support, with technical indicators showing mixed signals and bearish momentum dominating recent price action.
Filecoin (FIL) Price Drops to $2.32 as Bears Break Critical Support
FIL trades at $2.32 (-2.77% in 24h) after breaking key $2.38 support level. Technical indicators show bearish momentum building as selling pressure intensifies.
Filecoin (FIL) Struggles Near $2.37 as Key Support Breaks Despite Recovery Attempt
FIL trades at $2.37 (+2.59%) after breaking critical $2.38 support level. Technical indicators show mixed signals as Filecoin attempts to recover from recent sell-off.
Filecoin (FIL) Breaks Below Key $2.38 Support as Bears Take Control
FIL trades at $2.31 after breaking critical support levels. Technical indicators signal bearish momentum despite recent 0.65% recovery.
** Filecoin (FIL) Price Drops to $2.30 as Bears Break Critical $2.38 Support Level
** FIL trades at $2.30 (-1.33%) after breaking key support. Technical indicators signal bearish momentum with RSI at 36.42 and price near Bollinger Band lows.
** FIL Price Drops 6% as Filecoin Tests Critical Support at $2.29
** Filecoin (FIL) trades at $2.31 after a 6.09% daily decline, approaching key support levels with RSI showing oversold conditions and bearish momentum signals.
Filecoin (FIL) Struggles Below $2.60 as Bearish Momentum Builds Despite Network Upgrades
FIL price trades at $2.54 with bearish MACD signals emerging, while recent protocol upgrades face headwinds from broader market regulatory concerns.
Filecoin (FIL) Drops 5.6% as Trading Volumes Decline - Technical Analysis Shows Key Support Test
FIL price falls to $2.49 (-5.6% in 24h) amid weakening market sentiment. Technical indicators suggest oversold conditions near critical support levels.
Filecoin (FIL) Faces Consolidation at $2.64 as Bears Test Key Support Levels
FIL trades at $2.64 (-4.76% today) despite recent bullish momentum from July's 5% surge, with neutral RSI and critical support at $2.42 under pressure.
FIL Price Analysis: Filecoin Tests $2.60 Support After 4.36% Daily Drop
Filecoin (FIL) trades at $2.61 after a 4.36% decline, with technical indicators showing mixed signals as the token approaches critical support levels.
Filecoin (FIL) Eyes $3.02 Resistance as Technical Indicators Show Mixed Signals
FIL trades at $2.68 (+1.32%) with RSI in neutral territory at 54.59, while recent AI partnership momentum battles broader market headwinds.
FIL Price Analysis: Filecoin Shows Mixed Signals as Technical Updates Drive Community Activity
FIL price sits at $2.64 (+3.05% today) amid neutral RSI signals. Recent Singularity v0.6.0 release and $15K hackathon support Filecoin's technical development momentum.
Filecoin (FIL) Struggles Below Key Moving Averages Despite Technical Updates
FIL price sits at $2.56, down from recent highs as technical indicators show mixed signals. Foundation releases bring neutral market impact amid bearish momentum.
FIL Price Analysis: Filecoin Shows Weak Bullish Signals Despite Foundation Upgrades
FIL price trades at $2.63 after declining 0.79% in 24h. Technical indicators show mixed signals as Filecoin Foundation releases major updates with minimal market impact.
Filecoin (FIL) Tests Overbought Territory at $2.90 as AI Partnership Sparks Rally
FIL price hits $2.90 with 0.73% daily gains despite recent market volatility. RSI at 71.43 signals overbought conditions while AI partnership drives bullish momentum.
Filecoin Soars 3.46% as Technical Indicators Flash Overbought Signals Near $3 Resistance
FIL trades at $2.93 with 3.46% daily gains as RSI hits 73.98 overbought territory while approaching critical $3.02 resistance following Upbit listing momentum.
FLOKI Price Prediction: Targeting $0.000055 Recovery Within 7 Days Amid Bullish Technical Setup
FLOKI price prediction suggests a potential 27% rally to $0.000055 target within one week, supported by oversold RSI recovery and emerging MACD bullish momentum signals.
FLOKI Price Prediction: Recovery to $0.000055 Expected Within 7 Days as Technical Indicators Signal Bullish Momentum
FLOKI price prediction points to 27% upside potential targeting $0.000055 in the short term, with medium-term Floki forecast suggesting $0.000185-$0.000320 range within 30 days.
FLOKI Price Prediction: $0.000055 Target Within 7 Days as RSI Shows Oversold Recovery Signal
FLOKI price prediction targets $0.000055 short-term rally as technical indicators suggest 27% upside potential from oversold RSI levels with bullish MACD momentum building.
FLOKI Price Prediction: Recovery to $0.000055-$0.000185 Expected by January 2026
FLOKI price prediction suggests a 27-60% recovery potential within 30 days, with technical indicators pointing toward $0.000055 short-term target amid oversold conditions.
FLOKI Price Prediction: Targeting $0.000051 Recovery Within 7-10 Days
FLOKI price prediction shows bullish momentum building as RSI neutrality and positive MACD histogram suggest a move toward $0.000051 resistance in the coming week.
FLOKI Price Prediction: $0.000186 Target in Sight as Technical Indicators Turn Bullish
Floki price prediction shows potential for 280% gains to $0.000186 target as RSI oversold conditions and bullish MACD signal recovery from current levels.
FLOKI Price Prediction: Technical Recovery to $0.00007321 Target by March 2026
FLOKI price prediction shows potential 64% upside to $0.00007321 despite current bearish sentiment, with critical support at $0.00004105 and resistance at $0.00004626.
FLOKI Price Prediction: Recovery to $0.000051 Expected by Mid-December 2025
FLOKI price prediction shows potential bounce from oversold levels targeting $0.000051 resistance, with bullish momentum building despite recent weakness.
FLOKI Price Prediction: Oversold Bounce to $0.000055 Target by December 15, 2025
FLOKI price prediction shows potential 27% rally from oversold RSI levels, targeting $0.000055 resistance with bullish momentum signals emerging on daily charts.
FLOKI Price Prediction: Recovery Target $0.000280 by January 2026 After Oversold Bounce
FLOKI price prediction shows potential 475% rally to $0.000280-$0.000320 range as RSI oversold conditions and bullish MACD momentum signal recovery from current lows.
FLOKI Price Prediction: Targeting $0.000280-$0.000320 Recovery Within 30 Days
FLOKI price prediction suggests 40-60% upside potential to $0.000280-$0.000320 range as oversold RSI and emerging bullish MACD momentum signal recovery ahead.
FLOKI Price Prediction: Recovery to $0.000280-$0.000320 Target as Oversold Conditions Signal 40-60% Upside
FLOKI price prediction shows potential 40-60% recovery to $0.000280-$0.000320 range within 30 days as oversold RSI and bullish MACD momentum create setup for reversal.
FLOKI Price Prediction: Recovery to $0.000280 Target as Technical Indicators Signal Reversal Potential
FLOKI price prediction suggests 40-60% upside potential to $0.000280-$0.000320 over next 30 days as oversold conditions and bullish MACD momentum set stage for bounce from current levels.
FLOKI Price Prediction: Oversold Bounce Targets $0.000185 by December 2025
FLOKI price prediction shows potential 300%+ upside to $0.000185 as RSI hits oversold levels at 29.60, setting up technical bounce from current support zone.
FLOKI Price Prediction: Technical Recovery Expected Despite 69% Drop from Highs - Target $0.000185 by December 2025
FLOKI oversold at RSI 30.17 signals potential bounce from current lows. Technical analysis suggests $0.000185 price target within 30 days as momentum indicators reset.
FLOKI Price Prediction: Recovery to $0.000075 Expected by December 2025 Despite Current Oversold Conditions
FLOKI price prediction shows potential 40% upside to $0.000075 within 4 weeks as RSI at 34.21 signals oversold bounce despite bearish MACD momentum.
FLOKI Price Prediction: Targeting $0.000075-$0.000167 by November End Despite Current Weakness
FLOKI price prediction shows potential 40-220% upside to $0.000075-$0.000167 despite oversold RSI at 35.43 and bearish MACD momentum signaling near-term weakness.
FLOKI Price Prediction: Targeting $0.000065-$0.000070 Range Within 2-4 Weeks Despite Current Bearish Momentum
FLOKI price prediction shows potential 15-20% upside to $0.000065-$0.000070 range despite current RSI at 37.35 and bearish MACD, with critical support at $0.0000591.
FLOKI Price Prediction: Recovery to $0.000070 by December 2025 Amid Technical Oversold Bounce
FLOKI price prediction shows potential 12% upside to $0.000070 by December 2025 as technical indicators suggest oversold bounce from critical $0.000062 support level.
FLOKI Price Prediction: Targeting $0.000070 Recovery by December 2025 Amid Oversold Bounce Setup
FLOKI price prediction shows potential 12% upside to $0.000070 by December as technical indicators signal oversold bounce from critical $0.000062 support level.
FLOKI Price Prediction: Targeting $0.000070 by December 2025 Amid Bullish Technical Setup
FLOKI price prediction suggests a rally to $0.000070 in the coming weeks, with technical indicators showing bullish momentum despite neutral RSI levels.
FLOKI Price Prediction: Bearish Momentum Points to $0.000032 Target as Technical Indicators Signal Decline
FLOKI price prediction shows bearish momentum with RSI at 41.70 and technical indicators pointing toward $0.000032 short-term target within 1-2 weeks.
FLOKI Price Prediction: Bearish Outlook Targets $0.000032 as Technical Indicators Signal Further Decline
FLOKI price prediction suggests a bearish trajectory toward $0.000032 in the short term, with oversold RSI conditions potentially offering limited relief bounces.
FLOKI Tumbles 11% Despite Musk's 'CEO of X' Tweet as Bitcoin Decline Weighs on Meme Coins
FLOKI trading at $0.00 down 11% as Bitcoin's 3.12% decline overshadows Elon Musk's bullish tweet from yesterday that initially sparked a 27% surge in the meme coin.
FLOKI Technical Rebound Shows Strength as Meme Coin Gains 6.8% Amid Market Recovery
FLOKI price climbs to current levels with 6.8% daily gains as technical indicators suggest potential for continued momentum despite broader market uncertainty.
Floki Technical Analysis Shows Oversold Conditions as FLOKI Price Tests Lower Bollinger Band Support
FLOKI price trades at $0.00 with 2.09% decline as technical indicators suggest oversold conditions near Bollinger Band support, presenting potential reversal opportunity.
FLOKI Price Consolidates Near Lower Bollinger Band as Macro Headwinds Weigh on Meme Coin Sentiment
FLOKI trades at $0.00, down 1.13% as JPMorgan's economic warnings and government Bitcoin movements create cautious sentiment across crypto markets.
Floki Market Alert: FLOKI Price Rebounds 2.48% as Technical Indicators Signal Potential Bottom Formation
FLOKI price climbs 2.48% to current levels as technical analysis reveals oversold conditions with RSI at 37.88, suggesting potential reversal opportunity for traders.
FLOKI Price Analysis: Bearish Signals Mount as RSI Drops to 35.65
FLOKI trades with 2.12% daily decline amid weak momentum indicators. Technical analysis reveals oversold conditions with potential support test ahead.
FLOKI Price Analysis: Oversold Conditions Signal Potential Bounce Despite 3.6% Daily Decline
FLOKI trades with oversold RSI at 35.85 after 3.6% decline, testing lower Bollinger Band support amid $11.9M trading volume on Binance.
FLOKI Price Analysis: Meme Coin Shows Weak Bullish Signals Despite -0.18% Daily Decline
FLOKI trades near lower Bollinger Band support with RSI at 39.12, suggesting potential oversold bounce despite modest 24h decline and bearish MACD momentum.
FLOKI Price Falls 0.46% as Technical Indicators Flash Mixed Signals
FLOKI trades near lower Bollinger Band support with RSI at 39.02, showing potential oversold conditions despite recent bearish momentum in the memecoin sector.
FLOKI Price Drops 10.8% as Bearish Momentum Builds - Technical Analysis
FLOKI price falls sharply amid weak market conditions. RSI signals oversold territory while Bollinger Bands indicate potential support test ahead.
FLOKI Price Consolidates Near Neutral Territory as Technical Indicators Show Mixed Signals
FLOKI trades with modest 0.76% daily gains while technical analysis reveals neutral RSI at 48.88, suggesting consolidation phase for the meme coin.
FLOKI Price Struggles as Technical Indicators Signal Mixed Momentum
FLOKI trades at $0.00 with -2.96% daily decline. RSI at 47.69 shows neutral positioning while MACD histogram suggests bullish momentum building for potential reversal.
FLOKI Price Analysis: Neutral RSI and Bullish MACD Signal Mixed Signals for Traders
FLOKI trades with -1.53% decline in 24h as technical indicators show conflicting signals with neutral RSI at 50.42 while MACD histogram turns bullish.
FLOKI Price Surges 5.33% as Technical Indicators Flash Mixed Signals
FLOKI trades with 5.33% daily gains while technical analysis reveals neutral RSI at 52.21 and bullish MACD momentum, creating opportunities for strategic traders.
FLOKI Price Consolidates in Neutral Zone as Technical Indicators Show Mixed Signals
FLOKI holds steady with 0.48% daily gains while RSI sits at 46.93, suggesting sideways action before next major move in the FLOKI/USDT pair.
FLOKI Price Analysis: Neutral RSI Signals Mixed Momentum Despite Recent Gains
FLOKI trades with modest 1.56% daily gains as technical indicators show mixed signals, with RSI at 46.60 suggesting neutral momentum in current market conditions.
Floki Price Drops 7.7% as FLOKI Tests Key Support Levels
FLOKI trades under pressure with 7.7% daily decline, while technical indicators show mixed signals as the meme coin searches for direction in volatile conditions.
FLOKI Price Analysis: Technical Indicators Show Mixed Signals Despite 5.30% Daily Decline
FLOKI trades with bearish momentum after a 5.30% drop, though technical analysis reveals conflicting signals as the RSI remains neutral at 53.86 while momentum indicators suggest potential recovery.
FLOKI Price Surges 9.54% as Technical Indicators Signal Strong Bullish Momentum
FLOKI rallies with impressive 9.54% daily gains as technical analysis reveals strong bullish signals across multiple indicators, positioning for potential breakout.
FLOKI Price Shows Resilience with 3.56% Gain as Technical Indicators Turn Bullish
FLOKI climbs 3.56% amid $16.5M trading volume on Binance, with technical analysis revealing bullish MACD momentum and neutral RSI positioning for potential upside.
FLOKI Price Shows Bullish Momentum Despite $0.00 Trading Levels
FLOKI displays mixed signals with RSI at 49.87 in neutral territory while MACD histogram indicates bullish momentum building for the meme coin.
FLOKI Price Analysis: Bullish Momentum Builds Despite Limited Market Data
FLOKI shows bullish signals with 4.05% daily gains and strong momentum indicators, though price data remains incomplete for comprehensive analysis.
FLOKI Price Analysis: Meme Coin Shows Resilience Despite Staking Yield Cuts
FLOKI trades with 2.88% daily gains amid Bitvavo's staking yield reduction to 0.60%. Technical indicators suggest mixed signals as traders weigh reduced institutional support.
FLOKI Technical Analysis Shows Strong Bullish Signals Despite Staking Yield Reduction
FLOKI trades with 2.11% daily gains amid mixed signals as Bitvavo cuts staking rewards while technical indicators suggest bullish momentum building.
FLOKI Price Analysis: Bearish Momentum Builds Despite Overall Bullish Trend
FLOKI trades with bearish signals as RSI hits 41.14 and recent staking yield cuts raise concerns. Technical analysis reveals key levels to watch.
FLOKI Price Drops 17% After $2.27M Whale Deposit to Binance - Technical Recovery Signals Emerge
FLOKI trades with modest 1.11% daily gains following massive whale sell-off. RSI at 42.15 suggests oversold bounce potential despite bearish MACD signals.
FLOKI Price Faces Bearish Pressure as Technical Indicators Signal Caution
FLOKI trading shows mixed signals with RSI at 40.50 in neutral territory while momentum indicators suggest bearish pressure ahead for traders.
FLOKI Shows Mixed Signals as RSI Drops to 41 Despite 2.75% Daily Gain
FLOKI trades with 2.75% gains but bearish momentum signals emerge. RSI at 41.33 suggests potential oversold conditions developing for the meme coin.
FLOKI Price Analysis: Technical Indicators Signal Mixed Outlook as Token Faces Resistance
FLOKI trades with -2.56% decline amid $14.8M volume. Technical analysis shows neutral RSI at 38.10 while token approaches lower Bollinger Band support levels.
FLOKI Price Analysis: Technical Indicators Signal Mixed Outlook Despite 1.64% Daily Decline
FLOKI trades with bearish momentum as RSI hits 41.99 neutral zone. Technical analysis reveals key support and resistance levels for short-term trading opportunities.
FLOKI Price Drops 11% Despite University of Miami Partnership - Technical Analysis Shows Mixed Signals
FLOKI trades at current levels with neutral RSI at 42.97 following an 11% decline amid market volatility, while new University of Miami partnership provides long-term bullish catalyst.
FLOKI Price Shows Mixed Signals as RSI Hits Neutral Territory
FLOKI trades with -0.67% decline in 24h while technical indicators show conflicting signals. RSI at 41.29 suggests potential oversold bounce ahead.
FLOKI Price Faces Bearish Pressure as RSI Drops to Neutral Territory
FLOKI price declined 4.13% in 24 hours with RSI at 41.65 signaling potential oversold conditions. Technical indicators show mixed signals for the meme coin.
FLOKI Price Analysis: Bearish Momentum Emerges Despite Community Growth
FLOKI trades at neutral levels with RSI at 42.92 showing mixed signals. Extended FlokiUltras3 contest boosts community engagement amid technical uncertainty.
FLOKI Price Drops 4.44% as Technical Indicators Flash Mixed Signals
FLOKI faces volatility with technical analysis showing neutral RSI at 43.35 amid recent whale activity and price target speculation.
FLOKI Price Shows Mixed Signals as RSI Remains Neutral Despite 1.5% Daily Gains
FLOKI trades sideways with 1.5% gains but technical indicators suggest caution as RSI sits at 46.92 in neutral territory while MACD shows bearish divergence.
FLOKI Price Plunges 10.6% as Bearish Momentum Builds Despite Strong Technical Outlook
FLOKI crashes to current levels with heavy selling pressure, though RSI at 46.39 suggests potential oversold bounce ahead for traders.
FLOKI Price Surges 2.41% as Technical Indicators Flash Mixed Signals
FLOKI trades with modest gains while technical analysis reveals neutral RSI and bullish momentum indicators pointing to potential continuation patterns.
FLOKI Price Surges 4.2% as Technical Indicators Flash Mixed Signals
FLOKI trades with bullish momentum despite neutral RSI at 51.62, while daily volume hits $25.4M on Binance spot market with key resistance levels ahead.
FLOKI Price Drops 8.2% Despite Strong Bullish Trend - Technical Analysis
FLOKI trades down 8.2% in 24 hours with RSI at neutral 46.65, while technical indicators suggest underlying bullish momentum remains intact despite short-term weakness.
FLOKI Technical Breakout Signals Strong Bullish Momentum Despite Sideways Price Action
FLOKI price shows neutral momentum at current levels with RSI at 53.87, while technical indicators suggest building bullish pressure for the meme coin favorite.
FLOKI Price Analysis: Bearish Momentum Despite Strong Overall Trend
FLOKI trades down 3.90% in 24 hours amid neutral RSI signals. Technical analysis reveals mixed signals as bears test key support levels.
FLOKI Price Shows Bullish Momentum as Valhalla Update and DAO Investment Drive Recovery
FLOKI trades with 3.57% gains as technical indicators signal bullish reversal following Valhalla game updates and strategic $200K AI token investment by Floki DAO.
FLOKI Price Surges 4.72% Amid Mixed Technical Signals - Neutral RSI at 46.54
FLOKI price gains 4.72% in 24 hours with $15.8M trading volume on Binance. Technical analysis shows neutral RSI at 46.54 while MACD signals bearish momentum.
FLOKI Price Analysis: Meme Coin Shows Mixed Signals Despite 4.59% Daily Decline
FLOKI trades with bearish momentum after 4.59% drop, but technical indicators suggest potential consolidation near key support levels with $22.9M trading volume.
FLOKI Price Shows Bullish Reversal Signs Despite $0.00 Current Level - Technical Analysis
FLOKI displays bullish technical signals with RSI at neutral 48.99 and recent support reclaim at $0.0001125, targeting $0.00028 resistance zone ahead.
FLOKI Price Faces Critical Test as RSI Shows Neutral Positioning
Floki (FLOKI) declined 1.73% in 24 hours as technical indicators signal mixed momentum, with FLOKI RSI at 44.19 suggesting potential for either direction breakout.
FLOKI Price Tests Critical $0.00001375 Resistance as RSI Shows Neutral Momentum
FLOKI trades near key resistance with 17% upside potential to $0.00001550. Technical indicators show mixed signals as traders await breakout confirmation.
FLOKI Price Struggles as Bearish Momentum Builds Despite Oversold Conditions
FLOKI trades in bearish territory with RSI at 45.96 showing neutral momentum, while technical indicators suggest potential reversal opportunity for contrarian traders.
FLOKI Price Tests Support After 40% Rally Correction - Technical Analysis Points to Key Levels
FLOKI trades at consolidation levels following an 8.96% correction from six-month highs, with RSI at neutral 50.47 signaling potential stabilization ahead.
FLOKI Price Drops 10.76% Despite Strong Bullish Trend - Technical Analysis Shows Mixed Signals
FLOKI price faces bearish pressure with 10.76% daily decline, but RSI at 45.89 suggests potential oversold bounce opportunity for traders.
FLOKI Price Faces Correction After 40% Rally - Key Support Levels in Focus
FLOKI trading at $0.00 after 8.96% daily decline, testing crucial support levels following recent 40% surge to six-month highs amid mixed technical signals.
FLOKI Price Shows Mixed Signals After 10% Rebound as Technical Indicators Flash Warning
FLOKI rebounds 10.4% to $0.00001325 but faces bearish momentum signals with RSI at 54.03 in neutral territory amid declining volume concerns.
FLOKI Faces Critical Resistance at $0.00001375 Amid Mixed Technical Signals
FLOKI trades with bearish momentum after 14.5% correction from recent highs. Technical analysis reveals key resistance test at $0.00001375 with potential 25% upside if breakthrough occurs.
FLOKI Price Surges 8.15% as Bullish Momentum Builds - Key Technical Levels to Watch
FLOKI jumps 8.15% in 24h with strong bullish signals emerging. Technical analysis reveals key resistance levels that could determine next move for traders.
FLOKI Price Drops 5.59% Despite Strong Bullish Technical Signals - Key Levels to Watch
FLOKI price fell 5.59% in 24 hours with $75.6M trading volume on Binance, while technical indicators show mixed signals with RSI at 57.49 in neutral territory.
FLOKI Surges 40% to Six-Month High: Technical Breakout Signals Potential Rally to $0.00025
FLOKI price reaches six-month high with 40% surge driven by technical breakout and whale accumulation. RSI overbought at 78.85 suggests caution ahead.
FLOKI Surges 40% to Six-Month High as Technical Breakout Signals More Gains Ahead
FLOKI trading at $0.0001381 after spectacular 40% rally breaks key resistance, with technical analysis pointing to potential $0.00025 target as momentum builds.
Floki (FLOKI) Surges 40% to Six-Month High: Technical Breakout Signals Potential Rally to $0.00025
FLOKI rockets 40% after breaking key resistance, reaching $0.000138 six-month high. Triple EMA crossover and whale accumulation suggest further upside potential.
FLOKI Crypto Surges 40% to Six-Month High: Technical Analysis Shows $0.00025 Target Possible
FLOKI breaks out to six-month highs with 40% surge, Webull Pay listing, and Valhalla launch driving bullish momentum. Technical indicators suggest potential rally to $0.00025.
Floki (FLOKI) Surges 40% to Six-Month High: What’s Driving This Momentum?
Floki (FLOKI) has surged 40% to a six-month high, driven by bullish market momentum, strategic partnerships, and regulatory achievements. Is it time to buy?
Floki Inu (FLOKI) Surges with MiCA Compliance, Webull Listing, and Valhalla Mainnet Launch
Floki Inu (FLOKI) has rallied over 40% in a week, driven by MiCA compliance, Webull Pay listing, and the Valhalla mainnet launch. Here's why FLOKI is soaring.
FLOKI (FLOKI) Surges 25% Amid MiCA Compliance, Webull Listing, and Valhalla Mainnet Launch
FLOKI Inu (FLOKI) sees a 25% price surge following MiCA compliance, Webull listing, and the Valhalla mainnet launch. Learn about its impact, technicals, and outlook.
FLOKI (FLOKI) Surges with MiCA Compliance, Webull Listing, and Valhalla Mainnet Launch
FLOKI Inu (FLOKI) surged 25% last week, driven by MiCA compliance, a Webull Pay listing, and the Valhalla mainnet launch. With bullish momentum, FLOKI eyes a 50% rally.
Floki (FLOKI) Surges Amid MiCA Compliance, Webull Listing, and Valhalla Mainnet Launch
Floki (FLOKI) makes headlines as the first MiCA-compliant token in Europe, launches its Valhalla mainnet, and secures a Webull listing. Bullish momentum points to a potential 50% rally.
Floki (FLOKI) Gains Momentum: Valhalla Launch, Webull Listing, and Bullish Price Action
Floki (FLOKI) surges with bullish momentum following Valhalla's mainnet launch, Webull Pay integration, and strong technical indicators signaling a potential rally.
Floki (FLOKI) Price Rally Looms Amid Webull Pay Listing and Valhalla Launch
Floki (FLOKI) is gaining bullish momentum after its listing on Webull Pay and the launch of the Valhalla mainnet. Technical signals suggest a potential 50% rally.
Blockchain Application in Healthcare to Cross $500 Million by 2022
Frost & Sullivan, a world-renowned firm that offers insights on disruptive technologies and economic changes, has revealed an analysis dubbed ‘Global Blockchain Technology Market in the Healthcare Industry, 2018-2022’ that blockchain investment is expected to surpass $500 million by 2022.
FTX Token Tests Lower Bollinger Band as Technical Selling Pressure Mounts
FTT price drops 5.47% to $0.78 amid bearish MACD signals and weak momentum, approaching critical technical support levels in absence of major catalysts.
FTX Token Tests $0.80 Support as Market Volatility Continues Amid Bitcoin Weakness
FTX Token trades at $0.80 following a 3.6% decline, testing key support levels as broader crypto market weakness persists with Bitcoin correlation intact.
FTT Technical Breakdown: Momentum Shift Following SBF's Surprise Post and $1.6B Repayment News
FTT price hits $0.95 with bullish signals emerging. RSI neutral at 53, MACD turning positive after SBF's social media activity sparked 24% surge. Key resistance at $1.30.
FTX Token (FTT) Rallies to $0.92 as Social Media Drama Fuels 24% Weekly Surge
FTT price trades at $0.92 with bullish momentum after Sam Bankman-Fried's cryptic social media post triggered a massive rally, though overbought conditions signal caution ahead.
FTX Token (FTT) Drops 7.45% Despite Bullish Technical Signals - Key Levels to Watch
FTT price falls to $0.91 (-7.45% in 24h) but technical indicators suggest potential reversal ahead. RSI neutral at 51.23 with bullish MACD divergence emerging.
FTX Token (FTT) Surges 18% as Bulls Target $1.30 Resistance
FTT price climbs to $0.97 with strong bullish momentum emerging from technical indicators. Key resistance at $1.30 presents next major test for buyers.
FTX Token (FTT) Tests Key Support at $0.83 as Technical Indicators Show Mixed Signals
FTT price currently trades at $0.83, up 0.24% in 24h, with technical analysis revealing neutral RSI and emerging bullish MACD momentum despite weak overall trend.
FTT Price Faces Resistance at $0.96 as Bullish Momentum Builds Despite 7.88% Daily Decline
FTX Token trades at $0.91 after a 7.88% drop, but technical indicators show bullish MACD signals emerging near key Bollinger Band resistance levels.
FTX Token (FTT) Breaks Above $1.00 Resistance as Bullish Momentum Builds
FTT price surges 3.27% to $1.00, breaking key resistance levels with strong momentum indicators signaling potential continuation of the bullish trend.
FTX Token Surges 21% as FTT Price Breaks Above Key Resistance at $0.99
FTT price rallies 21.21% to $0.99, breaking critical resistance levels with overbought RSI signaling potential consolidation ahead for traders.
FTX Token (FTT) Surges 20% to $0.96 Amid Strong Technical Momentum
FTT price jumps 20% to $0.96 in 24 hours with bullish MACD signals and RSI at 67, breaking above key resistance levels on strong volume.
FTX Token (FTT) Hovers Near Support at $0.79 as Technical Indicators Signal Mixed Outlook
FTT price trades at $0.79 down 1.08% in 24h, with RSI at 43.31 suggesting neutral momentum while MACD shows early bullish divergence signals for potential reversal.
FTX Token (FTT) Hovers Near Support at $0.81 as Technical Indicators Signal Mixed Momentum
FTT price trades at $0.81 with +2.92% daily gains, but faces key resistance at $0.89 while technical indicators show conflicting signals for traders.
FTX Token (FTT) Tests Critical Support at $0.79 as Bears Dominate
FTT price drops 5.18% to $0.79 amid weak technical signals. RSI at 42 suggests neutral momentum while key support levels hold for now.
FTX Token (FTT) Battles at $0.83 as Technical Indicators Show Mixed Signals
FTT price drops 2.10% to $0.83 as the token trades in neutral territory with RSI at 49, while MACD shows early bullish momentum despite broader bearish context.
FTX Token (FTT) Shows 6% Rally as Bullish Momentum Builds Above Key Support
FTT price surges 6.12% to $0.85 with bullish MACD divergence signaling potential upside momentum ahead despite neutral RSI readings at current levels.
FTX Token (FTT) Shows Modest Recovery as Technical Indicators Signal Neutral Territory
FTT price climbs 1.47% to $0.81, trading above key moving averages while RSI remains in neutral zone, suggesting sideways consolidation ahead.
FTX Token (FTT) Holds $0.80 Support as Technical Indicators Show Mixed Signals
FTT price trades at $0.80 (+1.67% in 24h) with RSI at 43.28 showing neutral momentum while MACD histogram suggests potential bullish divergence ahead.
FTX Token (FTT) Hovers Near Support at $0.79 Amid Neutral Technical Signals
FTT price trades at $0.79 with modest 0.43% daily gains, but technical indicators suggest caution as token remains below key moving averages with bearish momentum signals.
FTX Token (FTT) Hovers Near Critical Support at $0.79 as Bears Test Key Levels
FTT price trades at $0.79 with modest 0.88% gains, but technical indicators suggest bearish pressure building as the token approaches crucial support zones.
FTX Token (FTT) Struggles Below $1 as Bears Maintain Control
FTT price holds at $0.79 (+1.72% in 24h) but faces resistance from declining moving averages and bearish momentum indicators across all timeframes.
FTX Token (FTT) Tests Key Support at $0.76 as Technical Indicators Signal Oversold Territory
FTT price drops to $0.77 (-0.09% in 24h) as technical indicators show bearish momentum, but RSI at 36.60 suggests potential bounce from support levels.
FTX Token (FTT) Hovers Near Support at $0.78 as Bears Maintain Control
FTT price trades at $0.78 amid bearish momentum signals, with RSI at 37.91 and key support at $0.76 being tested in low-volume conditions.
FTX Token (FTT) Tests Critical Support at $0.76 Amid Bearish Technical Signals
FTT price hovers at $0.79 with bearish momentum indicators and key support levels under pressure as technical analysis reveals concerning signals.
FTX Token (FTT) Technical Analysis Shows Oversold Conditions Near Key Support at $0.76
FTT price currently trades at $0.79, up 0.64% in 24h but showing bearish momentum signals. Technical indicators suggest potential bounce from lower Bollinger Band support.
FTX Token (FTT) Struggles Near $0.79 as Technical Indicators Flash Warning Signals
FTT price drops to $0.79 (-0.09% in 24h) as bearish momentum builds. Technical analysis reveals concerning signals with RSI at 36.90 and price testing key support levels.
FTX Token (FTT) Tests Critical Support at $0.78 Amid Bearish Momentum
FTT price drops 4.5% to $0.81, approaching key support levels as technical indicators signal potential further downside risks for traders.
FTX Token (FTT) Hovers Near Critical Support at $0.85 as Bears Test Lower Bounds
FTT price trades at $0.85 with neutral momentum as technical indicators signal potential breakdown below key support levels in coming sessions.
FTX Token (FTT) Consolidates Near $0.84 as Bears Test Critical Support Levels
FTT price holds steady at $0.84 with modest 1.25% gains, but technical indicators suggest potential downside pressure as token trades near Bollinger Band lower support.
FTX Token (FTT) Tests Lower Bollinger Band Support at $0.83 Amid Neutral RSI Signals
FTT price drops 4.24% to $0.83, testing critical support levels as technical indicators show mixed signals with RSI at 39.40 suggesting potential oversold conditions.
FTX Token (FTT) Shows Bearish Momentum as Price Tests Support at $0.87
FTT price holds at $0.87 with bearish MACD signals and RSI in neutral territory, testing critical support levels near Bollinger Band lower boundary.
FTX Token (FTT) Faces Bearish Pressure at $0.91 as Technical Indicators Flash Mixed Signals
FTT price drops 3.64% to $0.91 amid neutral RSI readings and bearish MACD momentum, testing key support levels near pivot point at $0.92.
FTX Token (FTT) Climbs to $0.95 as Bulls Fight Back Despite Creditor Uncertainty
FTT price surges 4.55% to $0.95 as technical indicators show mixed signals while $16.5B creditor repayment plan creates market uncertainty for traders.
FTX Token (FTT) Tests Critical Support at $0.92 After 6.6% Daily Drop
FTT price drops to $0.92 (-6.61% daily) as technical indicators flash mixed signals. Key support at $0.86 could determine next move for FTX Token.
FTX Token (FTT) Breaks Above Key Resistance as Technical Indicators Flash Bullish
FTT price surges 3.60% to $0.97, breaking above multiple moving averages with bullish MACD signals pointing to potential continuation rally.
FTX Token (FTT) Battles Bears at $0.92 Despite $16.5B Creditor Repayment Plan
FTT trades at $0.92 with -2.62% daily decline as bearish sentiment overrides positive creditor distribution news, testing key support levels ahead of August 15 record date.
FTX Token (FTT) Shows Bullish Momentum Above Key Support at $0.94
FTT price holds steady at $0.94 with neutral RSI and bullish MACD signals suggesting potential upward movement toward $1.09 resistance level.
FTX Token (FTT) Struggles at $0.94 as Bears Override $16.5B Creditor Repayment Rally
FTT price holds $0.94 despite bearish pressure overriding positive creditor news. Technical indicators show mixed signals with key support at $0.86.
FTX Token (FTT) Shows Bullish Momentum Despite Mixed Signals at $0.94
FTT price surged 3.76% to $0.94 with neutral RSI at 52.72, suggesting potential upside room while trading above key support levels in current bullish trend.
FTX Token (FTT) Drops to $0.89 as Bears Override $16.5B Creditor Repayment Rally
FTT price sits at $0.89 (+1.21% today) as technical indicators signal bearish momentum despite recent creditor repayment announcement boost.
FTX Token (FTT) Plunges to $0.88 as Bears Override Creditor Repayment Rally
FTT price drops 3.71% to $0.88 despite recent surge on $16.5B creditor repayment news. Technical indicators signal potential further downside risk.
FTX Token (FTT) Consolidates at $0.91 as Creditor Repayment Plan Drives Recovery
FTT price stabilizes at $0.91 following major creditor repayment announcement, with technical indicators showing mixed signals as bulls defend key support levels.
FTX Token (FTT) Rebounds to $0.91 as $16.5B Creditor Repayment Plan Sparks Interest
FTT price recovers to $0.91 (+0.74%) following FTX's major creditor repayment announcement, though technical indicators show mixed signals ahead.
FTX Token (FTT) Battles Key Support at $0.90 Amid $16.5B Creditor Repayment Momentum
FTT price holds $0.90 after recent volatility, with technical indicators showing mixed signals as the $16.5B FTX creditor repayment plan provides fundamental support.
FTX Token (FTT) Drops 4.70% to $0.91 Despite $16.5B Creditor Repayment Plan Boost
FTT price retreats to $0.91 (-4.70%) as profit-taking emerges following recent surge driven by FTX's massive creditor repayment announcement.
FTX Token (FTT) Surges 8.57% to $0.98 Amid $16.5B Creditor Repayment Plan
FTT price climbs to $0.98 with 8.57% daily gains as FTX's massive creditor repayment announcement drives renewed investor interest in the exchange token.
FTX Token (FTT) Recovers 3.88% but Bears Still Eye $0.81 Support Level
FTT price rebounds to $0.94 (+3.88%) after recent declines, but technical indicators show mixed signals as bears target key support levels below $1.
FTX Token (FTT) Drops 5% as Bears Target $0.81 Support Level
FTT price falls to $0.92 amid bearish momentum signals, with technical indicators pointing to potential test of key support at $0.81 in the near term.
FTX Token (FTT) Drops 6% Despite Creditor Payout News - Technical Analysis Reveals Key Levels
FTT price falls to $0.91 (-6.19% in 24h) as traders digest mixed regulatory news. Technical indicators show neutral RSI but bearish momentum signals ahead.
FTX Token (FTT) Battles Key Support at $0.95 as Technical Indicators Turn Mixed
FTT price drops 2.03% to $0.95 amid bearish momentum signals, testing critical pivot point as traders watch $0.79 support level for potential breakdown.
FTX Token (FTT) Shows Bullish Momentum as Price Climbs 3.6% to $0.96
FTT price surges to $0.96 with bullish MACD signals and RSI in neutral territory, suggesting potential upward momentum despite trading below key moving averages.
FTX Token (FTT) Tests Critical $0.96 Support as RSI Shows Neutral Momentum
FTT price trades at $0.96 (-1.98% in 24h) with RSI at 53.76 suggesting neutral momentum. Technical indicators reveal mixed signals as FTX Token approaches key support levels.
FTT Price Surges to $1.06 Despite Overbought RSI Conditions
FTX Token trades at $1.06 after a 2.57% decline, showing bullish momentum despite FTT RSI reaching overbought levels at 70.13, signaling potential consolidation ahead.
Surge in Generative AI Interest: Insights from Twitter Discussions
A recent study titled "Public perception of generative AI on Twitter: an empirical study based on occupation and usage" unveils a broad spectrum of sentiments and uses of generative AI across various occupations, highlighting the technology's impact and ethical considerations.
California Advances in Generative AI with New Report
The Newsom Administration's report on Generative AI outlines California's approach to regulating and embracing this technology, emphasizing education and workforce training for responsible use.
GitHub Enhances CodeQL with Rust Security and Multi-Language Improvements
GitHub's CodeQL 2.23.2 update introduces enhanced Rust security detections and accuracy improvements across various programming languages, including JavaScript, Python, Ruby, and Go.
Glassnode Enhances ERC-20 Token Analysis: Over 500 New Tokens Supported
Glassnode expands its ERC-20 token support, adding over 500 new tokens and introducing granular metrics for enhanced on-chain analysis of the Ethereum ecosystem.
Gold Regains Its Old Shines While Bitcoin Struggles to Maintain $37,500 Level
Gold moves higher while Bitcoin still struggles to maintain the support of around $37,000.
Gold's Cautionary Tale: Market Dynamics Amid Geopolitical and Economic Challenges
Gold's influence on market confidence amid economic deficits and geopolitical tensions, while AI innovation shapes future growth, according to VanEck's August analysis.
Recent Crypto Sell-Off Hasn’t Deterred Investors, Grayscale CEO Says
Investors are still optimistic despite the current market crash, said Grayscale's CEO.
HBAR Price Prediction: Testing $0.12 Critical Support - Target $0.18 by January 2025
HBAR trades at critical $0.12 support with bearish momentum. Technical analysis suggests potential bounce to $0.18 if support holds, or drop to $0.10 if broken.
HBAR Price Prediction: Targeting $0.16 Breakout with 14% Upside Potential by December 2025
HBAR price prediction shows bullish momentum building at $0.14 support. Technical analysis suggests $0.16 target within weeks, with longer-term Hedera forecast eyeing $0.42.
HBAR Price Prediction: Targeting $0.19 Amid Bullish Momentum Through January 2026
HBAR price prediction points to $0.19+ target as technical indicators show early bullish momentum despite trading 53% below yearly highs at $0.14 current levels.
HBAR Price Prediction: Targeting $0.16 Recovery as Technical Indicators Signal Potential Reversal by Year-End 2025
HBAR price prediction points to $0.16 short-term target as oversold conditions and bullish MACD divergence suggest recovery from current $0.14 level within 1-2 weeks.
HBAR Price Prediction: Targeting $0.16 Bounce from Oversold Levels Within 2 Weeks
Hedera (HBAR) shows bullish MACD divergence at key support. Technical analysis suggests $0.16 price target possible as RSI recovers from oversold territory.
HBAR Price Prediction: Targeting $0.18-$0.20 Recovery Within 30 Days Despite Current Weakness
HBAR price prediction shows potential 28-43% upside to $0.18-$0.20 range within one month, despite current bearish pressure below key moving averages.
HBAR Price Prediction: Target $0.197 by Late December 2025 as Technical Momentum Builds
HBAR price prediction points to $0.197 target within 4 weeks as bullish MACD histogram and neutral RSI create favorable setup for Hedera's next breakout move.
HBAR Price Prediction: Targeting $0.1517 Short-Term with Potential Breakout to $0.18 by Year-End
HBAR price prediction shows mixed signals with RSI at 34.66 suggesting oversold conditions. Technical analysis points to $0.1517 target within one week, potential rally to $0.18.
HBAR Price Prediction: Targeting $0.18-$0.20 Range with Critical $0.16 Breakout Test Ahead
HBAR price prediction analysis reveals potential 38-54% upside to $0.18-$0.20 if key resistance at $0.16 EMA breaks, with critical support at $0.12 floor.
HBAR Price Prediction: Targeting $0.18-$0.20 by December 2025 Amid Key Resistance Test
HBAR price prediction points to potential 20-33% upside targeting $0.18-$0.20 if resistance at $0.16 EMA breaks, with critical support holding at $0.12 level.
HBAR Price Prediction: Target $0.18-$0.20 Within Four Weeks as Technical Breakout Looms
HBAR price prediction shows potential 20-33% upside to $0.18-$0.20 range if $0.16 EMA resistance breaks, with critical support at $0.12 defining bullish continuation.
HBAR Price Prediction: Target $0.18-0.20 by December 2025 as Technical Indicators Show Mixed Signals
HBAR price prediction suggests potential 28-43% upside to $0.18-0.20 range within 4 weeks, despite current consolidation below key moving averages at $0.14.
HBAR Price Prediction: Targeting $0.17 Recovery by December 2025 Despite Current Bearish Signals
HBAR price prediction shows potential 30% upside to $0.17 by December 2025, but must first hold critical $0.12 support amid current technical weakness.
HBAR Price Prediction: $0.16 Target by December 2025 as Technical Indicators Signal Recovery
HBAR price prediction suggests a potential 23% upside to $0.16 by December 2025, with key resistance at $0.20 and critical support at $0.12 based on current technical setup.
HBAR Price Prediction: Target $0.163 Despite Bearish Momentum - Critical Support at $0.14
HBAR price prediction shows potential recovery to $0.163 short-term despite 7.20% daily decline. Critical support at $0.14 must hold for Hedera forecast upside.
HBAR Price Prediction: Targeting $0.22-$0.25 Recovery Within 4-6 Weeks Despite Near-Term Bearish Pressure
HBAR price prediction shows mixed signals with bearish momentum potentially driving prices to $0.113 short-term, but oversold conditions suggest $0.22-$0.25 recovery targets.
HBAR Price Prediction: Recovery to $0.22-$0.25 Expected by December 2025 Despite Current Bearish Momentum
HBAR price prediction targets $0.22-$0.25 recovery within 4-6 weeks as oversold RSI and Bollinger Band support suggest potential reversal from current $0.15 levels.
HBAR Price Prediction: Technical Analysis Points to $0.22 Retest Before Potential Breakout to $0.24
HBAR price prediction indicates a potential bounce from current $0.16 support toward $0.22 resistance, with medium-term Hedera forecast targeting $0.24 if bulls regain control.
HBAR Price Prediction: Recovery to $0.22-$0.25 Expected Within 30 Days
HBAR price prediction suggests recovery to $0.22-$0.25 range over next month as oversold RSI and Bollinger Band support signal potential reversal from current $0.16 levels.
HBAR Price Prediction: Targeting $0.22-0.24 Breakout Within 2-4 Weeks
HBAR shows bullish momentum signals with MACD histogram turning positive. Technical analysis suggests potential move to $0.22-0.24 resistance zone if current support holds.
HBAR Price Prediction: Targeting $0.22 by December 2025 Despite Near-Term Headwinds
HBAR price prediction shows mixed signals with short-term targets at $0.169-$0.176 range, but Hedera forecast points to $0.22 upside potential by December amid institutional interest.
HBAR Price Prediction: Targeting $0.30 by December 2025 as Hedera Tests Critical Breakout Level
HBAR price prediction suggests a potential move to $0.30 within weeks if bulls can reclaim the $0.175 resistance. Current technical setup shows neutral momentum at $0.18.
HBAR Tests Key $0.18 Support as Bitcoin's $105K Drop Triggers Altcoin Selloff
Hedera price consolidates at $0.18 amid crypto market downturn following Bitcoin's significant decline, with institutional buying providing underlying support signals.
HBAR Price Surges 8.4% as Hedera Tests Key Resistance at $0.18 Amid Quiet News Cycle
Hedera (HBAR) climbs 8.4% to $0.18 in technical-driven rally, testing critical resistance levels as traders position ahead of potential breakout despite absence of major catalysts.
HBAR Tests Lower Bollinger Band Support at $0.16 as Crypto Markets Face Broad Selling Pressure
Hedera (HBAR) trades near $0.16 support level with RSI at 33.98, suggesting potential oversold bounce as token approaches critical technical inflection point amid broader market weakness.
HBAR Tests Key $0.16 Support as Geopolitical Tensions Spark 11% Weekly Decline
Hedera's HBAR price finds itself at a critical juncture at $0.16, down 3.4% daily, as escalating geopolitical tensions and regulatory concerns drive sustained selling pressure across crypto mark...
Hedera Price Action: HBAR Consolidates Near Support as Technical Indicators Flash Mixed Signals
HBAR price trades at $0.22 with modest 2.69% gains while technical analysis reveals neutral RSI and bearish MACD, suggesting consolidation phase ahead.
HBAR Price Drops 1.36% as Hedera Tests Critical Support at $0.21
HBAR trades at $0.21 with RSI at 38, approaching oversold territory. Technical indicators suggest potential bounce from strong support level.
HBAR Price Drops 4.7% as Technical Indicators Flash Mixed Signals
Hedera (HBAR) trades at $0.21 after a 4.66% decline, with RSI at oversold levels suggesting potential bounce while MACD remains bearish.
HBAR Price Consolidates at $0.22 as Hedera Shows Mixed Technical Signals
HBAR trades flat at $0.22 with bearish momentum indicators offset by bullish long-term trend, creating key decision point for traders.
HBAR Price Holds $0.22 as Technical Indicators Signal Mixed Momentum
Hedera (HBAR) trades at $0.22 with 2.67% daily gains, but technical analysis reveals conflicting signals as RSI sits neutral while MACD shows bearish divergence.
Hedera (HBAR) Drops 9% as Technical Indicators Signal Oversold Conditions
HBAR price falls to $0.22 amid bearish momentum, but RSI at 38 suggests potential bounce from current support levels near Bollinger Band lower boundary.
HBAR Price Analysis: Hedera Shows Bullish Momentum Despite Minor Decline
HBAR trades at $0.24 with -1.14% daily drop, but technical indicators suggest bullish momentum building as Hedera approaches key resistance levels.
HBAR Price Shows Bullish Momentum Despite 24-Hour Decline at $0.24
Hedera (HBAR) trades at $0.24 with strong technical indicators signaling potential upward movement despite recent -0.77% decline in daily trading.
HBAR Price Analysis: Hedera Breaks Above Key Moving Averages Despite 2.3% Daily Decline
HBAR trades at $0.24 with bullish momentum indicators despite daily decline. Technical analysis reveals strong positioning above 200-day MA with resistance at $0.25.
HBAR Price Surges 5.48% as Technical Indicators Flash Strong Bullish Signals
Hedera (HBAR) climbs to $0.25 amid bullish momentum indicators and key resistance tests, with RSI holding neutral territory at 57.80.
HBAR Price Analysis: Hedera Shows Bullish Momentum Despite Market Uncertainty
HBAR trades at $0.23 with bullish technical signals emerging as Grayscale's ETF filing continues to support institutional interest in Hedera's enterprise-grade blockchain.
HBAR Price Rallies 5% as Grayscale ETF Filing Sparks Institutional Interest
Hedera's HBAR token surged to $0.24 (+3.11% in 24h) following Grayscale's ETF conversion filing, with technical indicators showing bullish momentum building.
HBAR Price Holds $0.23 Support Despite 3.3% Decline as ETF Decision Looms
Hedera (HBAR) trades at $0.23 after a 3.3% drop, showing resilience above key support while Grayscale's ETF proposal awaits SEC decision by November 12th.
Hedera (HBAR) Eyes Recovery After 4% Dip Despite ETF Filing Momentum
HBAR trades at $0.24 following a 4.22% decline, but bullish technical signals and Grayscale's ETF filing suggest potential upside toward $0.26 resistance levels.
HBAR Price Surges 3.93% as Hedera Approaches Upper Bollinger Band Resistance
HBAR trades at $0.25 with strong bullish momentum as technical indicators signal potential breakout above key resistance levels.
HBAR Price Surges 5% as Grayscale ETF Filing Sparks Institutional Interest
HBAR trades at $0.24 with bullish momentum after Grayscale's ETF conversion filing. Technical indicators suggest continued upside potential for Hedera.
HBAR Price Surges 3.14% to $0.23 as Bulls Target September Breakout
Hedera (HBAR) trades at $0.23 with 3.14% daily gains as technical indicators suggest potential rally toward $0.35 resistance despite recent volatility concerns.
HBAR Price Recovers to $0.23 Despite Recent 4% Slump - SWIFT Partnership Could Drive Breakout
Hedera (HBAR) trades at $0.23 with neutral RSI at 47.80. Recent SWIFT collaboration news battles technical breakdown signals as traders eye $0.26 resistance.
HBAR Price Struggles at $0.22 as SEC ETF Decision Looms
Hedera trades at $0.22 with mixed signals as technical breakdown meets bullish predictions while SEC extends ETF review to September 9th.
HBAR Price Breaks Below $0.22 Support as Technical Indicators Flash Bearish Signals
HBAR trades at $0.22 (+1.27% today) but faces mounting selling pressure despite positive network developments including new stablecoin launch and Sibos 2025 participation.
HBAR Price Drops 4% as Technical Breakdown Triggers Selling Despite Partnership News
Hedera (HBAR) trades at $0.22 after a 4% decline from technical breakdown, while RSI at 41.31 signals potential oversold conditions ahead.
HBAR Price Retreats to $0.22 as Technical Breakdown Sparks Sell-Off
Hedera's HBAR token trades at $0.22 after a 4% decline triggered by technical breakdowns, but upcoming Sibos 2025 participation could spark institutional interest.
HBAR Price Analysis: Hedera Tests $0.21 Support as September Rally Potential Builds
HBAR trades at $0.22 (-2.40% daily) near critical support, with analysts eyeing $0.40 surge potential amid Sibos 2025 and SWIFT integration speculation.
HBAR Price Rebounds to $0.22 Despite 4% Weekly Dip - Technical Analysis Shows Mixed Signals
HBAR trades at $0.22 with 3.59% daily gains following recent support level bounce, but weekly volatility keeps traders cautious amid $0.33 price targets.
HBAR Price Drops 0.35% as Hedera Tests Critical Support at $0.21
HBAR trades at $0.22 with RSI at 39.45, approaching oversold territory while testing key support levels amid bearish momentum signals.
HBAR Price Analysis: Hedera Tests Lower Bollinger Band Support at $0.22
HBAR trades at $0.22 (-1.42% in 24h) near critical support levels as technical indicators show mixed signals with RSI at 41.79 in neutral territory.
HBAR Price Hovers Near Support at $0.23 as Technical Indicators Flash Mixed Signals
Hedera (HBAR) trades at $0.23 amid neutral market conditions. RSI shows oversold relief while Bollinger Bands suggest potential bounce from lower support zone.
HBAR Price Struggles at $0.22 as Bearish Momentum Builds Despite Bullish Overall Trend
Hedera (HBAR) trades at $0.22 after 2.07% decline, testing lower Bollinger Band support while technical indicators show mixed signals for traders.
HBAR Price Falls 4.5% as Hedera Tests Critical Support at $0.23
HBAR price drops to $0.23 amid bearish momentum signals, with Hedera approaching lower Bollinger Band support and RSI showing neutral conditions at 43.25.
HBAR Price Holds $0.24 Support as Hedera Technical Indicators Show Mixed Signals
HBAR trades at $0.24 (-1.53% daily) with RSI at 46.62 showing neutral momentum. Key resistance at $0.28 remains crucial for bullish continuation.
HBAR Price Faces Correction After Recent Surge - Technical Analysis Shows Mixed Signals
HBAR trades at $0.25 after 3.74% decline, testing key support levels while BlackRock ETF speculation provides underlying bullish sentiment for Hedera investors.
HBAR Price Surges to $0.26 as BlackRock ETF Speculation Fuels Hedera Rally
HBAR trades at $0.26 (+2.41% in 24h) as speculation around a potential BlackRock spot ETF filing drives institutional interest and whale accumulation continues.
HBAR Price Drops 8.46% Despite BlackRock ETF Speculation - Key Support at $0.23
Hedera (HBAR) trades at $0.25 amid mixed signals as BlackRock ETF rumors clash with today's bearish momentum. Technical indicators suggest critical support test ahead.
HBAR Price Rallies 3.26% as Hedera Breaks Key Resistance with Whale Accumulation
HBAR trades at $0.27, up 3.26% in 24h, after breaking $0.2635 resistance on strong volume. Technical indicators suggest continued bullish momentum ahead.
HBAR Price Surges Above $0.26 as Hedera Bulls Target $0.30 Resistance
HBAR trades at $0.26 (+4.20% daily) after whale accumulation drives market cap beyond $11B. Bulls eye key $0.30 resistance as technical indicators show mixed signals.
HBAR Price Retreats 5.89% After Breaking Key Resistance - Technical Analysis Shows Mixed Signals
Hedera (HBAR) trades at $0.25 after a 5.89% decline, following recent resistance breakout at $0.2635. Technical indicators suggest consolidation phase ahead.
HBAR Price Surges Past $0.26 as Whale Accumulation Fuels 7% Weekly Rally
HBAR trades at $0.26 with bullish momentum as whale accumulation drives the token to an $11 billion market cap, eyeing $0.30 resistance breakthrough.
HBAR Price Faces Correction After Recent Rally - Technical Analysis Shows Mixed Signals
Hedera (HBAR) trades at $0.26 with -3.51% daily decline, testing key support levels after impressive 7% gains earlier this week amid whale accumulation.
HBAR Price Surges Above $0.27 as Whale Accumulation Drives Hedera Rally
HBAR trades at $0.27 (+0.65% daily) after whale-driven 7.72% surge yesterday. Technical indicators show bullish momentum with RSI at 58.71 and strong institutional interest.
HBAR Price Consolidates at $0.24 as Hedera Shows Mixed Technical Signals
HBAR trades at $0.24 with +2.16% daily gains despite neutral RSI at 51. Robinhood listing momentum faces resistance at $0.30 level.
HBAR Price Analysis: Technical Indicators Signal Mixed Outlook Despite Robinhood Boost
HBAR trades at $0.24 (-2.13% daily) as Robinhood listing momentum fades. Technical analysis reveals neutral RSI but bearish MACD signals amid key resistance at $0.30.
HBAR Price Shows Resilience at $0.24 Despite Mixed Technical Signals After Robinhood Boost
Hedera (HBAR) trades at $0.24 with modest 0.44% daily gains, maintaining momentum from recent Robinhood listing while technical indicators signal consolidation phase ahead.
HBAR Price Shows Mixed Signals as Hedera Trades at $0.24 Amid Neutral Technical Setup
HBAR price currently sits at $0.24, down 1.84% in 24 hours, with technical indicators painting a mixed picture as momentum oscillators signal neutral conditions.
HBAR Price Rallies 5.5% as Robinhood Listing Drives Hedera Recovery
HBAR trades at $0.27 with 5.5% daily gains following Robinhood listing impact, while technical indicators show mixed signals amid consolidation phase.
HBAR Price Drops 6.7% Despite Robinhood Rally - Technical Analysis Shows Mixed Signals
HBAR trades at $0.25 after a 6.74% daily decline, pulling back from recent Robinhood listing gains. Technical indicators show neutral RSI at 55.94 with bearish MACD momentum.
HBAR Price Holds $0.27 After Robinhood Listing Surge as Technical Indicators Show Mixed Signals
HBAR trades at $0.27 despite 4.37% daily decline, maintaining bullish momentum from Robinhood listing while technical analysis reveals conflicting signals for traders.
HBAR Price Retreats 6% Despite Robinhood Listing Boost - Key Levels to Watch
HBAR trades at $0.27 after a 6.14% daily decline, but technical indicators remain bullish following last week's Robinhood listing surge that drove prices up 12%.
HBAR Price Surges 5.56% to $0.28 as Robinhood Listing Drives Hedera Rally
HBAR trades at $0.28 with bullish momentum following Robinhood listing. Technical indicators show strong uptrend with RSI at 69.42 signaling continued strength.
HBAR Price Jumps 13.84% to $0.27 as Hedera Shows Strong Bullish Momentum
HBAR trades at $0.27 with impressive 13.84% daily gains, breaking above key moving averages as Hedera technical analysis reveals bullish momentum despite overbought RSI conditions.
HBAR Price Consolidates at $0.24 as Hedera Shows Mixed Technical Signals After July Rally
HBAR trades at $0.24 (-1.25% in 24h) as technical indicators show neutral momentum following July's massive 100%+ surge and recent profit-taking pullback.
HBAR Price Retreats to $0.25 Despite Strong July Rally and Technical Breakout Signals
HBAR trades at $0.25 after July's 100%+ surge, with technical indicators showing bullish momentum despite recent 3.9% pullback from resistance levels.
HBAR Price Retreats 3.9% Despite Bullish Technical Signals After 50% Rally
HBAR trades at $0.27 following a -3.9% pullback, but technical indicators remain bullish with RSI at 76.55 signaling overbought conditions after last week's major surge.
HUSD Stablecoin Drops 56% From Dollar Peg Following Huobi Delisting
According to CoinMarketCap, HUSD stablecoin has fallen massively from its $1 peg, dropping to a low of $0.32 following delisting from crypto exchange Huobi on Friday last week.
Hyperliquid (HYPE) Faces Potential Pullback as TD Sequential Flashes Sell Signal
Hyperliquid (HYPE) sees a potential short-term retreat as the TD Sequential indicator suggests a sell signal, despite strong on-chain fundamentals.
Understanding Ichimoku Cloud: A Comprehensive Guide to Trading Strategy
Explore the Ichimoku Cloud, a Japanese charting technique offering insights into trend, momentum, and market equilibrium. Learn its components and practical applications for informed trading.
Internet Computer Tests 52-Week Low at $3.01 as Bearish Momentum Intensifies
ICP price holds above critical $3.01 support level at $3.02, down 1.3% in 24 hours as technical indicators signal continued weakness without major news catalysts driving the decline.
ICP Drops to 52-Week Low at $3.00 as Bitcoin Selloff Triggers Crypto Market Rout
Internet Computer (ICP) falls to yearly lows at $3.00 amid 4.7% daily decline as Bitcoin's drop below $112,000 pressures altcoins despite recent AI integration milestone.
ICP Traders Watch: Internet Computer Shows Modest Recovery Despite Technical Headwinds
ICP price reaches $4.25 with 2.73% daily gains, but technical indicators suggest caution as Internet Computer faces multiple resistance levels ahead.
Internet Computer (ICP) Breaks Below Key Support as Bears Take Control
ICP price drops to $4.15 (-0.72%) with bearish momentum building. Critical support at $4.00 now being tested as technical indicators flash warning signs.
ICP Price Drops 4.46% as Internet Computer Tests Critical Support at $4.17
Internet Computer (ICP) trades at $4.18, down 4.46% in 24h, testing its 52-week low and critical support level amid bearish technical signals across multiple timeframes.
Internet Computer (ICP) Price Tests Critical Support at $4.41 as Bears Maintain Control
ICP price trades at $4.41, up 1.64% in 24h but struggling below all major moving averages. Internet Computer's RSI at 37.33 signals potential oversold bounce.
ICP Price Struggles Near $4.35 as Technical Indicators Flash Mixed Signals
Internet Computer trades at $4.35 with bearish momentum indicators, though ICP RSI suggests potential oversold conditions may emerge soon.
Internet Computer (ICP) Price Holds Above Key Support as Technical Indicators Show Mixed Signals
ICP price trades at $4.75 with slight 0.10% gains as technical analysis reveals neutral momentum despite being below all major moving averages.
Internet Computer (ICP) Tests Key Support at $4.73 as Bearish Momentum Builds
ICP price drops 1.81% to $4.73, approaching critical support levels with technical indicators showing mixed signals for the blockchain protocol token.
ICP Price Drops to $4.81 as Institutional Selling Pressures Internet Computer
Internet Computer (ICP) trades at $4.81 after a 7% decline from institutional selling, but MACD shows early bullish momentum signs amid cross-chain developments.
Internet Computer (ICP) Battles at $4.87 as Bulls Eye $5.16 Resistance Breakout
ICP price surged 4.28% to $4.87 today, testing crucial resistance levels with mixed signals from technical indicators suggesting consolidation ahead.
ICP Price Struggles Below $5 as Internet Computer Tests Critical Support Levels
Internet Computer (ICP) trades at $4.69, down 0.38% in 24h, with technical indicators showing mixed signals as the token approaches key support zones.
Internet Computer (ICP) Price Battles $4.76 Support as DFINITY Roadmap Fails to Spark Rally
ICP trades at $4.76 (+2.32%) amid mixed signals - bullish MACD divergence conflicts with bearish moving averages as foundation's roadmap update meets lukewarm market response.
ICP Price Analysis: Internet Computer Tests Key Support at $4.59 After 4.21% Daily Drop
Internet Computer (ICP) trades at $4.69, down 4.21% as bearish momentum intensifies. Technical indicators suggest further downside risk with ICP RSI at 40.68.
Internet Computer (ICP) Price Retreats 4.5% as Bulls Lose Momentum at $4.92
ICP price drops to $4.92 amid weakening momentum signals, with key support at $4.59 becoming critical for bulls defending against further downside pressure.
Internet Computer (ICP) Surges 6% to $5.12 as Technical Indicators Flash Mixed Signals
ICP price climbs to $5.12 with 5.96% daily gains, but faces resistance near Bollinger Band upper limits while RSI remains neutral at 53.61.
Internet Computer (ICP) Faces Bearish Pressure as Support Levels Come Under Fire
ICP price trades at $4.87 with bearish momentum building. Key support at $4.59 critical for bulls as Internet Computer technical analysis reveals mixed signals.
ICP Price Hovers Near Support at $4.94 as Internet Computer Shows Mixed Technical Signals
Internet Computer (ICP) trades at $4.94 with neutral RSI at 47.85, testing critical support levels while MACD shows early bullish divergence signals.
Internet Computer (ICP) Holds Above Key Support at $4.89 Despite Market Uncertainty
ICP trades at $4.89 with neutral technical signals as the AI-focused crypto maintains institutional interest despite broader market headwinds.
Internet Computer (ICP) Consolidates Near $4.88 as Technical Indicators Signal Neutral Momentum
ICP price holds at $4.88 (+1.67%) with RSI at 46 showing neutral momentum while trading below key moving averages suggests continued consolidation phase.
Internet Computer (ICP) Struggles Below Key Moving Averages as Bears Maintain Control
ICP price trades at $4.83, up 2.39% in 24h but remains below critical resistance levels. Technical indicators suggest neutral momentum with bearish undertones.
Internet Computer (ICP) Price Slides Below Key Support as Bearish Momentum Builds
ICP price drops to $4.72 (-0.96%) as technical indicators flash warning signs. RSI at 41.56 suggests neutral territory while bears target $4.59 support.
ICP Price Holds Above $4.80 Despite Mixed Technical Signals as Institutional Interest Returns
Internet Computer (ICP) trades at $4.80 with recent 2.8% gains driven by institutional buying, though technical indicators show neutral momentum requiring careful positioning.
ICP Price Analysis: Internet Computer Holds Above $4.80 Despite Recent Decline
ICP trades at $4.81 (-0.37% daily) near critical support levels as technical indicators show mixed signals following last week's institutional buying surge.
ICP Price Rallies 2.8% to $4.85 as Institutional Buying Interest Returns
Internet Computer (ICP) surged to $4.85 amid 18% volume spike and institutional accumulation, though technical indicators suggest mixed signals ahead.
ICP Price Rallies 2.8% as Institutional Buying Drives Internet Computer Recovery
Internet Computer (ICP) trades at $4.87, up 2.70% in 24h, showing resilience with strong institutional accumulation despite bearish technical backdrop.
Internet Computer (ICP) Price Struggles at $4.89 as Bears Maintain Control
ICP price trades at $4.89 with minimal 0.31% daily gains while technical indicators signal continued bearish pressure below key moving averages.
Internet Computer (ICP) Struggles at $4.87 Despite 100x Fee Surge and Ecosystem Growth
ICP price trades at $4.87 (-0.67% daily) as protocol upgrade delays overshadow positive ecosystem metrics including 100x transaction fee surge.
Internet Computer (ICP) Tests $4.81 Support as Protocol Delays Spark Sell-Off
ICP price drops to $4.87 (-1.04%) as protocol upgrade delays weigh on sentiment, with technical indicators showing bearish momentum and critical support at risk.
Internet Computer (ICP) Falls to $4.92 as Protocol Delays Weigh on Sentiment
ICP price drops 3.83% to $4.92 amid developer concerns over protocol upgrade delays, testing critical support levels with bearish momentum indicators.
Internet Computer (ICP) Hovers Near Support at $5.04 as Bears Test Key Levels
ICP price trades at $5.04 with neutral RSI at 44.72, testing critical support near $4.84 as technical indicators suggest consolidation phase continues.
ICP Price Rebounds 2.47% After Security Breach Reversal - Technical Analysis Shows Mixed Signals
Internet Computer (ICP) trades at $5.57, up 2.47% as buyers defend key support levels following last week's security-driven volatility around Odin.fun breach.
ICP Price Plunges 8.86% to $5.52 After Security Breach Sparks Massive Selling
Internet Computer drops to $5.52 amid security concerns at Odin.fun, testing critical support levels despite recent Bullish exchange listing providing hope.
Internet Computer (ICP) Surges 6.76% as Bulls Test $6.00 Resistance Level
ICP price rallies to $5.75 (+6.76%) after bouncing from $5.29 support, with bullish momentum building as the token approaches key resistance at $6.00.
ICP Price Retreats to $5.35 After Sharp Reversal From Weekly Highs
Internet Computer (ICP) drops 5.12% to $5.35 following heavy distribution at $5.75 resistance, with RSI signaling potential oversold bounce opportunity.
ICP Price Surges to $5.59 as Internet Computer Shows Bullish Momentum Above Key Support
Internet Computer (ICP) trades at $5.59, up 1.19% in 24h, with technical indicators signaling weak bullish momentum as the token holds above critical support levels.
ICP Price Slides 2.7% Despite Bullish Exchange Listing and AI Integration News
Internet Computer trades at $5.53 after a 2.71% decline, but technical indicators suggest bullish momentum building as new exchange listing provides support.
Internet Computer (ICP) Breaks Above $5.60 as Bullish Exchange Listing Momentum Builds
ICP price surges 4.53% to $5.61 following Bullish exchange listing, with technical indicators showing growing momentum despite recent volatility around key support levels.
ICP Price Recovers to $5.11 Despite Market Volatility as Internet Computer Shows Technical Resilience
ICP trades at $5.11 with 0.73% daily gains after rebounding from $4.97 lows. Technical indicators suggest neutral momentum while AI development tools provide fundamental support.
Internet Computer (ICP) Price Falls to $5.07 as Bearish Momentum Accelerates Despite Token Burn Rally
ICP trades at $5.07 with -3.12% daily decline as regulatory concerns overshadow recent token burn and AI development tool launch by DFINITY foundation.
Internet Computer (ICP) Shows Mixed Signals as Technical Breakdown Battles AI Development Rally
ICP trades at $5.15 (+2.81%) after recent token burn sparked 5% rally, but technical indicators suggest caution as price remains below key moving averages.
Internet Computer (ICP) Price Struggles at $5.01 as Bearish Momentum Builds Despite Token Burn
ICP trades at $5.01 with bearish MACD signals overshadowing recent token burn and AI development tools launch, testing critical support levels.
Internet Computer (ICP) Tests Critical Support at $4.98 as Bears Take Control
ICP price drops 2.45% to $4.98, approaching key support at $4.90. Technical indicators flash bearish signals as Internet Computer tests lower Bollinger Band.
Internet Computer (ICP) Price Drops to $5.09 as Bearish Momentum Accelerates
ICP trading at $5.09 (-5.05% in 24h) faces mounting pressure from regulatory concerns and technical breakdown below key moving averages.
Internet Computer (ICP) Price Struggles at $5.53 Amid Regulatory Concerns and Bearish Momentum
ICP trades at $5.53 with bearish MACD signals despite 2.67% daily gains, as regulatory pressure overshadows recent AI platform developments.
Internet Computer (ICP) Drops to $5.28 as Bears Overwhelm AI Platform Gains
ICP price falls 5.72% to $5.28 amid broader altcoin selloff, testing critical support levels despite recent Caffeine AI platform launch driving earlier momentum.
ICP Price Drops 3.37% Despite Leading Blockchain Development Activity
Internet Computer trades at $5.73 after declining from recent highs, with ICP RSI at 55.22 showing neutral momentum amid broader altcoin market weakness.
Internet Computer (ICP) Slides to $5.54 as Broader Altcoin Selloff Outweighs AI Platform Gains
ICP price drops 4.63% to $5.54 amid market volatility, despite recent Caffeine AI launch and Levitron milestone completion driving earlier gains.
ICP Price Recovers to $5.71 as Internet Computer Shows Resilience After Altcoin Selloff
Internet Computer (ICP) trades at $5.71 (+1.10%) as technical indicators suggest potential bullish momentum despite recent market volatility and resistance at $6.
Internet Computer (ICP) Price Rallies 3.9% as Recovery Signs Emerge After Altcoin Selloff
ICP price trades at $5.62 with a 3.9% daily gain, showing recovery signs after recent market-wide altcoin pullback despite previous AI platform momentum.
Internet Computer (ICP) Shows Recovery Signs Despite Recent Altcoin Selloff
ICP price currently trades at $5.62 (+2.14% today) as technical indicators suggest potential bullish momentum following the broader market pullback earlier this week.
Internet Computer (ICP) Tests $6 Resistance as AI Platform Launch Sparks Rally
ICP price trades at $6.01 after Caffeine AI platform launch drove 4% surge, with technical indicators showing bullish momentum despite minor pullback.
Internet Computer (ICP) Rallies to $6.11 as AI Platform Launch Drives Bullish Momentum
ICP price surges 3.79% to $6.11 following DFINITY's Caffeine AI platform launch, with technical indicators showing overbought conditions but strong bullish momentum continues.
Crypto Price Shows Stronger Interconnectedness with Stock Market amid COVID-19: IMF
As a change of tune, the IMF alludes to the fact that crypto-assets like Bitcoin (BTC) have transformed from an obscure asset class to an integral part of the digital asset revolution.
INJ Price Prediction: Targeting $6.50-$7.00 Recovery Within 30 Days
Injective shows early bullish momentum with MACD turning positive. INJ price prediction targets $6.50-$7.00 range in coming month based on oversold conditions and technical recovery signals.
INJ Price Prediction: Targeting $6.50-$7.00 by January 2025 Amid Technical Recovery
INJ price prediction shows potential 15-24% upside to $6.50-$7.00 range within 4-6 weeks, supported by emerging bullish MACD momentum and analyst targets up to $15.33.
INJ Price Prediction: Target $6.20 by Year-End 2025 Despite Near-Term Volatility
INJ price prediction targets $6.20 resistance break within 3 weeks, with Injective forecast showing neutral momentum as MACD turns bullish despite RSI consolidation.
INJ Price Prediction: Targeting $7.00 Resistance Break for 23% Upside by Year-End
Our INJ price prediction sees potential rally to $7.00 resistance level within 2 weeks, with bullish MACD momentum supporting the forecast despite neutral RSI readings.
INJ Price Prediction: Targeting $8.00 by Year-End 2025 Despite Current Weakness
INJ price prediction shows potential recovery to $8.00 target by December 2025, with technical indicators suggesting oversold conditions present buying opportunity.
INJ Price Prediction: Targeting $7.50-$8.00 Recovery Rally Within 4-6 Weeks
INJ price prediction suggests a 23-32% upside to $7.50-$8.00 range as oversold technical indicators align with analyst consensus for medium-term recovery.
INJ Price Prediction: Targeting $7.50-$8.00 by January 2025 Despite Current Oversold Conditions
INJ price prediction shows potential 27-35% upside to $7.50-$8.00 range within 4-6 weeks as technical indicators suggest oversold bounce from current $5.90 level.
INJ Price Prediction: Target $7.75 by December 15 as Technical Oversold Conditions Signal Potential 48% Rally
INJ price prediction points to $7.75 target within two weeks as RSI at 33.31 and positive MACD histogram suggest oversold bounce from current $5.24 levels.
INJ Price Prediction: Target $7.50-$8.00 by January 2026 Despite Current Weakness
Injective faces short-term pressure at $5.27 but technical indicators suggest recovery to $7.50-$8.00 range within 4-6 weeks as MACD shows bullish divergence.
INJ Price Prediction: Recovery to $7.50-$8.00 Target by Year-End 2025
INJ shows bullish MACD divergence signaling potential 22-30% gains. Technical analysis points to $7.50-$8.00 price target within 4 weeks despite neutral RSI.
INJ Price Prediction: Target $7.50-$8.00 by December 2025 as Technical Setup Improves
INJ price prediction shows potential for 22-30% gains to $7.50-$8.00 range within 4 weeks, with bullish MACD divergence and key resistance at $8.92 in focus.
INJ Price Prediction: Technical Recovery to $6.33 Within One Week, Testing $5.17 by Year-End
INJ price prediction shows mixed signals with short-term recovery to $6.33 possible, but bearish pressure may drive Injective toward $5.17 by December 2025.
INJ Price Prediction: Technical Recovery to $6.33 Before December Correction to $5.17
INJ price prediction shows recovery to $6.33 within one week, followed by potential decline to $5.17 by December 21. Mixed analyst forecasts reflect current market uncertainty.
INJ Price Prediction: Targeting $7.50 Recovery Within 3 Weeks Despite 13% Drop
Injective (INJ) faces short-term recovery to $7.50 target despite current bearish momentum, with medium-term forecast eyeing $9.17 on Altria upgrade catalyst.
INJ Price Prediction: $7.50 Target by Early December Despite Technical Headwinds
INJ price prediction targets $7.50 recovery within 2-3 weeks, representing 21% upside from current $6.18 levels despite bearish technical signals suggesting caution.
INJ Price Prediction: $7.50 Target Within 2 Weeks as MACD Shows Early Bullish Reversal
INJ price prediction points to $7.50 recovery target within two weeks despite current bearish pressure, with technical analysis showing bullish MACD momentum emerging.
INJ Price Prediction: Targeting $7.20-$7.50 Recovery Within 2 Weeks Amid Mixed Signals
INJ price prediction suggests a potential 8-13% recovery to $7.20-$7.50 range over the next 2 weeks, despite current bearish pressure below key moving averages.
INJ Price Prediction: Targeting $8.50-$9.00 Range Within 4 Weeks Despite Current Weakness
Injective shows bullish MACD momentum despite -4.32% decline. INJ price prediction suggests recovery to $8.50+ if $6.90 pivot holds, targeting analyst consensus of $8.97.
INJ Price Prediction: Targeting $8.40-$9.11 Recovery Despite Current Weakness
INJ price prediction shows potential recovery to $8.40-$9.11 range within 4-6 weeks, though current technical weakness suggests caution with $6.02 support critical.
INJ Price Prediction: Mainnet Launch Could Push INJ to $9.11 by December 2025
INJ price prediction shows potential rally to $9.11 following November 12 mainnet launch, with technical indicators supporting bullish momentum despite being 52% below yearly highs.
INJ Price Prediction: $7.38 Target Within 1 Week as Technical Momentum Builds
Injective Protocol shows bullish momentum signals with MACD histogram turning positive. Analysts target $7.38 short-term with potential $8+ if resistance breaks.
INJ Price Prediction: Targeting $8.50-9.00 Within Two Weeks as Technical Momentum Builds
INJ price prediction points to $8.50-9.00 upside potential within 2 weeks as bullish MACD divergence and neutral RSI suggest recovery momentum from oversold conditions.
INJ Price Tests Key Support at $8.73 as Private Equity Futures Innovation Meets Bitcoin Volatility
Injective trades at $8.73 down 2.2% as revolutionary perpetual futures for private equity markets launch amid Bitcoin's retreat from $110K highs, testing critical technical levels.
INJ Price Rallies 5.7% to $8.84 as Technical Indicators Show Oversold Recovery Signal
Injective (INJ) climbs to $8.84 with 5.7% daily gains as RSI suggests potential bounce from oversold conditions, though price remains below key moving averages.
INJ Tests Lower Bollinger Band Support Near $8.38 as Crypto Markets Consolidate
Injective trades at $8.38 amid broader crypto weakness, with technical indicators pointing to oversold conditions as INJ price approaches key support zones.
INJ Tests Lower Bollinger Band Support at $8.41 as Transaction Milestone Provides Bullish Catalyst
Injective price trades at $8.41 near technical support after reaching record transaction milestone, with Bitcoin's $110K breakthrough providing market-wide momentum for recovery.
Injective Analysis: Technical Breakdown Shows Mixed Signals as INJ Tests Critical Support
INJ price trades at $12.06 (+4.24%) with technical indicators showing conflicting signals. Key support at $11.14 becomes crucial for bulls defending higher lows.
INJ Price Drops Below Key Moving Averages as Bearish Momentum Builds
Injective (INJ) trades at $11.57 after falling 0.94% in 24 hours, with technical indicators signaling potential further downside as RSI hits oversold territory.
INJ Price Drops 3.6% as Injective Tests Critical Support at $11.86
Injective (INJ) trades at $11.98 after declining 3.62% in 24 hours, approaching key support levels with bearish momentum indicators signaling potential further downside.
INJ Price Holds Above $12 Despite Mixed Signals - Technical Breakdown Reveals Critical Levels
Injective (INJ) trades at $12.47 with bearish momentum indicators conflicting with bullish long-term trend as traders eye key support at $11.88.
INJ Price Consolidates Near Support as Injective Shows Mixed Technical Signals
INJ trades at $12.51 with bearish momentum indicators, but strong support levels suggest potential reversal opportunities for patient traders.
INJ Price Plunges 10.5% as Injective Tests Critical Support at $12.06
Injective (INJ) trades at $12.38 after a sharp 10.5% decline, with technical indicators suggesting further downside risk as the token approaches key support levels.
INJ Price Consolidates at $13.92 as Technical Indicators Signal Mixed Momentum
Injective (INJ) trades at $13.92 with neutral RSI at 50.93, showing bullish MACD signals while testing key support levels around $12.37.
INJ Price Holds Above $13 as Injective Shows Mixed Technical Signals
Injective (INJ) trades at $13.89 after a 3.48% daily decline, with technical indicators suggesting consolidation before potential breakout above key resistance levels.
INJ Price Analysis: Injective Shows Bullish Signals Despite Minor Daily Decline
INJ trades at $14.38 with -0.62% daily drop, but strong technical indicators and positive ecosystem developments suggest potential upside momentum ahead.
INJ Price Surges 6% to $14.58 as Injective Shows Strong Bullish Momentum
Injective (INJ) trades at $14.58 with +5.96% daily gains, approaching upper Bollinger Band resistance while maintaining strong bullish trend signals.
Injective (INJ) Shows Bullish Momentum as Price Holds Above Key Support at $13.69
INJ price trades at $13.69 with +0.74% daily gains. Technical indicators signal potential upside as Injective holds above critical support levels.
Injective (INJ) Price Holds Above Key Support as Technical Indicators Turn Neutral
INJ trades at $13.63 with +2.48% daily gains, showing bullish momentum despite RSI remaining neutral at 49.59 as traders eye critical resistance levels.
Injective (INJ) Price Holds $13.60 Despite Technical Warning Signals and $100M Institutional Investment
INJ trades at $13.63 (-3.61% daily) as bullish institutional adoption from Pineapple Financial's $100M investment contrasts with bearish technical patterns.
Injective (INJ) Price Tests $14 Support as Technical Indicators Show Mixed Signals
INJ trades at $14.07 (-5.06% in 24h) with RSI at 53.33 showing neutral momentum while MACD histogram suggests underlying bullish pressure may emerge.
Injective (INJ) Surges 4.5% as Network Expansion and Election Futures Drive Momentum
INJ price rallies to $14.80 (+4.52%) as Injective integrates with Klaytn and Bitkub while launching innovative election futures markets on Helix.
Injective (INJ) Reclaims $14 Despite Regulatory Headwinds as Institutional Adoption Surges
INJ trades at $14.16 (+1.22%) showing resilience after Pineapple Financial's $100M investment, while technical indicators suggest bullish momentum despite recent regulatory pressures.
INJ Breaks Above Key Moving Averages as Injective Shows Strong Bullish Momentum
INJ price sits at $13.97 with bullish MACD signals emerging. Technical indicators suggest potential breakout above $15 resistance as momentum builds.
INJ Price Surges 5.66% as Injective Launches Revolutionary BUIDL Index
INJ trades at $14.20 (+5.66%) following BlackRock tokenized fund tracking launch. Strong bullish momentum with RSI at 55.32 signals continued upside potential.
Injective (INJ) Breaks Above $13 Despite Regulatory Headwinds - Technical Breakout in Play
INJ trades at $13.28 (+1.69%) as technical analysts spot potential Wave 3 breakout patterns despite recent exchange delistings weighing on sentiment.
Injective (INJ) Consolidates Near $13 as RSI Shows Neutral Territory
INJ price trades at $13.03 with modest 0.70% daily gains as technical indicators suggest consolidation phase with key support at $12.15 and resistance at $15.18.
Injective (INJ) Trades at $13.01 as Technical Indicators Show Mixed Signals
INJ price holds above key support at $13.01 with neutral RSI, while MACD signals bearish momentum despite overall bullish trend structure.
Injective (INJ) Fights for Support at $12.69 Amid Regulatory Headwinds
INJ trades at $12.69 (-1.78%) as regulatory uncertainty weighs on sentiment despite technical analysts spotting potential Wave 3 breakout patterns.
Injective (INJ) Struggles Below $13 as Regulatory Headwinds Persist
INJ price trades at $12.88 (-1.38% today) as regulatory uncertainty continues to weigh on sentiment despite analyst predictions of potential triple-digit rallies.
INJ Price Rallies 4.43% Despite Regulatory Headwinds - Can Injective Break $16 Resistance?
INJ price climbs to $13.21 amid 4.43% daily gains, but faces regulatory uncertainty and exchange delistings. Technical indicators show mixed signals.
INJ Price Struggles at $12.58 as Exchange Delistings Create Selling Pressure
Injective (INJ) trades at $12.58 after major exchange delistings triggered regulatory concerns, with technical indicators showing mixed signals near key support levels.
INJ Price Holds $12.98 Despite Exchange Delistings and Regulatory Headwinds
Injective (INJ) trades at $12.98 with neutral RSI at 45.79 as regulatory pressures trigger exchange delistings, creating mixed technical signals for traders.
INJ Price Drops to $12.97 as Regulatory Pressures Mount for Injective Protocol
Injective (INJ) trades at $12.97 after recent regulatory challenges triggered exchange delistings. Technical indicators show mixed signals as INJ RSI sits neutral at 45.41.
Injective (INJ) Price Struggles at $12.95 as Regulatory Uncertainty Weighs on Market
INJ trades at $12.95 (-2.04% today) near Bollinger Band support amid ongoing regulatory concerns despite earlier ETF proposal momentum.
Injective (INJ) Faces Sharp Decline Amid Exchange Delistings and Regulatory Pressure
INJ trades at $13.24 (-3.92% daily) following 22% crash from regulatory uncertainty and major exchange delistings affecting liquidity and investor sentiment.
Injective (INJ) Shows Recovery Signs at $13.83 After Brutal Regulatory Selloff
INJ climbs 3.52% to $13.83 as traders hunt for oversold bounce following devastating 22% regulatory crash and exchange delistings that hammered the token.
** INJ Price Analysis: Injective Faces Key Test at $14.77 Amid Mixed Technical Signals
** INJ trades at $14.77 (-1.73% daily) as technical indicators show neutral momentum despite recent 20% weekly gains driven by infrastructure adoption and ETF filing news.
Injective (INJ) Rallies 5.27% as Technical Indicators Flash Bullish Signals
INJ price surged to $15.18 today with strong momentum indicators suggesting further upside potential. Technical analysis reveals bullish MACD crossover and RSI in neutral territory.
Injective (INJ) Battles Volatility as Price Hovers Around $15.27 Amid Recovery Attempts
INJ price currently trades at $15.27 after recovering from recent 30% decline, with technical indicators showing mixed signals as traders eye key resistance at $16.55.
INJ Price Surges 9% as Injective Unveils New Financial Primitive
Injective (INJ) rallies to $16.39 with 9% daily gains following announcement of new financial primitive, breaking above key resistance levels with RSI approaching overbought territory.
Injective (INJ) Price Consolidates at $13.64 as New Financial Primitive Announcement Looms
INJ trades at $13.64 (-5.34% today) with neutral RSI at 50.93. Today's financial primitive reveal could spark breakout above $15.39 resistance toward $20 target.
INJ Price Breaks Above Key Moving Averages as Bullish Momentum Builds
INJ trades at $14.32, up 0.56% in 24h, showing strong bullish signals as price holds above all major moving averages with RSI in neutral territory.
INJ Price Analysis: Injective Holds Above Key Support Despite 3% Daily Drop
INJ price trades at $14.17 after a 3.08% decline, but technical indicators suggest bullish momentum remains intact with strong support levels holding firm.
Injective (INJ) Breaks Above $14 as EVM Upgrade and ETF Filing Drive Bullish Momentum
INJ trades at $14.47 (+2.77% in 24h) following successful Ethernia upgrade and institutional ETF interest, with technical indicators suggesting continued upside potential.
Injective (INJ) Consolidates Near $13 as EVM Upgrade Boosts Developer Interest
INJ trades at $12.96 (+3.19% in 24h) following successful Ethernia upgrade, but faces resistance at $16.35 amid mixed technical signals on daily charts.
Injective (INJ) Price Struggles Despite Ethernia Upgrade and Staked ETF Filing
INJ trades at $12.79 (-3.47% in 24h) as technical indicators signal bearish momentum despite recent EVM compatibility upgrade and Cboe's first staked INJ ETF filing.
Injective (INJ) Recovers 7.6% to $13.31 Following EVM Upgrade and ETF Filing
INJ rebounds to $13.31 after recent consolidation, as Cboe's staked ETF filing and Ethernia Upgrade provide fundamental catalysts despite short-term profit-taking pressure.
Injective (INJ) Price Struggles at $12.39 Despite ETF Filing and EVM Upgrade
INJ trades at $12.39 after a 2.29% decline, testing key support levels despite recent Cboe ETF filing and Ethernia upgrade driving initial optimism.
** Injective (INJ) Price Holds $12.68 Despite Mixed Signals as Ethernia Upgrade Boosts Developer Interest
** INJ trades at $12.68 with neutral RSI at 45.00, testing crucial support near $12.20 while recent Ethernia upgrade and Cboe ETF filing provide bullish catalysts for potential breakout.
Injective (INJ) Falls to $13.01 Despite EVM Upgrade and ETF Filing Momentum
INJ drops 8.77% to $13.01 as profit-taking overwhelms recent bullish catalysts from Cboe's staked ETF filing and Ethernia upgrade launch.
Injective (INJ) Breaks Above $14 as EVM Upgrade and ETF Filing Drive Bullish Momentum
INJ trades at $14.42 (+1.84%) following Cboe's staked ETF filing and Ethernia Upgrade launch, with technical indicators showing continued bullish strength above key support.
Injective (INJ) Pulls Back to $13.56 Despite Bullish ETF Filing and EVM Upgrade News
INJ retreats 7.75% to $13.56 after recent highs, but strong fundamentals from Cboe ETF filing and EVM mainnet launch suggest potential buying opportunity near support.
INJ Price Drops 4.68% Despite Strong Ecosystem Growth - Technical Analysis Shows Mixed Signals
Injective (INJ) trades at $15.07 after a 4.68% decline, despite positive ecosystem developments including USDM stablecoin launch and Ondo Finance integration.
Injective (INJ) Price Pulls Back to $14.68 Despite Strong Partnership Momentum
INJ trades at $14.68 after a 3.80% daily decline, but technical indicators remain bullish following recent DeFi integration announcements.
Injective (INJ) Surges 6.47% to $15.30 as Strategic Partnerships Drive Bullish Momentum
INJ trades at $15.30 with 6.47% gains as yield-bearing stablecoin integrations and technical breakouts signal continued bullish momentum toward $15.71 resistance.
Injective (INJ) Surges 6.38% as Bulls Defend Key Support Above $14
INJ trades at $14.18 (+6.38% daily) as technical breakout momentum continues following last week's 14% surge, with bulls targeting $15.71 resistance level.
Injective (INJ) Tests $13.31 Support After Breaking Multi-Week Downtrend
INJ trades at $13.31 (-1.48% in 24h) as bulls defend key support following last week's 14% surge driven by EVM testnet launch and major partnerships.
Injective (INJ) Holds Above $13 as Bulls Eye $15.71 Resistance Target
INJ trades at $13.92 (+0.58% daily) with strong bullish momentum intact following recent 14% surge and technical breakout above key resistance levels.
Injective (INJ) Maintains Bullish Momentum Near $15 After 14% Surge
INJ trades at $14.83 with strong bullish signals as technical breakout and strategic partnerships drive sustained momentum toward $15.71 resistance level.
Injective (INJ) Breaks $15 Resistance as Bulls Target $15.48 on EVM Testnet Momentum
INJ surges to $15.19 (+6.75%) breaking multi-week downtrend with RSI at 72.96 showing overbought conditions as EVM testnet launch and strategic partnerships fuel bullish momentum.
Injective (INJ) Surges 14% Above Resistance as Bulls Target $15.48 - Technical Breakout Analysis
Injective breaks multi-week downtrend with strong momentum, trading at $14.23 after key resistance breakouts. Technical indicators signal continued bullish momentum.
Injective (INJ) Surges 15% on EVM Testnet Launch and Strategic Partnerships: Technical Analysis & Price Outlook
Injective rallies 15% following EVM testnet launch and partnerships with Google Cloud and Deutsche Telekom. Technical indicators suggest continued bullish momentum.
Injective (INJ) Surges on EVM Testnet Launch Amid Bullish Momentum: Price Outlook and Key Insights
Injective (INJ) sees a 15% surge following the EVM testnet launch and bullish technical breakout. With a teased announcement on July 17, market sentiment remains high.
Injective (INJ) Gains Momentum: EVM Testnet, Partnerships, and Bullish Price Trends
Injective (INJ) surges with its EVM testnet launch, partnerships with Google Cloud and Deutsche Telekom, and a potential 3x rally. Here's what traders need to know.
Injective (INJ): EVM Testnet Launch, Strategic Partnerships, and Bullish Momentum in 2025
Injective (INJ) gains momentum with its EVM testnet launch, strategic partnerships with Google Cloud and Deutsche Telekom, and bullish price action above $13.50.
Injective (INJ) Gains Momentum with EVM Testnet, Institutional ETF Filing, and Strategic Partnerships
Injective (INJ) pushes forward with bullish developments, including an EVM testnet launch, institutional ETF filing, and regulatory collaboration, signaling long-term growth prospects.
Injective (INJ) Rallies 15%: EVM Testnet Launch and Strategic Partnerships Drive Growth
Injective (INJ) surged 15% this week, fueled by its EVM testnet launch, strategic partnerships with Google Cloud and Deutsche Telekom, and growing DeFi adoption.
Injective (INJ) Surges 15% Amid EVM Testnet Launch and Strategic Partnerships
Injective (INJ) gains momentum with a 15% price surge, driven by its EVM testnet launch, soaring on-chain activity, and strategic partnerships with Google Cloud and Deutsche Telekom.
Injective (INJ) Surges 15% Amid EVM Testnet Launch and Bullish Breakout
Injective (INJ) surged 15% this week, breaking a multi-month bearish trend. With its EVM testnet launch, rising adoption, and bullish technical momentum, INJ eyes $15+.
JASMY Consolidates at $0.01 as Crypto Markets Await Next Catalyst Amid Low Volatility
JasmyCoin holds steady at $0.01 with minimal price movement as trading volume remains subdued at $1.8M, reflecting broader crypto market consolidation phase.
JASMY Gains 5% Following Major Exchange Listing Despite Fed Rate Hike Headwinds
JasmyCoin trades at $0.01 after securing major exchange listing on October 17, offsetting Fed rate hike pressure that initially weighed on crypto markets this week.
JASMY Technical Breakdown: Oversold Bounce Potential at Critical Support
JASMY price holds $0.01 support with RSI at 35.04 oversold territory. JasmyCoin technical analysis reveals potential reversal setup as momentum indicators stabilize.
JASMY Price Analysis: JasmyCoin Tests Lower Bollinger Band Support at $0.01
JASMY price drops 1.23% to $0.01 as technical indicators signal oversold conditions with RSI at 32.89 and price near lower Bollinger Band support.
JasmyCoin (JASMY) Price Struggles at $0.01 as RSI Shows Oversold Conditions
JASMY trades at $0.01 down 4.74% with RSI at 31.61 signaling potential oversold bounce while testing critical support levels on heavy volume.
JasmyCoin (JASMY) Holds Support at $0.01 as Technical Indicators Signal Mixed Outlook
JASMY price maintains $0.01 support level with modest 0.46% daily gain. Technical analysis reveals bearish MACD but RSI showing potential for reversal from oversold conditions.
** JasmyCoin (JASMY) Hovers at Critical Support as Technical Indicators Signal Mixed Outlook
** JASMY price trades at $0.01 with bearish momentum indicators conflicting with oversold RSI conditions, creating uncertainty for traders in the near term.
JasmyCoin (JASMY) Struggles at $0.01 Despite Bullish Analyst Predictions
JASMY price remains at $0.01 after a 5.27% weekly decline, with technical indicators showing mixed signals as traders await the predicted breakout.
JasmyCoin JASMY Shows Consolidation Near $0.01 Support as Technical Indicators Signal Mixed Outlook
JASMY price holds steady at $0.01 despite slight 24h decline of 0.28%. Technical analysis reveals neutral RSI and potential bullish MACD momentum building.
JASMY Price Analysis: JasmyCoin Shows Mixed Signals After 4% Daily Decline
JASMY trades at $0.01 following a 4.08% daily drop, but technical indicators suggest potential bullish momentum may be building beneath the surface.
JasmyCoin (JASMY) Shows Bullish Momentum with 6% Surge - Key Resistance at $0.02
JASMY price rallies 6.04% to $0.01 as JasmyCoin technical analysis reveals bullish MACD signals and RSI positioned neutrally in consolidation phase.
JasmyCoin (JASMY) Price Analysis: Neutral RSI Signals Mixed Trading Opportunities
JASMY trades at $0.01 with -0.49% daily decline. Technical indicators show neutral RSI at 44.59 while MACD suggests emerging bullish momentum for JasmyCoin traders.
JasmyCoin (JASMY) Shows Weak Bullish Momentum Despite Neutral RSI at $0.01
JASMY price holds steady at $0.01 with 2.93% daily gains. Technical indicators suggest mixed signals as JasmyCoin faces key resistance at $0.02 level.
JasmyCoin (JASMY) Shows Mixed Signals as RSI Hovers Near Neutral Territory
JASMY price trades at $0.01 with -4.22% decline, while technical indicators suggest potential bullish momentum despite current weakness in the cryptocurrency market.
JasmyCoin (JASMY) Price Drops 5.27% Despite Analyst Predictions of Major Breakout
JASMY price trades at $0.01 after a 5.27% decline, while technical indicators show mixed signals amid analyst forecasts of potential 14-day surge.
JasmyCoin (JASMY) Surges 7.68% as Technical Indicators Flash Bullish Signals
JASMY price jumps to $0.02 with strong momentum indicators suggesting continued upside potential for JasmyCoin traders.
JasmyCoin (JASMY) Shows Bullish Momentum Despite Weak Trend - Key Resistance at $0.02
JASMY price trades at $0.01 with +2.32% gains in 24h. Technical indicators show mixed signals as JasmyCoin tests critical resistance levels.
JasmyCoin (JASMY) Consolidates at $0.01 After Healthcare Blockchain Surge
JASMY trades at $0.01 (+1.84% in 24h) following a major 25% surge on cancer treatment blockchain news. Technical indicators show mixed signals as traders watch key levels.
JasmyCoin (JASMY) Trades at Critical Support as Technical Indicators Signal Mixed Momentum
JASMY price holds steady at $0.01 despite 1.11% daily decline, with RSI at 44.98 suggesting potential reversal from oversold conditions approaching key support levels.
** JasmyCoin (JASMY) Shows Weak Bullish Signs Despite Privacy Focus and Rate Cut Optimism
** JASMY price holds at $0.01 with 2.93% daily gains. Technical indicators suggest neutral momentum while analyst predictions target significant upside potential.
JasmyCoin (JASMY) Hovers at $0.01 as Analyst Predicts Major Breakout Within 14 Days
JASMY price holds steady at $0.01 with modest 0.72% gains as technical indicators show mixed signals while analyst forecasts significant surge ahead.
JasmyCoin (JASMY) Struggles at $0.01 Support as RSI Shows Neutral Territory
JASMY price holds $0.01 support level with 24h decline of 0.79%. Technical indicators suggest consolidation phase as privacy developments fail to spark rally.
JasmyCoin (JASMY) Shows Weak Bullish Signals Despite Trading Near Support at $0.01
JASMY price holds steady at $0.01 with 0.86% daily gains, but technical indicators suggest limited upside potential as the token trades below all major moving averages.
JasmyCoin (JASMY) Price Analysis: Can Bulls Break $0.02 Resistance Despite Bearish Momentum?
JASMY trades at $0.01 with bearish MACD signals, while analysts predict a 14-day surge based on Fed rate cut expectations and IoT market positioning.
JasmyCoin (JASMY) Price Analysis: Testing Critical Support at $0.01
JASMY price trades at $0.01 amid neutral momentum signals. Technical indicators suggest consolidation phase with key resistance at $0.02 for JasmyCoin traders.
JasmyCoin (JASMY) Shows Modest Recovery at $0.01 as Technical Indicators Turn Mixed
JASMY price climbs 3.05% to $0.01 with neutral RSI at 44.34, but trading below all major moving averages suggests caution for traders.
JasmyCoin (JASMY) Struggles Below Key Resistance as RSI Shows Neutral Signals
JASMY price trades at $0.01 with bearish momentum indicators despite neutral RSI readings. Technical analysis reveals critical support and resistance levels.
JasmyCoin (JASMY) Consolidates Near Support as RSI Shows Neutral Territory
JASMY price holds steady at $0.01 with modest 0.75% daily gains. Technical indicators suggest consolidation phase with key resistance at $0.02 ahead.
JasmyCoin (JASMY) Shows Neutral Momentum Despite 1.46% Daily Gain - Technical Analysis
JASMY price holds at $0.01 with modest 1.46% gain, but technical indicators signal mixed momentum as JasmyCoin tests critical support levels.
JasmyCoin (JASMY) Tests Critical Support at $0.01 as Bearish Momentum Intensifies
JASMY price drops 6% to $0.01, approaching crucial support levels with RSI at 42.43 signaling potential oversold conditions for short-term traders.
JASMY Price Holds $0.02 Support as Technical Indicators Flash Mixed Signals
JasmyCoin trades at $0.02 with neutral RSI at 45.57, while MACD shows bearish momentum despite weak bullish overall trend signal.
JasmyCoin (JASMY) Consolidates at $0.02 Following Rally as Technical Signals Turn Mixed
JASMY price trades at $0.02 after recent 12.7% surge on Panasonic partnership news, but daily momentum shows bearish divergence with RSI at neutral 47.63 levels.
JasmyCoin (JASMY) Breaks $0.02 Resistance as Panasonic Partnership Fuels 12.7% Rally
JASMY price surges to $0.02 with bullish momentum following strategic Panasonic and Chainlink partnerships, signaling potential continuation above key resistance levels.
JasmyCoin (JASMY) Shows Mixed Signals Despite 11% Daily Decline - Technical Analysis
JASMY price drops 11.30% to $0.02 amid $10M trading volume, but technical indicators suggest potential bullish momentum building beneath current weakness.
JasmyCoin (JASMY) Surges 12% as Technical Indicators Signal Bullish Momentum
JASMY price jumps to $0.02 with strong bullish signals emerging from technical analysis as the token approaches key resistance levels on elevated volume.
JasmyCoin (JASMY) Consolidates at $0.02 Amid Weak Bullish Signals
JASMY price holds steady at $0.02 despite 3.77% daily decline. Technical indicators show mixed signals with RSI in neutral territory and MACD suggesting potential upside momentum.
JasmyCoin (JASMY) Shows Bullish Momentum With 6.39% Daily Gain
JASMY trades at $0.02 with strong bullish signals as technical indicators point toward continued upward momentum despite lack of recent catalysts.
JasmyCoin (JASMY) Consolidates at $0.02 as Technical Indicators Signal Mixed Momentum
JASMY price holds steady at $0.02 despite 3% daily decline, with neutral RSI at 52 suggesting potential for directional breakout from current consolidation pattern.
JasmyCoin (JASMY) Battles to Hold $0.01 Support as Healthcare Rally Fades
JASMY trades at $0.01 (+2.29% in 24h) as technical indicators show neutral momentum following the retreat from recent healthcare partnership gains.
JasmyCoin (JASMY) Hovers Near Critical Support as Technical Indicators Signal Neutral Territory
JASMY price trades at $0.01 with bearish momentum indicators, testing crucial support levels after July's 60% surge and subsequent 28% decline.
JasmyCoin (JASMY) Consolidates at $0.02 as Partnership Benefits Fade
JASMY trades at $0.02 (+2.56% daily) with RSI at 46.58 showing neutral momentum after recent cancer treatment partnership announcement failed to sustain bullish momentum.
JASMY Price Tests Critical Support at $0.01 After July's Volatile 60% Surge
JasmyCoin trades at $0.01 (+2.06% today) near key support levels following July's dramatic 60% rally to $0.03 and subsequent 28% correction. Technical indicators show mixed signals.
JasmyCoin (JASMY) Tests Lower Support at $0.01 as Bears Maintain Control
JASMY price drops 1.82% to $0.01, approaching critical support levels with RSI at 41.51 signaling potential oversold conditions ahead.
JasmyCoin (JASMY) Faces Mixed Signals as Price Retreats from Recent Highs
JASMY trades at $0.02 after a 3.4% daily decline, with technical indicators showing neutral momentum despite recent breakthrough in cancer treatment blockchain integration.
JasmyCoin (JASMY) Fights to Hold $0.02 as Healthcare Rally Fades
JASMY price trades at $0.02 (+2.81% today) but struggles after 9.7% decline wiped out gains from blockchain cancer treatment partnership announcement.
JasmyCoin (JASMY) Faces 9.7% Decline Despite Recent Bullish Momentum
JASMY price drops to $0.02 (-9.72% in 24h) as bears take control following last week's 25% surge driven by blockchain healthcare partnerships.
JASMY Price Analysis: Neutral RSI Signals Potential Breakout as JasmyCoin Tests $0.02 Resistance
JasmyCoin trades at $0.02 with RSI at 54.61 in neutral territory. Technical indicators suggest consolidation phase may precede significant price movement.
JasmyCoin (JASMY) Struggles at $0.02 as Bears Override Healthcare Partnership Boost
JASMY price holds $0.02 support despite 6.78% daily decline, with technical indicators showing mixed signals following recent healthcare partnership announcement.
JasmyCoin (JASMY) Rebounds 25% After Blockchain Healthcare Partnership Despite Recent Support Break
JASMY price currently trades at $0.02 following a dramatic week that saw the token surge 25% on healthcare news before declining below key support levels.
JasmyCoin (JASMY) Holds $0.02 as Healthcare Partnerships Drive Bullish Momentum
JASMY price maintains $0.02 support with 4.89% daily gains as blockchain healthcare partnerships fuel investor optimism despite late-session volatility concerns.
JasmyCoin (JASMY) Holds $0.02 Despite Market Correction - Cancer Treatment Initiative Boosts Sentiment
JASMY price maintains $0.02 support level with neutral RSI at 57.12, despite recent pullback from blockchain healthcare partnership highs.
JasmyCoin (JASMY) Holds $0.02 Despite Overbought RSI Conditions
JASMY price trades at $0.02 with RSI at 73, suggesting potential pullback despite recent 25% surge from blockchain cancer treatment initiative announcement.
JPMorgan Backs Bitcoin to Rise 28%, Saying Cryptos are Preferred Alternative Asset
In its latest report, JPMorgan gives Bitcoin a higher valuation. The bank is also more bullish on cryptocurrencies than other traditional financial assets.
LDO Price Prediction: $0.75-$1.27 Target as Technical Recovery Signals Emerge by January 2026
LDO price prediction shows potential 27-115% upside to $0.75-$1.27 range as oversold conditions and bullish MACD divergence signal recovery from current $0.59 levels.
LDO Price Prediction: Targeting $0.75-$1.27 Recovery Within 4-6 Weeks
LDO price prediction points to $0.75-$1.27 upside potential as technical indicators show bullish momentum building despite recent weakness below key moving averages.
LDO Price Prediction: Target $0.75-$0.78 Within 30 Days as Technical Recovery Emerges
LDO price prediction points to $0.75-$0.78 recovery target within 30 days, supported by bullish MACD momentum and oversold RSI conditions at current $0.63 levels.
LDO Price Prediction: Targeting $0.75 Recovery Within 2 Weeks Despite Mixed Signals
LDO price prediction suggests potential rally to $0.75 short-term target as MACD shows bullish momentum, though traders should watch critical $0.60 support level closely.
LDO Price Prediction: $0.75 Target by Year-End as Technical Recovery Signals Emerge
LDO shows bullish momentum with MACD histogram positive and RSI oversold recovery potential. Short-term target $0.75, medium-term range $0.62-$0.78 supported by technical analysis.
LDO Price Prediction: Targeting $0.75-$0.78 Recovery Within 4 Weeks Despite Current Weakness
LDO price prediction points to $0.75-$0.78 recovery target within 4 weeks as technical indicators show early bullish divergence despite 63% decline from highs.
LDO Price Prediction: Targeting $0.95 by Year-End with Potential Rally to $2.30 in 2025
LDO price prediction shows bullish momentum building with technical indicators suggesting a move toward $0.95 short-term and $2.30 long-term targets based on analyst forecasts.
LDO Price Prediction: Targeting $0.85 by January 2025 as Technical Indicators Signal Bullish Reversal
LDO price prediction shows potential 35% upside to $0.85 within 4-6 weeks as MACD turns bullish and oversold conditions create buying opportunity near critical support.
LDO Price Prediction: Recovery to $0.85-$1.20 Range Expected Within 4-6 Weeks
LDO technical analysis suggests oversold conditions near $0.56 support could drive recovery to $0.85-$1.20 range, representing 50-115% upside potential from current levels.
LDO Price Prediction: Targeting $0.76-$0.85 Recovery as Technical Indicators Signal Bullish Reversal
LDO price prediction shows potential 29-44% upside to $0.76-$0.85 range within 4-6 weeks as MACD histogram turns positive and oversold conditions persist near $0.59 support.
LDO Price Prediction: $0.76-$0.85 Target as MACD Turns Bullish Despite Market Fear
Lido DAO shows bullish divergence with MACD histogram turning positive at $0.0057, targeting $0.76-$0.85 recovery over the next month despite extreme fear sentiment.
LDO Price Prediction: Recovery to $0.85-$1.20 Target by December 2025
Lido DAO shows bullish momentum with MACD turning positive. Technical analysis suggests LDO price target of $0.85-$1.20 within 30 days as oversold conditions reverse.
LDO Price Prediction: Targeting $0.76-$0.85 Recovery Within 4 Weeks as Oversold Conditions Signal Reversal
LDO price prediction indicates potential 15-29% upside to $0.76-$0.85 range over next month as technical indicators show bullish divergence and oversold bounce setup.
LDO Price Prediction: Technical Setup Points to $0.76 Target Within 2 Weeks
LDO price prediction shows potential recovery to $0.76 resistance level as oversold conditions and analyst consensus support near-term bullish reversal from current $0.62 levels.
LDO Price Prediction: Recovery to $0.85-$1.20 Target as Oversold Conditions Present Opportunity
LDO trades near 52-week lows at $0.63, but technical indicators suggest recovery potential to $0.85-$1.20 range within 4-6 weeks as oversold conditions mature.
LDO Price Prediction: Recovery to $0.85-$1.20 Expected by December 2025
LDO price prediction shows potential 23-74% upside to $0.85-$1.20 range within 4-6 weeks as oversold conditions and analyst forecasts signal recovery from current $0.69 levels.
LDO Price Prediction: Target $0.82-$1.03 by December 2025 as Technical Recovery Signals Emerge
LDO price prediction targets $0.82-$1.03 range over next 4 weeks as oversold conditions and bullish divergence patterns suggest potential recovery from current $0.71 levels.
LDO Price Prediction: Targeting $0.82-$0.96 Recovery by December 2025
LDO price prediction points to modest recovery toward $0.82-$0.96 range as technical indicators show early bullish divergence despite current market fear.
LDO Price Prediction: Targeting $1.03 by December 2025 Amid Mixed Technical Signals
LDO price prediction shows potential recovery to $1.03+ within 4-6 weeks, despite current bearish pressure. Technical analysis reveals key $0.82 resistance level critical for bullish continuation.
LDO Price Prediction: Targeting $0.83-$0.88 Recovery Within 2-4 Weeks
LDO price prediction indicates potential recovery to $0.83-$0.88 range over the next 2-4 weeks as technical indicators show emerging bullish momentum despite recent 9.10% decline.
LDO Price Prediction: Targeting $1.20 by December 2025 After Technical Breakout
Lido DAO shows bullish momentum signals with MACD histogram positive at 0.0113. Our LDO price prediction targets $1.20 within 30 days if resistance at $0.98 breaks.
LDO Price Prediction: Targeting $1.20-$1.58 Recovery by Q1 2025 Despite Near-Term Headwinds
LDO price prediction points to $0.85 resistance test within 2 weeks, with medium-term targets of $1.20-$1.58 as Lido DAO shows early bullish momentum signals.
LDO Price Prediction: Targeting $1.30 Short-Term with Potential Rally to $2.10 by December 2025
LDO shows bullish momentum signals with MACD histogram turning positive. Technical analysis suggests $1.30 short-term target, with medium-term forecast pointing to $1.75-$2.10 range.
LDO Consolidates Below Key Moving Averages as Liquid Staking Token Tests $0.95 Support
Lido DAO (LDO) trades at $0.95 with modest 0.8% gains as the liquid staking governance token navigates technical consolidation below critical resistance levels amid sideways crypto market action.
LDO Price Climbs 6.8% Despite Trading Below Key Moving Averages as Lido DAO Tests Technical Recovery
Lido DAO trades at $0.92 with solid 6.8% daily gains, though LDO price remains below critical 20-day MA at $1.04 as technical indicators show mixed signals for the liquid staking protocol.
LDO Consolidates Near $0.87 as Bridge Partnership Vote Gains Community Support
Lido DAO trades at $0.87 with minimal volatility as governance vote on bridge partnerships progresses, while technical indicators suggest consolidation phase continues.
Lido DAO Price Action: Technical Breakout Signal Emerges as LDO Tests Critical Support
LDO price climbs 4.55% to $1.12 amid oversold conditions. Key technical indicators suggest potential reversal as Lido DAO approaches crucial support levels.
** Lido DAO (LDO) Tests Key Support as RSI Signals Oversold Conditions
** LDO price drops to $1.07 (-1.16% in 24h) as technical indicators show mixed signals with RSI at 38.92 suggesting potential buying opportunity near Bollinger Band support.
LDO Price Struggles Near $1.08 Support as Technical Indicators Flash Warning Signs
Lido DAO trades at $1.09 (-2.84%) with LDO RSI at 39.13 signaling potential oversold conditions while key support levels come into focus for traders.
LDO Price Drops Below Key Support as Lido DAO Tests $1.09 Level
LDO trades at $1.12 after a 0.94% decline, approaching critical support at $1.09 with bearish momentum signals pointing to potential further downside.
LDO Price Drops 1.29% as Lido DAO Tests Critical Support at $1.09
LDO price sits at $1.12 after a 1.29% decline, with technical indicators showing bearish momentum as the token approaches key support levels near $1.09.
LDO Price Crashes 11.3% as Lido DAO Tests Critical Support Levels
LDO trades at $1.11 after sharp decline, with technical indicators showing bearish momentum as token approaches lower Bollinger Band support zone.
LDO Price Surges Above Key Moving Averages as Lido DAO Shows Strong Bullish Momentum
LDO price trades at $1.26, up 0.17% in 24h. Technical indicators signal bullish momentum with MACD crossover and RSI in neutral territory offering upside potential.
Lido DAO (LDO) Consolidates at $1.25 as Technical Indicators Signal Mixed Outlook
LDO price holds steady at $1.25 despite 4.24% daily decline, with technical analysis revealing neutral RSI and bullish MACD divergence signaling potential reversal.
LDO Price Rallies Above $1.30 as Lido DAO Shows Strong Bullish Momentum
LDO price trades at $1.30 despite 1.5% daily decline, with technical indicators signaling potential upside as Lido DAO maintains position above key moving averages.
LDO Price Surges 11% as Lido DAO Tests Upper Bollinger Band Resistance
LDO trades at $1.32 with strong 10.99% daily gains, approaching critical resistance at $1.35 as technical indicators signal continued bullish momentum for Lido DAO.
LDO Price Holds Above $1.18 as Lido DAO Technical Indicators Signal Mixed Momentum
Lido DAO trades at $1.18 with modest 0.60% daily gains, while technical analysis reveals neutral RSI and bearish MACD signaling potential consolidation ahead.
Lido DAO (LDO) Shows Mixed Signals as Price Consolidates Above $1.20
LDO price holds at $1.20 with 2.48% daily gains, but technical indicators reveal conflicting signals as the token trades within a tight range.
Lido DAO (LDO) Price Drops 5.26% to $1.18 Amid Mixed Technical Signals
LDO price falls to $1.18 with bearish momentum despite overall bullish trend classification and key support holding at $1.13 level.
Lido DAO (LDO) Tests Key Support at $1.25 Amid 5% Daily Decline
LDO price drops 5.22% to $1.25 as technical indicators show mixed signals with RSI neutral at 50.96 and MACD turning bullish despite short-term weakness.
LDO Price Surges 3.5% as Lido DAO Shows Strong Bullish Technical Signals
LDO trades at $1.32, up 3.52% in 24h with bullish MACD momentum and RSI at 57.16. Technical indicators suggest continued upward movement toward $1.45 resistance.
** Lido DAO (LDO) Breaks Above Key Resistance as Dual Governance Vote Drives Bullish Momentum
** LDO price surges 2.15% to $1.28 as governance upgrade vote and technical developments fuel strong bullish sentiment with RSI entering neutral territory.
Lido DAO (LDO) Price Surges 5.2% Following Dual Governance Vote Completion
LDO price jumps to $1.23 with 5.2% gains as Lido DAO completes crucial governance upgrades, while technical indicators show bullish momentum building.
Lido DAO (LDO) Tests Key Support as Bears Maintain Control
LDO price drops 1.75% to $1.19 as technical indicators signal neutral momentum, with critical support levels at $1.13 coming into focus for traders.
Lido DAO (LDO) Holds $1.20 Amid Governance Vote Conclusion
LDO price trades at $1.20 (+2.36%) as Dual Governance vote nears conclusion on September 8, with mixed technical signals showing neutral RSI but bearish MACD momentum.
Lido DAO (LDO) Tests Key Support at $1.19 as Governance Upgrade Vote Begins
LDO price trades at $1.19 (+2.43% in 24h) as dual governance voting commences, while technical indicators show mixed signals with RSI in neutral territory.
Lido DAO (LDO) Price Analysis: Dual Governance Vote Drives Technical Consolidation
LDO trades at $1.17 (+0.42%) as Dual Governance vote continues through September 8. Technical indicators show mixed signals with key support at $1.13.
Lido DAO (LDO) Consolidates at $1.21 as Dual Governance Vote Shapes Market Sentiment
LDO trades at $1.21 (-0.21% daily) while governance upgrade vote creates mixed signals amid bearish technical indicators and neutral RSI positioning.
LDO Price Rallies 0.76% as Lido DAO SRv3 Validator Upgrade Announcement Boosts Sentiment
LDO price climbs to $1.21 after Lido DAO's SRv3 validator upgrade announcement, with technical indicators showing mixed signals as bulls defend key support levels.
LDO Price Surges 5.48% as Lido DAO Confirms Major SRv3 Upgrade for 2026
LDO price jumps to $1.21 (+5.48%) following Lido DAO's announcement of the SRv3 validator upgrade, though technical indicators show mixed signals for traders.
LDO Price Hovers Near Support as Bearish Momentum Builds for Lido DAO
LDO trades at $1.18 (+0.51% today) but technical indicators suggest potential downside as momentum turns bearish despite overall bullish trend.
Lido DAO (LDO) Faces Bearish Pressure Despite Strong Long-Term Bullish Trend
LDO price drops 2.67% to $1.21 as momentum indicators turn bearish, though the token maintains its position above key support levels with strong underlying fundamentals.
Lido DAO (LDO) Price Holds Above $1.20 Support Despite Weekly Decline
LDO trades at $1.24 with +1.06% daily gains but faces bearish pressure after 9.9% weekly decline from recent whale-driven surge to $1.57 highs.
LDO Price Analysis: Lido DAO Tests Key Support at $1.21 Despite Neutral RSI
LDO trades at $1.21 with neutral RSI signals, testing critical support levels while Bollinger Bands suggest potential reversal opportunity for traders.
LDO Price Drops 6% as Lido DAO Tests Critical Support Levels
LDO trades at $1.20 after a 5.97% decline, with technical indicators showing bearish momentum as the token approaches key support at $1.19.
LDO Price Struggles at $1.24 Despite Strong Bullish Trend - Technical Analysis Shows Mixed Signals
Lido DAO trades at $1.24 with -2.84% daily decline. LDO RSI neutral at 48.19 while price approaches Bollinger Band support despite overall very strong bullish trend.
LDO Price Drops 5.74% Despite Record TVL as Lido DAO Tests Critical Support
LDO trades at $1.30 after a sharp decline from recent highs, testing key support levels despite Lido DAO's record $38.17 billion Total Value Locked signaling strong fundamentals.
LDO Price Soars to $1.42 as Lido DAO Posts $1M Profit and Record TVL
LDO trades at $1.42 (+3.57%) following Lido DAO's $1M August profit and record $38.17B TVL. Technical indicators show bullish momentum with RSI at 65.78.
LDO Price Hits $1.38 as Lido DAO TVL Reaches Record $38B Despite Market Correction
LDO trades at $1.38 after a 7.64% pullback from recent highs, while Lido DAO's record $38.17 billion TVL and $1M profit signal strong fundamentals.
Lido DAO (LDO) Tests $1.63 Resistance After 40% August Rally
LDO price currently trades at $1.52 despite a -1.11% daily decline, with technical indicators showing overbought conditions following a spectacular 40% surge earlier this month.
LDO Price Surges 1.92% as Lido DAO Signals Bullish Momentum Despite Overbought RSI
LDO price hits $1.49 with strong bullish momentum, though RSI at 75.76 suggests caution ahead of key $1.62 resistance level for Lido DAO traders.
LDO Surges 14% as Lido DAO Bulls Target $1.56 Resistance
LDO price jumps to $1.47 with 14% daily gains, but RSI signals overbought conditions near key resistance at $1.56.
Lido DAO (LDO) Surges 34.6% Weekly as Whale Accumulation Drives Bullish Momentum
LDO trades at $1.29 with 9.51% daily gains as whale purchases $4.9M in tokens, pushing RSI to 67.82 and signaling continued bullish momentum for Lido DAO.
Lido DAO (LDO) Surges 8% as Bulls Eye $1.29 Resistance Level
LDO price jumps to $1.19 with strong momentum indicators flashing bullish signals. Key resistance at $1.29 could determine next move for Lido DAO.
Lido DAO (LDO) Shows Weak Bullish Momentum at $0.93 Despite Technical Headwinds
LDO price trades at $0.93 with 2.76% daily gains, but technical indicators suggest caution as momentum remains bearish despite recent recovery attempts.
Lido DAO (LDO) Tests Support at $0.91 as Technical Indicators Flash Mixed Signals
LDO price drops 3.19% to $0.91, approaching critical support near Bollinger Band lower level while RSI shows neutral momentum at 44.89.
LDO Price Recovers 4.26% After Lido DAO Market Share Concerns Trigger Recent Selloff
LDO price climbs to $0.93 with 4.26% daily gains as traders assess whether Lido DAO's declining market share presents a buying opportunity or signals deeper concerns.
LDO Price Struggles Near $0.90 as Lido DAO Market Share Hits 2-Year Low
LDO trades at $0.90 (+0.56% daily) but faces bearish pressure from declining Ethereum staking dominance to 25%, the lowest since March 2022.
LDO Price Drops to $0.89 as Lido DAO Market Share Concerns Intensify
LDO trades at $0.89 (-3.89% daily) as Lido DAO's Ethereum staking market share decline to 25% triggers bearish technical signals despite recent whale accumulation.
LDO Price Drops 6.59% as Lido DAO Market Share Concerns Override Whale Accumulation
LDO trades at $0.94 (-6.59%) as Ethereum staking market share decline to 25% creates bearish pressure despite recent institutional interest and technical support levels.
LDO Price Struggles at $1.04 Despite Whale Activity as Lido DAO Market Share Concerns Mount
LDO trades at $1.04 (+0.68%) with mixed technical signals as Lido DAO's Ethereum staking market share drops to 25%, the lowest since March 2022.
LDO Drops 7.9% as Lido DAO Faces Market Share Concerns Despite Whale Accumulation
LDO trades at $1.00 (-7.9% daily) as Ethereum staking market share decline overshadows recent whale accumulation of 7.28M tokens
LDO Price Faces Market Share Headwinds Despite Strong Technical Support at $1.10
Lido DAO (LDO) trades at $1.10 amid mixed signals as market share decline creates bearish pressure while technical indicators show underlying strength.
LDO Price Drops 3.8% as Lido DAO Faces Market Share Decline Despite Recent Bullish Rally
LDO trades at $1.08 after a 3.8% decline, testing support levels as Ethereum staking market share concerns weigh on recent institutional investment gains.
Lido DAO (LDO) Breaks Above Key Moving Averages - Bulls Target $1.29 Resistance
LDO price climbs 1.66% to $1.10, breaking above critical 200-day SMA while technical indicators flash bullish signals for continued upside momentum.
LDO Price Hits $1.10 as Whale Accumulation Drives 5.65% Daily Surge
Lido DAO trades at $1.10 with 5.65% daily gains as whale activity and Arthur Hayes' $1M investment fuel bullish momentum despite overbought technical signals.
LDO Price Analysis: Lido DAO Tests $1.04 Support as Bulls Target $1.29 Breakout
LDO price drops 2.15% to $1.04 as Lido DAO shows mixed signals with bullish MACD momentum but key resistance at $1.29 remains intact.
LDO Price Surges to $1.10 as Major Whale Activity Drives Bullish Momentum
LDO trades at $1.10 with 1.66% daily gains as whale accumulation and Arthur Hayes' $1M investment fuel strong bullish momentum despite recent profit-taking.
LDO Price Hits $1.20 as Lido DAO Shows Strong Bullish Momentum Despite Recent Volatility
LDO trades at $1.20 with 0.84% daily gains, showing overbought RSI at 80.97 while testing upper Bollinger Band resistance after volatile week of whale accumulation.
Lido DAO Price Surges 8% as $4.9M Whale Purchase Signals Strong Accumulation
LDO trading at $1.22 (+8.18% in 24h) following massive whale accumulation of 2.7M tokens. Technical indicators show overbought conditions but bullish momentum continues.
Accelerating Diligence Review with Harvey's Innovative Platform
Discover how Harvey.ai's platform revolutionizes diligence reviews by enabling rapid data extraction and analysis, significantly reducing review time and enhancing accuracy.
LINK Price Prediction: Targeting $15.50 in Short-Term with $25 Upside Potential
LINK price prediction shows bullish momentum building with $15.50 short-term target and potential rally to $25.40 if key resistance at $14.50 breaks decisively.
LINK Price Prediction: Chainlink Eyes $15.50-$20.50 Rally as Technical Momentum Builds Through December 2025
LINK price prediction shows bullish potential with analysts targeting $15.50-$20.50 by month-end as MACD momentum strengthens and key resistance at $14.50 comes into focus.
LINK Price Prediction: Chainlink Eyes $15.50 Target as Technical Momentum Builds for December 2025
LINK price prediction shows potential upside to $15.50 in the coming weeks, with Chainlink forecast supported by improving MACD histogram and key resistance test at $14.93.
LINK Price Prediction: Targeting $20.50 by Year-End with Critical $14.50 Breakout
Chainlink eyes $20.50 target as LINK trades at $14.04 with bullish MACD momentum. Key resistance at $14.50 could unlock 46% upside potential before December 2025 closes.
LINK Price Prediction: Targeting $20.50 by December 2025 Despite Short-Term Headwinds
LINK price prediction indicates potential 50% upside to $20.50 by December 2025, though immediate resistance at $14.50 poses near-term challenges for Chainlink bulls.
LINK Price Prediction: Chainlink Eyes $18-20 Recovery Despite Mixed Signals Through December 2025
LINK price prediction suggests potential recovery to $18.26 target despite current bearish moving averages, with critical $14.93 resistance breakout needed for bullish continuation.
LINK Price Prediction: Chainlink Eyes $18.26 Target as Technical Momentum Builds for December Rally
LINK price prediction shows bullish momentum with $18.26 short-term target. Technical analysis reveals key breakout setup after 19.43% daily surge.
LINK Price Prediction: Targeting $14.98 Recovery Within 30 Days Despite Current Bearish Pressure
LINK price prediction suggests a potential 23% upside to $14.98 over the next month, though immediate weakness toward $12.09 support remains likely in the near term.
LINK Price Prediction: Chainlink Eyes $16.25 Recovery as Technical Momentum Shifts Bullish
LINK price prediction targets $16.25 in the next 2-3 weeks as MACD histogram turns positive despite recent 6.84% decline. Chainlink forecast shows mixed signals with support at $11.61.
Chainlink Tests Lower Bollinger Band at $13.12 as MACD Shows Early Bullish Divergence
LINK price retreats 1.2% to $13.12 amid broader crypto weakness, testing technical support while momentum indicators hint at potential reversal formation.
LINK Price Prediction: Chainlink Eyes $14.98 Target as Technical Momentum Builds Through December 2025
LINK price prediction points to $14.98 medium-term target as MACD shows bullish divergence, though short-term consolidation near $13.36 expected before breakout.
LINK Price Prediction: Chainlink Targets $14.98 by December Despite Mixed Analyst Views
LINK price prediction shows potential 11.5% upside to $14.98 within 30 days, though short-term consolidation near $13.19 expected as technical indicators flash mixed signals.
LINK Price Tests Key Support at $13.34 as Chainlink Technical Analysis Points to Consolidation Phase
Chainlink price holds $13.34 amid neutral momentum signals, with LINK testing critical support levels as broader crypto market awaits direction following recent volatility.
LINK Price Tests Key Support at $12.90 Pivot as Oracle Token Shows Early Bullish Signals
Chainlink trades at $12.88 with modest 1.7% daily gains as technical indicators suggest potential momentum shift despite continued pressure from major moving averages.
LINK Price Prediction: Chainlink Eyes $27.79 Recovery Target Amid Mixed Analyst Forecasts Through December 2025
LINK price prediction shows potential 112% surge to $27.79 by month-end, but medium-term Chainlink forecast suggests decline to $11.72 by early December amid conflicting signals.
LINK Price Prediction: $14.50 Target Within 30 Days as Oversold Bounce Emerges
LINK price prediction shows potential recovery to $14.50 in December 2025, with RSI at 29.03 signaling oversold conditions ripe for reversal.
LINK Tests Oversold Levels at $12.12 as Chainlink Finds Support Near Bollinger Band Floor
Chainlink trades at $12.12 after a 6.5% decline, with technical indicators showing oversold conditions as LINK price tests critical support levels in absence of major catalysts.
LINK Price Prediction: Chainlink Eyes $14.50 Recovery Despite Current Bearish Pressure
LINK price prediction shows potential recovery to $14.50 within 2 weeks as oversold RSI at 29.74 suggests bounce from $12.00 support zone despite recent 10.3% decline.
Chainlink Tests Lower Bollinger Band as LINK Price Finds Support Near $13.70
LINK price climbs 2.85% to $13.71 as technical indicators suggest potential oversold bounce while trading near critical Bollinger Band support levels.
LINK Price Prediction: Chainlink Eyes $21-$28 Recovery Despite Current Bearish Pressure
LINK price prediction shows potential recovery to $21-28 range within 30 days, though immediate support at $13.00 remains critical for bullish continuation.
LINK Tests Key Support at $13.95 as Technical Indicators Flash Mixed Signals
Chainlink trades at $13.95 with 3.8% daily gains while RSI hovers in neutral territory amid broader crypto market recovery and absence of major catalysts.
LINK Price Prediction: Chainlink Targets $21-27 Recovery Despite Current Bearish Pressure
LINK price prediction shows bearish short-term outlook to $13.40, but Chainlink forecast indicates strong recovery potential to $21-27 range by December 2025.
LINK Price Tests Lower Bollinger Band at $13.72 as RSI Signals Oversold Conditions
Chainlink technical analysis shows LINK price at $13.72 near critical support as momentum indicators suggest potential bounce from oversold levels in absence of major catalysts.
LINK Price Prediction: Chainlink Targets $21-27 by Year-End Despite Near-Term Bearish Pressure
LINK price prediction shows short-term decline to $13.40 support before potential recovery to $21.86-$26.96 by December 2025, with current bearish momentum creating buying opportunity.
LINK Price Tests Lower Bollinger Band Support as Bearish Momentum Builds Below $15
Chainlink price slides to $14.04 amid broader crypto weakness, with technical indicators suggesting potential test of $13.58 support as MACD confirms bearish momentum.
LINK Price Prediction: Chainlink Targets $16.50 in 2-Week Recovery Play Despite Current Bearish Momentum
LINK price prediction shows potential 16% upside to $16.50 within 2 weeks as oversold conditions near lower Bollinger Band suggest bounce from current $14.18 levels.
LINK Price Prediction: Chainlink Eyes $19 Recovery Despite Current Bearish Momentum
LINK price prediction shows potential recovery to $19.32 medium-term despite current $14.51 level, with critical support at $13.69 determining next direction.
Chainlink Tests Critical $14.60 Support as LINK Price Drops 3.9% Amid Crypto Market Weakness
LINK price falls to $14.67, testing key support levels as technical indicators signal oversold conditions while broader crypto markets decline alongside Bitcoin weakness.
LINK Price Prediction: Chainlink Eyes $25.40 Target as Technical Indicators Signal Bullish Momentum
LINK price prediction suggests a potential rally to $25.40 medium-term as technical analysis shows bullish MACD momentum despite current consolidation around $15.96 support.
Chainlink Bounces 2.3% from Key $15 Support as Technical Indicators Signal Potential Recovery
LINK rebounds to $16.13 after testing critical support levels, with divergent timeframe signals suggesting strategic entry opportunity amid recent institutional partnerships.
Chainlink Stages 4.6% Recovery Above $16 as Institutional Accumulation Offsets Technical Bearishness
LINK rebounds to $16.05 from $15 lows as Chainlink Reserve's $2M accumulation and cooling inflation data provide support despite ongoing technical headwinds in the oracle token.
LINK Price Prediction: Chainlink Eyes $18-19 Recovery Despite Current Consolidation Phase
LINK price prediction suggests potential 17-24% upside to $18-19 range within 2-4 weeks, contingent on breaking above $16.80 resistance with strong volume confirmation.
LINK Price Prediction: Chainlink Eyes $18-19 Target Despite Bearish Momentum Through December 2025
LINK price prediction shows potential 15-20% upside to $18-19 range over next month, but bearish MACD signals caution for near-term weakness below $15.
LINK Price Prediction: Targeting $18.30 Within One Week as Technical Breakout Emerges
LINK price prediction suggests a move to $18.30 short-term as recent analyst forecasts align with bullish technical patterns. Chainlink trading at $15.99 shows strong momentum.
Chainlink Tests Lower Bollinger Band Support as LINK Price Slides to $14.64 Amid Broader Crypto Weakness
LINK price drops 3.7% to $14.64, approaching critical lower Bollinger Band support at $14.94 as technical indicators flash oversold signals in absence of major catalysts.
LINK Price Prediction: Chainlink Eyes $21.50 Recovery as RSI Oversold Signals Potential Bounce
LINK price prediction suggests recovery to $21.50 by December 2025 as oversold RSI and Bollinger Band support signal potential reversal from current $14.82 levels.
LINK Price Prediction: Targeting $18-20 Recovery Within 4 Weeks Despite Current Bearish Momentum
LINK price prediction suggests potential recovery to $18-20 range over the next month, despite current technical weakness showing bearish MACD and oversold conditions.
LINK Price Slides to $16.60 as Fed Rate Cut Fails to Boost Risk Assets Amid Technical Deterioration
Chainlink drops 3% to $16.60 as Federal Reserve's 25bp rate cut triggers crypto selloff, with LINK testing critical support near $16.37 Bollinger Band lower boundary.
LINK Price Prediction: Targeting $21-26 Range as Technical Momentum Builds Through December 2025
LINK price prediction points to $21-26 upside potential over next 4-6 weeks, with current bullish MACD momentum and analyst targets converging around $18-27 range.
Chainlink Tests $17.20 Pivot Point as MACD Shows Early Bullish Divergence
LINK price holds $17.37 amid quiet trading session, with technical indicators suggesting potential momentum shift as MACD histogram turns positive despite broader consolidation pattern.
LINK Price Prediction: Targeting $21.50 by December 2025 Despite Short-Term Headwinds
LINK price prediction suggests consolidation near $17.21 before targeting $21.50 by year-end, with key resistance at $20.19 and critical support at $15.69.
Chainlink Whales Accumulate $188M in LINK Tokens as Price Tests Key Technical Support
LINK trades at $16.99 after 2.5% daily gain following massive whale accumulation of nearly 10 million tokens withdrawn from Binance, signaling institutional confidence.
LINK Price Prediction: Chainlink Eyes $21-24 Breakout by December 2025 as Technical Indicators Signal Momentum Shift
LINK price prediction targets $21-24 range within 6-8 weeks as bullish MACD momentum builds, with immediate resistance at $20.19 offering breakout potential for Chainlink.
LINK Price Prediction: Targeting $22-$28 Rally Within 30 Days as Technical Indicators Align
LINK price prediction shows potential 19-51% upside to $22-$28 range within 30 days, with bullish MACD momentum and analyst targets supporting the forecast.
LINK Price Prediction: Targeting $25.41 Recovery After Critical $14.04 Support Test
LINK price prediction shows potential for 41% upside to $25.41 if key support at $14.04 holds, with technical indicators suggesting bullish momentum building.
LINK Price Prediction: Chainlink Eyes $25 Rebound Despite Current Weakness - October 2025 Forecast
LINK price prediction shows potential recovery to $25.41 target despite current bearish momentum, with critical support at $14.04 defining the medium-term outlook for Chainlink.
Chainlink Tests Critical $17.55 Support as Oracle Rally Momentum Fades Post-Weekend
LINK price retreats to $17.55 (-1.0%) as last week's oracle-driven rally loses steam, with technical indicators suggesting further consolidation ahead before next directional move.
LINK Price Prediction: Targeting $25.41 Within 2 Weeks as Chainlink Tests Critical Support
LINK price prediction suggests upside to $25.41 as Chainlink bounces from $18.78 support. Technical analysis reveals mixed signals with neutral RSI at 45.24.
Chainlink Price Tests Key Support at $18.28 as Technical Indicators Signal Oversold Conditions
LINK trades at $18.28 following a 3.94% decline, with technical indicators suggesting potential bounce from current levels as RSI enters neutral territory.
LINK Tests Critical 200-Day Moving Average Support as Oracle Token Consolidates Near $16.74
Chainlink trades at $16.74 with minimal volatility as LINK price finds support at the 200-day moving average, setting up a potential technical inflection point for traders.
LINK Price Faces Critical Support Test at $16.67 Amid 22% Monthly Decline and Bearish Momentum
Chainlink trades at $16.54 following a 6% daily drop, testing crucial pivot support as macroeconomic headwinds drive sustained selling pressure across crypto markets.
LINK Consolidates Above 200-Day Moving Average as Bulls Test $23.73 Resistance
Chainlink trades at $22.38 with modest 0.18% daily gains as LINK holds 28.5% above its 200-day moving average, setting up potential breakout above $23.73 resistance.
LINK Price Watch: Technical Breakout Setup Above $22 Targets $24 Resistance Zone
Chainlink trades at $22.46 with bullish MACD signals and RSI neutrality, positioning for potential breakout above $23.73 resistance toward $27.87 target.
Chainlink Faces Technical Pressure as LINK Drops 4% Despite Strong Oracle Fundamentals
LINK trades at $22.04 after a 4% decline, testing support near $19.82 while maintaining 27% gains above its 200-day moving average in a mixed technical picture.
LINK Consolidates Below Key Moving Averages as Technical Indicators Flash Mixed Signals
Chainlink trades at $21.16 after a 1.95% decline, sitting below both 20-day and 50-day moving averages while maintaining strength above 200-day support at $17.05.
Chainlink Tests Key Support at $21.50 Amid Mixed Technical Signals and Multisig Concerns
LINK trades at $21.50, up 1.18% in 24 hours, as the oracle token attempts recovery from six-week lows while facing resistance at moving averages.
Chainlink Market Alert: LINK Recovers from 6-Week Low Despite $4M Institutional Purchase
LINK price rebounds 2.02% to $21.19 after touching six-week lows, while technical indicators show mixed signals and institutional buying provides support
Chainlink (LINK) Rebounds from 6-Week Low as Support Holds at $20
LINK trades at $20.71 after bouncing from $19.95 six-week low. Technical indicators suggest oversold conditions with potential trend reversal emerging.
Chainlink (LINK) Price Tests Support at $20.99 as Technical Indicators Flash Mixed Signals
LINK price drops 3.32% to $20.99, approaching Bollinger Band support while RSI shows oversold conditions creating potential reversal opportunity.
Chainlink LINK Price Holds Above $21 as Technical Indicators Signal Mixed Momentum
LINK trades at $21.79 with minimal 24h movement while RSI at 41.88 suggests oversold conditions may present buying opportunities near Bollinger Band support.
Chainlink (LINK) Tests Critical Support at $21.44 After 2.9% Daily Drop
LINK trades at $21.44 following a 2.9% decline, approaching key Bollinger Band support while RSI signals oversold conditions amid mixed institutional signals.
Chainlink (LINK) Faces Sharp 8.5% Drop as Technical Indicators Flash Mixed Signals
LINK trades at $21.35 after an 8.49% daily decline, with RSI at 39.34 suggesting oversold conditions while Bollinger Bands indicate potential support near $21.49.
Chainlink (LINK) Price Analysis: Bulls Face Test at $25 Resistance After Minor Pullback
LINK price trades at $23.40 (-0.34% daily) as Chainlink technical analysis reveals neutral RSI and bearish MACD momentum despite strong long-term bullish trend.
Chainlink (LINK) Consolidates Near $23.50 as Bulls Battle Key Resistance
LINK price trades at $23.58 after a 2.80% decline, with technical indicators showing mixed signals as Chainlink approaches critical support levels.
** Chainlink (LINK) Surges 6% as Institutional Buying Drives Price Above $24
** LINK trades at $24.43 with 2.48% daily gains as Caliber's $6.5M treasury purchase and ongoing buybacks signal growing institutional confidence in Chainlink's oracle network.
Chainlink (LINK) Surges 5.15% as Saudi Banking Partnership Fuels Bullish Momentum
LINK price hits $24.10 with 5.15% daily gains as Saudi Awwal Bank partnership drives adoption while technical indicators show neutral-to-bullish signals.
Chainlink (LINK) Price Tests Support at $22.99 Amid Mixed Technical Signals
LINK trades at $22.99 (-1.71% today) as institutional interest grows despite recent pullback from $25.51 highs following government partnership developments.
Chainlink (LINK) Holds Steady at $23.35 Despite Government Partnership Boost
LINK trades at $23.35 (+0.69% daily) with neutral momentum despite major U.S. Commerce partnership announcement signaling institutional adoption.
Chainlink (LINK) Retreats 5% as Market Digests Government Partnership News
LINK trades at $23.41 after a 5.15% decline, testing key support levels despite positive government partnership momentum and neutral RSI signals.
Chainlink (LINK) Holds $24.70 Despite Mixed Signals and Government Partnership
LINK price stabilizes at $24.73 (-2.94%) as technical indicators show conflicting signals following major U.S. Department of Commerce partnership announcement.
Chainlink LINK Price Surges 4.29% to $25.51 Despite Government Partnership Setback
LINK recovers to $25.51 with bullish technical signals emerging, while traders weigh recent U.S. government partnership against broader market headwinds.
Chainlink (LINK) Breaks Above $24 as Bulls Target $26 Resistance Despite Government Partnership Headwinds
LINK trades at $24.38, up 2.39% as technical indicators show bullish momentum despite recent partnership failing to drive sustained gains.
Chainlink (LINK) Holds Above $23 Despite 15% Decline From August Peaks Following US Government Partnership
LINK trades at $23.73 (+1.50%) as technical indicators show mixed signals despite major US Department of Commerce partnership failing to sustain bullish momentum.
Chainlink (LINK) Price Holds Above $23 Despite Mixed Market Signals and Government Partnership
LINK trades at $23.71 (+3.18% in 24h) as U.S. government partnership creates bullish fundamentals while technical indicators show neutral momentum in ongoing consolidation.
Chainlink (LINK) Faces 15% Decline Despite Major US Government Partnership
LINK trades at $22.47 with mixed signals as positive developments fail to offset broader market headwinds in September 2025.
Chainlink LINK Price Holds $22 Despite Bearish Momentum After Government Partnership
LINK trades at $22.24 (+0.14%) as bearish technical signals emerge despite major U.S. Department of Commerce partnership and $95B network value secured.
Chainlink (LINK) Faces Bearish Pressure Despite Government Partnership - Price Analysis at $22.29
LINK trades at $22.29 (-2.58% daily) as bearish technical signals emerge despite bullish U.S. Department of Commerce partnership announcement.
Chainlink (LINK) Consolidates Near $22.74 Despite Major Government Partnership
LINK price trades at $22.74 (-2.49% in 24h) as mixed signals emerge from bullish government adoption news offset by short-term selling pressure.
Chainlink LINK Price Holds Above $23 as RSI Shows Neutral Territory Despite MACD Divergence
LINK trades at $23.31 with neutral RSI at 51.27, while recent SBI Group partnership and strategic token reserve launch provide bullish catalysts for Chainlink's future growth.
Chainlink (LINK) Consolidates Above $23 Despite Mixed Technical Signals
LINK price holds steady at $23.48 (+0.82%) as institutional partnerships fuel long-term optimism while technical indicators suggest near-term caution.
Chainlink (LINK) Tests Key Support at $23.20 After Major Government Partnerships
LINK price holds steady at $23.20 following bullish partnerships with US Department of Commerce and SBI Group, with technical indicators showing mixed signals.
Chainlink (LINK) Price Drops 3.25% Despite Major US Government Partnership
LINK price trades at $22.96 after a 3.25% decline, testing key support levels despite bullish partnership with US Department of Commerce for on-chain data.
Chainlink (LINK) Holds $23.71 as Major Partnerships Drive Mixed Price Action
LINK trades at $23.71 (+1.11% daily) following US Department of Commerce partnership announcement, though technical indicators show mixed signals ahead.
Chainlink (LINK) Consolidates Below $24 as MACD Shows Bearish Divergence Despite Major Partnerships
LINK trades at $23.38 with bearish momentum signals emerging despite recent partnerships with US Department of Commerce and SBI Group driving adoption forward.
Chainlink (LINK) Tests Support at $23.39 as Bulls Fight for Control
LINK price drops 1.93% to $23.39 amid neutral RSI signals, while strong bullish trend remains intact above key support levels despite recent bearish momentum.
Chainlink LINK Price Surges 1.67% to $24.92 as Bulls Eye $27 Resistance
LINK price climbs to $24.92 with strong bullish momentum above key moving averages, targeting $27.87 resistance as technical indicators flash mixed signals.
Chainlink (LINK) Surges 18% to $26 High as Bullish Momentum Builds
LINK price reached $26.05 with 18% weekly gains, supported by strong technicals and institutional partnerships driving bullish sentiment.
Chainlink (LINK) Surges 11% on ICE Partnership as Technical Indicators Flash Bullish
LINK price hits $24.34 with 10.99% daily gains following major ICE data partnership announcement. Technical analysis shows bullish momentum with RSI at 68.37.
Chainlink (LINK) Tests $21 Support After Breaking 3-Year Pattern as Whales Accumulate
LINK trades at $21.48 (-3.24%) despite whale accumulation and technical breakout, with strong bullish momentum intact as Chainlink Reserve grows to 109K tokens.
Chainlink Price Drops 6.86% Despite Strong Technical Setup - LINK Eyes $24.74 Resistance
LINK trades at $22.27 after a 6.86% daily decline, but technical indicators suggest bullish momentum remains intact with RSI at 63.51 and strong support at $15.43.
Chainlink (LINK) Tests Overbought Territory at $23.99 as Whale Accumulation Drives Price Rally
LINK price trades at $23.99 with RSI hitting 73.48, signaling overbought conditions. Recent whale accumulation and Chainlink Reserve launch fuel bullish momentum despite technical warnings.
Chainlink (LINK) Surges 10% After Major Reserve Launch and Whale Accumulation
LINK trades at $23.34, up 10.25% as new on-chain reserve and massive whale buying drives bullish momentum amid Brazil CBDC integration news.
Chainlink (LINK) Consolidates Near $21.44 as Technical Indicators Signal Bullish Momentum
LINK trades at $21.44 after a minor 2.72% daily decline, but strong technical signals and whale accumulation suggest continued upward momentum ahead.
Chainlink Price Surges to $21.95 as LINK Whales Accumulate 0.67% of Total Supply
LINK trades at $21.95, up 1.48% in 24h, as whale accumulation and the new Chainlink Reserve launch drive strong bullish momentum despite overbought RSI conditions.
Chainlink (LINK) Surges 5.74% as Whales Accumulate and New Reserve Launch Fuels Bullish Momentum
LINK trades at $21.93 with strong whale accumulation and the new Chainlink Reserve supporting bullish momentum, though RSI signals overbought conditions ahead.
Chainlink (LINK) Surges 11% as Whales Accumulate After Reserve Launch
LINK price hits $21.00 with strong bullish momentum following the Chainlink Reserve launch and major whale accumulation of 0.67% total supply in August.
Chainlink (LINK) Surges 14% to $19 as Token Reserve Announcement Fuels Bullish Momentum
LINK jumps 14.35% to $19.04 following Chainlink's token reserve announcement, with technical indicators suggesting potential move toward $20.22 resistance level.
Chainlink (LINK) Shows Mixed Signals as Price Climbs 2.85% to $16.63
LINK price rises 2.85% to $16.63 amid neutral RSI and bearish MACD divergence. Key resistance at $20.28 tests bullish momentum in coming sessions.
Chainlink (LINK) Price Analysis: Technical Indicators Signal Mixed Momentum at $16.51
LINK trades at $16.51 (+3.77% daily) with bullish analyst targets to $28, but technical indicators show bearish MACD divergence requiring careful risk management.
Chainlink (LINK) Price Tests Support at $15.92 as Bears Eye Lower Levels
LINK price hovers at $15.92 with neutral momentum indicators signaling potential breakout or breakdown from current consolidation zone.
Chainlink (LINK) Price Falls 4% to $15.92 as Bears Target Key Support Levels
LINK price drops to $15.92 amid bearish momentum signals, testing critical support near $15.14 with RSI showing neutral conditions at 42.86
Chainlink (LINK) Plunges 9% as Fed Hawkishness Triggers Crypto Selloff
LINK drops to $16.43 amid bearish momentum, testing crucial support levels while RSI remains neutral at 46. Fed rate signals spark risk-off sentiment across crypto markets.
LINK Price Rebounds 2.44% Despite Recent Volatility - Analysts Eye $22-$28 Target
Chainlink trades at $18.07 after recovering 2.44% in 24 hours, with technical indicators showing mixed signals as analysts predict potential rally to $22-$28.
Chainlink (LINK) Price Retreats Despite CCIP Expansion Momentum
LINK trades at $17.63 after a 2.92% daily decline, but strong fundamentals from CCIP integrations and whale accumulation suggest potential reversal ahead.
Chainlink (LINK) Faces Correction After Breaking $19 Resistance - Bulls Eye $22 Recovery
LINK trades at $18.14 after a 6.25% pullback from $19.56 highs, but technical indicators suggest the recent breakout remains intact with bullish momentum building.
Chainlink (LINK) Breaks Above $18.80 as Bulls Target $22 Following Institutional Adoption
LINK trades at $18.81, up 3.01% in 24h, after breaking key resistance levels. Westpac and Imperium Markets adoption drives bullish momentum toward $22-$28 targets.
Chainlink (LINK) Eyes $22-28 Targets After Breaking $19 Resistance
LINK trades at $18.23 (+2.13% today) after surging past $19 resistance, with analysts setting bullish targets between $22-28 amid institutional adoption.
Chainlink (LINK) Faces Pullback After Breaking $19 - Key Support Levels in Focus
LINK trades at $17.80 after a 3.21% daily decline, pulling back from recent highs above $19. Technical indicators suggest bullish momentum remains intact despite the correction.
Chainlink (LINK) Breaks Past $19 as Analysts Eye $22-$28 Targets
LINK trades at $18.52 (+1.53% daily) after surging 19% past $19 resistance, with institutional adoption boosting bullish momentum toward analyst targets of $22-$28.
Chainlink (LINK) Surges to $19.47 as JPMorgan Integration Drives Institutional Adoption
LINK trades at $19.47 with strong bullish momentum following JPMorgan's CCIP integration, though RSI signals overbought conditions may trigger short-term pullback.
Chainlink Price Surges 3.73% to $19.20 as JPMorgan Integration Drives Institutional Adoption
LINK trades at $19.20 with 3.73% daily gains as JPMorgan's CCIP integration and new compliance tools fuel bullish momentum toward analyst target of $22.
Chainlink (LINK) Surges to $18.54 as JPMorgan Adoption Drives Bullish Momentum Toward $22 Target
Chainlink rallies 7.3% following JPMorgan's CCIP integration, with technical breakout above downtrend line targeting $22. RSI at 79.47 signals strong momentum.
Chainlink (LINK) Surges 7.3% on Institutional Adoption: Technical Breakout Points to $22-$28 Targets
Chainlink climbs to $18.37 following Westpac and Imperium Markets integration in Project Acacia. Technical indicators show strong bullish momentum with analyst targets at $22-$28.
Chainlink (LINK) Surges Amid Institutional Adoption and Bullish Momentum: Price Eyes $22
Chainlink (LINK) stabilizes at $18.76 following major institutional adoption, technical upgrades, and a bullish breakout. Strong market momentum positions LINK for further gains.
Chainlink (LINK) Surges Amid Institutional Adoption and Bullish Momentum: Key Developments and Price Outlook
Chainlink (LINK) sees bullish momentum with institutional adoption, new partnerships, and technical upgrades. Price targets $17 amid positive sentiment and market interest.
Chainlink (LINK) Surges Amid Institutional Adoption and Technical Milestones
Chainlink (LINK) gains momentum with Mastercard partnerships, CCIP upgrades, and whale activity, driving its price to $16.12. Can LINK sustain this bullish trend?
Chainlink (LINK) Eyes $18 Amid Bullish Momentum, Major Partnerships, and Technical Upgrades
Chainlink (LINK) is surging toward $18, driven by bullish technical momentum, major partnerships like Mastercard, and groundbreaking innovations like ACE and CCIP.
Chainlink (LINK) Targets $18 Amid Technical Breakout and Major Partnerships
Chainlink (LINK) surges past key resistance levels, fueled by major partnerships like Mastercard, technical upgrades, and rising whale activity. Analysts predict further upside potential.
Chainlink (LINK) Surges on Institutional Adoption, Technical Upgrades, and Key Partnerships
Chainlink (LINK) is riding bullish momentum, fueled by institutional adoption, technical upgrades, and major partnerships. With LINK trading at $15.09, analysts predict further growth.
Chainlink (LINK) Surges Amid Bullish Momentum: Key Developments and Price Outlook for July 2025
Chainlink (LINK) is gaining traction with institutional adoption, technical upgrades, and increased whale activity. Discover the price trends, trading signals, and market outlook for July 2025.
Chainlink Rises 50% in a Week, LINK Price Rally Set to Break ATH
Chainlink is finally joining the crypto price rally after LINK’s price broke above $16, with our technical analysis indicating there is plenty of room for a rally passed $20 and its ATH.
Litecoin Enters Top 20, Soared Over 28% in The Last 7 Days, Here Is Why
Investors are upbeat about Litecoin since the beginning of this month. The token has outperformed in the past few days, with the market cap reaching $4.91 billion.
Innovative SCIPE Tool Enhances LLM Chain Fault Analysis
SCIPE offers developers a powerful tool to analyze and improve performance in LLM chains by identifying problematic nodes and enhancing decision-making accuracy.
LTC Price Prediction: Litecoin Eyes $95-$107 Target as Technical Momentum Builds
Litecoin shows early bullish momentum with MACD histogram turning positive. LTC price prediction targets $95-$107 range if $82 support holds through December 2025.
LTC Price Prediction: Targeting $95-$107 Recovery by December 21, 2025
Litecoin shows early bullish momentum with MACD histogram turning positive. LTC price prediction targets $95-$107 range if $82 support holds, with potential 25% upside by year-end.
LTC Price Prediction: Litecoin Eyes $87-107 Recovery as MACD Signals Bullish Momentum Shift
LTC price prediction shows potential 14-30% upside to $87-107 targets if critical $82 support holds, with MACD histogram confirming early bullish momentum despite neutral RSI.
LTC Price Prediction: Litecoin Eyes $95 Recovery After Testing Critical $82 Support - December 2025 Forecast
LTC price prediction points to $87-95 target range as Litecoin tests critical support. Technical analysis suggests potential 14% upside if bulls defend $82 level.
LTC Price Prediction: Targeting $107 Short-Term Before Potential Rally to $138 by December 2025
LTC faces critical $107 support test before potential 71% rally to $138. Technical indicators suggest mixed signals with bullish momentum emerging despite current weakness.
LTC Price Prediction: Litecoin Eyes $87-$95 Recovery Despite Mixed Signals Through December 2025
LTC price prediction targets $87-$95 short-term recovery as bullish MACD momentum battles bearish moving averages. Critical $82 support holds key to Litecoin forecast.
LTC Price Prediction: Litecoin Eyes $91 Target as Technical Recovery Signals Emerge
LTC price prediction suggests a move to $91 within 2 weeks as current RSI neutrality and defending of $80 support indicate potential bullish reversal from oversold conditions.
LTC Price Prediction: Targeting $81-87 Range by Mid-December 2025 Despite Current Bearish Momentum
LTC price prediction targets $81.19 by December 3rd with potential rally to $87.95 by December 14th, though current technical indicators show bearish momentum near $74.66 support.
LTC Price Prediction: Litecoin Eyes $85 Recovery Despite Current Bearish Momentum - 1-Week Outlook
LTC price prediction points to potential $85 target as analysts maintain medium confidence despite recent 8.18% decline to $77.05 support level.
LTC Price Prediction: Targeting $91-93 Recovery Despite Current Bearish Momentum
Litecoin faces near-term upside to $91-93 as oversold conditions emerge, though bearish MACD warns of potential retest of $80 support before broader recovery.
LTC Price Prediction: Targeting $91-93 Within 7-10 Days as Breakout Momentum Builds
Litecoin shows bullish momentum with current price at $87.14, targeting $91-93 range within 7-10 days based on technical breakout patterns and analyst consensus.
LTC Price Prediction: Targeting $92-105 as Litecoin Eyes Recovery from Oversold Territory
LTC price prediction suggests targets of $92.81 short-term and $105 medium-term as technical indicators show oversold conditions amid neutral market sentiment.
LTC Price Prediction: Litecoin Eyes $92.81 Recovery Target Amid Oversold Bounce Setup
LTC price prediction targets $92.81 short-term recovery as technical indicators show oversold conditions. Litecoin forecast suggests potential 13% upside from current levels.
LTC Price Prediction: Litecoin Eyes $96-98 Recovery Despite Recent 8.5% Drop
LTC price prediction shows potential recovery to $96-98 range within 30 days as oversold conditions emerge, though bears target $79 support break first.
LTC Price Prediction: Litecoin Eyes $105-112 Recovery Despite Current Weakness Through December 2025
LTC price prediction targets $105-112 recovery by December despite current bearish momentum, with key resistance at $97 determining near-term direction for Litecoin forecast.
LTC Price Prediction: $107 Target by December 2025 Despite Current Neutral Technicals
Litecoin targets $107 by month-end with potential breakout to $130. RSI neutral at 47.84 signals consolidation before next move. Key resistance at $113.71.
LTC Price Prediction: Targeting $113-$130 Range as Technical Indicators Signal Potential Breakout
LTC price prediction suggests a move to $113-$130 over the next month as bullish MACD momentum emerges despite current neutral positioning around $97.
LTC Price Prediction: Targeting $113-$130 Range Within Two Weeks as Bullish Momentum Builds
Litecoin shows strong technical setup with MACD bullish crossover and RSI neutral positioning, targeting $113-$130 range over next 1-2 weeks with key resistance at $113.71.
LTC Price Prediction: Targeting $117-$130 in Next 30 Days as Bulls Eye Key Resistance
Litecoin forecast shows potential 19-33% upside to $117-$130 range within 30 days if LTC breaks above $102 resistance, supported by bullish MACD momentum.
LTC Price Prediction: Targeting $130-140 Breakout Within 4 Weeks as Technical Momentum Builds
Litecoin shows bullish technical setup with MACD histogram at 1.46 and analyst targets of $130-140. Current support at $101 positions LTC for potential 27-37% upside move.
LTC Price Prediction: Litecoin Eyes $130 Breakout as Technical Indicators Align for November Rally
LTC price prediction suggests a potential move to $130 by month-end as bullish momentum builds. Current technical setup favors upside with $109 immediate target.
LTC Price Prediction: Litecoin Eyes $106-$120 Breakout as Technical Setup Signals 20% Upside
LTC price prediction targets $106-$120 range within 2-4 weeks as Litecoin breaks above key resistance. Current bullish momentum suggests 20% upside potential.
LTC Price Prediction: Litecoin Eyes $109 Target as Technical Momentum Builds for November Rally
LTC price prediction shows bullish momentum targeting $109.44 by November 17th, with technical indicators supporting continued upside despite trading near resistance.
LTC Price Prediction: Targeting $95-105 Recovery Despite Current Bearish Momentum Through November 2025
LTC price prediction shows potential recovery to $95-105 range despite bearish technical signals, with key support at $79.68 critical for Litecoin forecast outlook.
LTC Price Prediction: Litecoin Eyes $105-110 Recovery After 8% Drop, $135 Medium-Term Target
LTC price prediction suggests recovery to $105-110 within two weeks after recent decline to $89, with technical analysis supporting $135 medium-term target if key resistance breaks.
LTC Price Prediction: Litecoin Eyes $135-150 Breakout Within 4-6 Weeks
LTC price prediction points to $135-150 target by December 2025, with technical indicators showing bullish MACD momentum and positioning above key moving averages.
LTC Price Prediction: Litecoin Eyes $105-110 Target by Mid-November as Technical Momentum Builds
Latest LTC price prediction shows bullish momentum emerging with MACD histogram turning positive. Analysts target $98-150 range as Litecoin breaks key resistance levels.
LTC Price Prediction: Targeting $100-105 Range by Mid-November as Technical Momentum Builds
Litecoin shows bullish momentum with MACD histogram turning positive. LTC price prediction targets $100-105 within 2-3 weeks, with key resistance at $106.98 level.
LTC Price Prediction: Litecoin Eyes $103-$106 Rebound as Technical Indicators Signal Bullish Momentum
Litecoin price prediction shows potential rebound to $103-$106 range within 1-2 weeks as MACD histogram turns bullish despite recent 3.28% decline.
LTC Price Prediction: Targeting $105-110 by November 2025 Despite Mixed Analyst Views
LTC price prediction points to $105-110 upside potential over next 3-4 weeks as technical indicators show bullish momentum despite current consolidation below $100.
LTC Price Prediction: Litecoin Targets $107-$111 by Mid-November Despite Bearish Momentum
Our LTC price prediction sees Litecoin reaching $107-$111 within 3-4 weeks as technical indicators suggest a potential reversal from oversold conditions.
Litecoin Tests Key Support at $93 as Crypto Markets Face Broad Selling Pressure
LTC price drops 2% to $92.88 amid crypto-wide decline, testing critical pivot point support with RSI showing oversold conditions in absence of major catalysts.
Litecoin ETF Approval Triggers 14% Rally as LTC Price Tests $92 Support Level
LTC price surged to $92.35 following yesterday's SEC approval of the first Litecoin ETF, marking a significant milestone for institutional adoption despite current consolidation.
Litecoin Tests Lower Bollinger Band Support as RSI Signals Potential Oversold Bounce
LTC price trades at $90.78 near critical Bollinger Band support after recent weakness, with technical indicators suggesting potential short-term reversal ahead.
Litecoin Surges 8.35% to $128.83 as Technical Breakout Drives Momentum
Litecoin climbs to $128.83 with 8.35% gains as bulls break key resistance levels, pushing RSI into overbought territory amid strong volume.
Litecoin Shows Technical Strength Above Key Moving Averages Amid Neutral Market Sentiment
LTC trades at $119.41, up 2.32% in 24 hours, positioning 20.5% above its 200-day moving average while technical indicators suggest continued bullish momentum.
Litecoin Tests Support Above $116 as MACD Signals Bullish Momentum Despite Daily Decline
LTC trades at $116.19 with -1.33% daily loss but maintains position above key moving averages while technical indicators suggest potential upside momentum ahead.
Litecoin Tests Key Support Near $105 as Technical Indicators Signal Neutral Momentum
LTC trades at $105.64 with bearish MACD signals while maintaining position above 200-day moving average, creating mixed technical outlook for traders.
Litecoin Range-Bound as LTC Tests Key Support Near $105 Amid Neutral Technical Signals
Litecoin trades at $105.87 with minimal 24-hour movement as technical indicators suggest consolidation phase, with RSI at neutral 41.4 and critical support at $100.
Breaking: Litecoin Breaks Below Key Moving Averages as LTC RSI Signals Potential Reversal Zone
LTC price holds $106.03 despite trading below critical SMAs. Technical indicators reveal mixed signals as Litecoin's RSI approaches oversold territory.
Litecoin (LTC) Drops to $103.76 as Bears Target Critical Support Levels
LTC trades at $103.76 amid bearish momentum, testing crucial $100 support despite positive ETF developments driving long-term optimism.
Litecoin (LTC) Drops to $104 as Bears Target Lower Bollinger Band Support
LTC price falls 2.37% to $104.28, testing crucial support near Bollinger Band lower boundary while RSI signals potential oversold bounce opportunity.
Litecoin (LTC) Tests Critical Support at $106 as Bears Gain Control
LTC price drops to $106.46 amid bearish momentum signals, with technical indicators pointing toward potential breakdown below key support levels.
LTC Price Drops 4.2% to $105.92 as Litecoin Tests Critical Support Levels
Litecoin trades at $105.92 after a 4.24% decline, approaching key support near $102.20 with bearish momentum signals emerging across multiple indicators.
Litecoin (LTC) Drops 8.6% as Bears Target $102 Support Level
LTC price falls to $105.42 amid bearish momentum signals, with key support at $102.20 under pressure as technical indicators flash warning signs.
Litecoin (LTC) Holds Above $114 as RSI Shows Neutral Territory
LTC price trades at $114.93 with modest 0.34% daily gains while technical indicators suggest consolidation phase ahead for Litecoin investors.
Litecoin (LTC) Consolidates at $114.83 as Bulls Eye September Close Target
LTC trades at $114.83 after 2% daily decline, but technical indicators suggest bullish momentum remains intact as traders target $127-$135 range by month-end.
Litecoin (LTC) Price Breaks Above $117 as Bullish Momentum Builds
LTC price surges 1.68% to $117.55 with strong technical indicators showing bullish momentum. Key resistance at $120.83 in focus as Litecoin maintains upward trajectory.
LTC Price Surges Above $115 as Whales Accumulate 181K Tokens
Litecoin trades at $115.75 (+1.26%) following massive whale accumulation of 181,000 LTC tokens, with technical indicators showing bullish momentum building.
Litecoin (LTC) Consolidates Near $114 as Technical Indicators Show Mixed Signals
LTC price holds steady at $114.02 with modest 0.61% gains. Bullish MACD momentum conflicts with neutral RSI, creating key decision point for traders.
Litecoin (LTC) Price Hovers at $114.64 as Technical Indicators Signal Mixed Momentum
LTC trades at $114.64 with neutral RSI at 50.19, testing key resistance levels while bullish MACD suggests potential upside momentum ahead.
LTC Price Pulls Back to $113 Despite Bullish Technical Setup Targeting $135
Litecoin trades at $113.16 (-3.20% today) as technical indicators maintain bullish momentum despite short-term correction from recent $120 highs.
Litecoin (LTC) Faces Pullback Despite Strong Technical Setup at $116.74
LTC trading at $116.74 after -2.94% decline, but bullish momentum indicators and $120+ breakout target suggest temporary retracement in ongoing uptrend.
Litecoin (LTC) Rallies to $120 as Bulls Target $135 September Close
LTC surges 3.75% to $120.13 as technical indicators signal bullish momentum toward $127-$135 range by late September, despite recent market volatility.
Litecoin (LTC) Consolidates at $114.97 as Mixed Technical Signals Point to Key Breakout Zone
LTC trades at $114.97 amid conflicting technical signals, with bullish MACD momentum facing resistance at $124.77 and critical support holding at $106.38.
Litecoin (LTC) Consolidates Above $114 as Technical Indicators Signal Potential Breakout
LTC price trades at $114.09 with bullish MACD divergence and neutral RSI, positioning for potential move toward $124 resistance level.
Litecoin (LTC) Defies Bitcoin Selloff, Technical Indicators Signal Bullish Momentum
LTC trading at $113.45 shows resilience with 5% weekly gains while Bitcoin struggles. MACD histogram turns positive, signaling potential upward momentum ahead.
Litecoin (LTC) Price Analysis: Breaking Above Key Resistance Despite Recent Dip
LTC trades at $112.83 with bullish technical momentum despite 1% daily decline. Weekend surge signals potential September rally continuation.
Litecoin (LTC) Surges Above $114 as Payment Adoption Drives Bullish Momentum
LTC trades at $114.03 (+2.40% daily) with strong payment adoption momentum offsetting ETF uncertainty, while technical indicators show neutral RSI at 50.77.
LTC Price Falls to $111.49 as Litecoin Tests Critical Support Levels
Litecoin trades at $111.49 (-2.16%) as technical indicators signal potential volatility ahead with RSI neutral and key support zones under pressure.
Litecoin Price Analysis: LTC Holds Above $112 Despite Mixed Technical Signals
LTC price trades at $112.70 with 1.22% daily gains, but bearish MACD momentum conflicts with bullish long-term trend as Luxxfolio's $73M investment announcement provides support.
Litecoin (LTC) Holds Above $111 Despite Market Headwinds - Key Support Levels in Focus
LTC price trades at $111.16 (-0.33% in 24h) as technical indicators show mixed signals while network fundamentals remain strong with 340M+ transactions processed.
Litecoin (LTC) Consolidates at $112 as Technical Indicators Signal Mixed Outlook
LTC trades at $112.02 (+0.97% daily) following recent breakout from three-year consolidation. Payment adoption surge contrasts with neutral RSI signals.
Litecoin (LTC) Consolidates Near $110 as Technical Indicators Signal Mixed Momentum
LTC trades at $110.06 with 0.27% daily gains. RSI shows neutral positioning while MACD indicates bearish momentum, creating uncertainty for traders.
Litecoin (LTC) Tests Critical Support at $108 Amid Technical Weakness
LTC price drops 2.17% to $108.57, approaching key support levels as technical indicators signal potential further downside in the short term.
Litecoin (LTC) Holds Above $110 as Mixed Technical Signals Point to Consolidation
LTC price trades at $110.91 with modest 0.33% gains, but bearish MACD and neutral RSI suggest sideways action ahead for Litecoin bulls.
Litecoin (LTC) Price Consolidates at $110.34 as Bears Test Lower Band Support
LTC trades at $110.34 with minimal 24h movement as technical indicators show mixed signals. Litecoin approaches Bollinger Band lower support zone.
Litecoin (LTC) Price Drops to $110 as Bitcoin ETF Outflows Trigger Market Slide
LTC trades at $110.34 (-2.84%) amid continued bearish pressure from Bitcoin ETF outflows, with technical indicators showing oversold conditions.
Litecoin (LTC) Under Pressure as Miners Dump $14M - Technical Analysis Shows Bearish Momentum
LTC trades at $112.86 (-1.01%) as miner sell-offs and bearish technical patterns signal potential further downside for Litecoin bulls.
Litecoin (LTC) Retreats 4.5% Despite ETF Optimism and Bullish Breakout
LTC price pulls back to $116.65 after surging 11% on ETF hopes. Technical indicators show mixed signals as Litecoin consolidates recent gains.
Litecoin (LTC) Surges Past $121 as Payment Adoption Drives Institutional Interest
LTC trades at $121.89 (+2.72%) following breakthrough payment adoption news and $100M institutional investment, with technical indicators showing bullish momentum.
Litecoin (LTC) Consolidates After 11% Rally as Technical Indicators Show Mixed Signals
LTC trades at $117.70 after recent surge to $124.90, with technical analysis revealing neutral RSI and bearish momentum divergence despite strong bullish trend.
Litecoin Price Faces Rejection at $134 as LTC Seeks Support Above $120
LTC trading at $121.71 after 7.33% daily decline, testing crucial support levels despite recent bullish momentum and whale activity driving August rally.
Litecoin Breaks $132 as LTC Price Surges on ETF Hopes and Payment Adoption
LTC trades at $132.62 (+1.45%) with RSI hitting overbought levels as Litecoin breaks three-year consolidation amid rising institutional interest and payment adoption.
Litecoin (LTC) Price Pulls Back to $119 Despite Strong Institutional Support
LTC trades at $119.28 (-3.28% daily) after recent highs near $129, with technical indicators showing mixed signals amid continued institutional adoption momentum.
Litecoin (LTC) Surges Past $124 as ETF Speculation and Institutional Interest Drive Bull Run
LTC trades at $124.81 (+4.11%) as ETF approval hopes and MEI Pharma's $100M investment fuel a breakout from three-year consolidation pattern.
Litecoin Price Retreats to $118 Despite Breaking Multi-Year Resistance - LTC Analysis
LTC trades at $118.33 (-5.33% today) after surging past 3-year consolidation. ETF hopes and halving event fuel bullish momentum despite short-term pullback.
Litecoin (LTC) Price Surges to $125 as Institutional Interest and ETF Hopes Drive 25% Weekly Rally
LTC trades at $124.99 (+3.82% in 24h) following MEI Pharma's $100M investment and growing ETF speculation, with technical indicators showing overbought conditions.
Litecoin Price Analysis: LTC Holds $120 After 25% Surge as ETF Hopes Drive Momentum
LTC trades at $120.50 after surging 25% this week on institutional investment news and growing ETF approval odds reaching 80%.
Litecoin (LTC) Price Surges Above $119 as Bulls Break Three-Year Consolidation Pattern
LTC trades at $119.51 (+1.36% in 24h) after breaking a multi-year consolidation, with strong adoption metrics and bullish technical signals pointing to further upside.
Litecoin (LTC) Tests $111 as Halving Anticipation Drives 3.5% Rally
LTC trades at $111.55, up 3.5% in 24 hours, as network activity surges ahead of August 3rd block halving despite SEC ETF delay uncertainty.
** Litecoin (LTC) Consolidates Near $108 as Post-Halving Rally Faces ETF Uncertainty
** LTC trades at $107.84 (+0.81%) following successful halving event, but SEC ETF delay creates mixed signals for traders in near-term outlook.
Litecoin Price Holds $106 Support as LTC Halving Event Boosts Long-Term Outlook
LTC trades at $106.97 (+1.79% daily) following its recent halving event, with technical indicators showing mixed signals as the market awaits ETF clarity.
Litecoin (LTC) Tests Critical Support Levels as Bears Take Control
LTC price drops 4.21% to $105.25 amid bearish momentum signals. Technical analysis reveals key support at $91.20 as bulls defend crucial levels.
Litecoin (LTC) Surges 2.21% as Block Halving Anticipation Counters ETF Delay
LTC trades at $110.63 (+2.21%) with strong bullish momentum as August halving approaches, despite SEC postponing ETF decision to October 2025.
Litecoin (LTC) Technical Analysis Shows Mixed Signals at $108 Support Level
LTC trades at $108.11 with bearish MACD divergence despite strong bullish trend. Community optimism persists as price tests key support levels near pivot point.
Litecoin (LTC) Faces Correction Despite ETF Optimism - Technical Analysis Points to Key $107 Support Test
LTC trades at $109.03 (-6.22% daily) as profit-taking emerges after recent ETF-driven rally to $112. Key support at $107 holds amid mixed technical signals.
Litecoin (LTC) Faces Correction After 19% Surge - Key Support at $87 Under Watch
LTC trading at $109.34 after -4% pullback, testing critical support levels following multi-year resistance breakout and Layer-2 smart contract launch
Litecoin (LTC) Price Holds Above $113 Despite Profit-Taking After Multi-Year Breakout
LTC trades at $113.43 (-0.16% daily) as bulls defend key support following 19% surge that broke multi-year resistance amid $100M institutional investment.
Litecoin (LTC) Surges Past $112 as ETF Optimism Drives 9.7% Weekly Rally
LTC trades at $112.98 (+3% today) after breaking key resistance at $110, fueled by 95% ETF approval odds and upcoming halving event anticipation.
Litecoin (LTC) Tests $110 Support After Retreat from $118 High Amid Institutional Backing
LTC trades at $109.80 (-3.37% daily) after pulling back from $118 peak, while MEI Pharma's $100M treasury allocation provides fundamental support.
Litecoin (LTC) Holds Strong Above $113 as RSI Signals Neutral Territory
LTC trades at $113.03 with -1.45% daily decline. Technical indicators show bullish momentum despite recent pullback, with key resistance at $122.
Litecoin (LTC) Hits $115.95 as ETF Optimism and Corporate Treasury Moves Drive Major Rally
LTC trades at $115.95 after 9.7% surge, with MEI Pharma's $100M treasury allocation and 95% ETF approval odds fueling bullish momentum despite overbought signals.
Litecoin Surges Above $117 as ETF Approval Odds Hit 95% and MEI Pharma Adds $100M Treasury
LTC price jumps 5.35% to $117.13 as Bloomberg analysts predict 95% ETF approval probability while NASDAQ-listed MEI Pharma announces massive Litecoin treasury strategy.
Litecoin Surges 9.7% as ETF Optimism and Halving Hype Drive Bullish Momentum in July 2025
Litecoin jumps to $112.07 with 95% ETF approval odds and upcoming halving creating strong bullish sentiment despite selling pressure from large holders.
Litecoin Soars 10% Amid ETF Optimism and Halving Anticipation - Technical Analysis and Price Outlook
Litecoin rallies 10% in single day amid 95% ETF approval probability and halving hype. Technical indicators show strong bullish momentum with RSI at 73.48.
Litecoin (LTC) Surges Amid ETF Optimism and Upcoming Halving Event
Litecoin (LTC) shows bullish momentum as optimism grows over a potential ETF approval and the upcoming halving event. Explore key developments, technical analysis, and price forecasts.
Litecoin (LTC) Outlook: ETF Hopes, Halving Momentum, and Market Pressures
Litecoin (LTC) sees mixed momentum as ETF approval odds rise, adoption grows, and the halving event tightens supply. Yet, selling pressure from large holders tempers optimism.
Litecoin (LTC) Surges on Halving Hype, ETF Optimism, and DeFi Growth in July 2025
Litecoin (LTC) gains momentum as halving anticipation, ETF approval optimism, and DeFi integration drive bullish sentiment. Analysts predict a potential rally to $140.
Litecoin (LTC) Gains Momentum: Halving Hype, ETF Optimism, and Bullish Indicators in July 2025
Litecoin surges on ETF optimism, upcoming halving, and DeFi adoption. With key technical upgrades and bullish signals, LTC could rally higher this July.
Litecoin (LTC) Gains Momentum: Halving Hype, ETF Optimism, and Bullish Trends in July 2025
Litecoin (LTC) is riding a wave of bullish momentum fueled by ETF optimism, halving anticipation, and increased adoption. Discover the latest trends and technical insights shaping LTC's price traje...
Litecoin (LTC) Gains Momentum Amid Halving Hype and ETF Optimism: July 2025 Outlook
Litecoin's price gains traction with ETF approval optimism, halving event anticipation, and new payment integrations. Explore recent developments, technical trends, and price predictions.
Litecoin (LTC) Surges Amid ETF Optimism and Adoption: Can It Break $100?
Litecoin (LTC) rallies on ETF approval hopes, growing adoption, and technical momentum. As traders eye the $100 mark, here's a detailed analysis of recent trends.
Litecoin (LTC) Price Analysis and Forecast: Bullish Momentum Builds Amid Recent Gains
** Litecoin (LTC) surges 4.23% in 24 hours to $95.11. With bullish momentum and key resistance ahead, discover actionable trading insights and price predictions.
Litecoin (LTC) Price Analysis: Recent Surge and Trading Insights for July 2025
Litecoin (LTC) is up 3.44%, trading at $90.87. With bullish momentum building, we analyze its recent price movement, technical indicators, and provide actionable trading strategies.
Understanding MACD: A Key Indicator for Spotting Momentum Shifts
Explore the MACD indicator's role in identifying momentum shifts in the market, as explained in Bitfinex's Chart Decoder Series. Learn how to interpret MACD components for better trading decisions.
Grayscale Reports Market Volatility Amid Late Summer Storms
Grayscale's latest market commentary highlights the impact of late summer storms on market volatility, as reported on August 8, 2024.
2025 Market Dynamics: Balancing Tech, Inflation, and Energy Shifts
Explore 2025's market dynamics as investors navigate tech innovation, inflation hedges, and energy shifts, while managing risks from spending cuts and inflation according to VanEck's analysis.
Analysts Suggest Crypto Price plunge Could be Start of New Market Trend
Analysts have indicated that the plunge in cryptocurrency prices could be the beginning of a new market trend, as Bitcoin's valuation has fallen to its lowest level since November 2021.
MATIC Price Prediction: $0.45 Target by January 2025 Despite Near-Term Weakness
MATIC price prediction shows potential recovery to $0.45 within 4-6 weeks, but immediate downside risk to $0.35 support level as technical indicators signal mixed sentiment.
MATIC Price Prediction: $0.45 Target by January 2025 as Polygon Tests Critical Resistance
Our MATIC price prediction sees potential rally to $0.45 within 4-6 weeks if Polygon breaks above $0.43 SMA 20 resistance, though downside risk to $0.33 remains.
MATIC Price Prediction: $0.45-$0.50 Target by January 2026 as Polygon Eyes Recovery
MATIC price prediction points to $0.45-$0.50 recovery zone within 4-6 weeks, contingent on breaking $0.42 resistance and holding $0.35 support levels.
MATIC Price Prediction: Targeting $0.45 Recovery Within 4-6 Weeks Despite Bearish Momentum
MATIC price prediction shows potential recovery to $0.45-$0.50 range by January 2026, but must first break $0.42 resistance while defending critical $0.35 support level.
MATIC Price Prediction: Polygon Eyes $0.45 Recovery Despite Bearish Signals - December 2025 Forecast
MATIC price prediction shows potential recovery to $0.45 within 4-6 weeks despite current bearish momentum, with critical $0.35 support holding firm in near-term outlook.
MATIC Price Prediction: Targeting $0.42-$0.45 Recovery by January 2025 Despite Current Weakness
MATIC price prediction shows potential 10-18% upside to $0.42-$0.45 by January 2025, though immediate pressure persists near $0.38 support levels.
MATIC Price Prediction: $0.45 Target by January 2026 Despite Current Bearish Momentum
MATIC price prediction points to $0.45 medium-term target despite trading at $0.38, with critical $0.58 resistance determining bullish continuation.
MATIC Price Prediction: Targeting $0.42-0.45 Range as Bulls Fight for Control
MATIC price prediction suggests a potential 11-18% upside to $0.42-0.45 range if bulls can reclaim key resistance levels, though bears threaten $0.33 downside.
MATIC Price Prediction: Target $0.22-$0.35 Recovery After Potential Decline to $0.105 Within 30 Days
MATIC price prediction points to near-term weakness toward $0.105 support before recovery to $0.22-$0.35 range. Technical analysis shows bearish momentum but medium-term bullish potential.
Polygon Small Payment Transactions Surge 23% Despite Broader Crypto Market Political Headwinds
MATIC price holds $0.38 as November transaction volume exceeds 500K small payments, though regulatory concerns weigh on broader market sentiment amid political developments.
MATIC Price Prediction: Polygon Eyes $0.22-$0.35 Recovery After Testing $0.105 Support
MATIC price prediction shows potential decline to $0.105 before medium-term recovery to $0.22-$0.35 range. Key resistance at $0.42-$0.45 level determines bullish continuation.
MATIC Price Prediction: Target $0.22-0.35 in December Despite Near-Term Weakness to $0.105
MATIC price prediction shows mixed signals with AI models targeting $0.105 short-term while analysts forecast recovery to $0.22-0.35 range within 30 days from current $0.38.
Polygon Network Activity Surges 23% as MATIC Price Holds Above $0.38 Support
MATIC trades at $0.38 following a 23% spike in small payment transactions on Polygon network, with over 500,000 operations recorded in November as adoption accelerates.
MATIC Price Steadies at $0.38 as Fed Rate Cut Expectations Boost Risk Assets Across Crypto Market
Polygon trades flat at $0.38 amid broader crypto market optimism driven by Federal Reserve rate cut speculation following weak U.S. economic data and Asian stock rallies.
MATIC Price Prediction: Targeting $0.22-0.35 Recovery Within 30 Days Despite Mixed Signals
MATIC price prediction suggests potential 15-40% upside to $0.22-0.35 range over next month, but technical indicators show conflicting signals requiring careful entry timing.
MATIC Price Prediction: $0.42-0.48 Target by December 2025 as Polygon Eyes Key Resistance Breakout
MATIC price prediction shows potential 11-26% upside to $0.42-0.48 by December 2025, with critical $0.58 resistance level determining bullish continuation for Polygon.
MATIC Holds Ground at $0.38 Despite Market Headwinds as Revolut Integration Supports Polygon Demand
Polygon maintains $0.38 price level following major Revolut integration for 65M users, though broader crypto market weakness limits upside momentum in MATIC price action.
MATIC Price Prediction: Targeting $0.45-0.58 by December 2025 Despite Current Bearish Momentum
MATIC price prediction suggests potential 18-53% upside to $0.45-0.58 range by December 2025, but must first break critical $0.58 resistance level.
Singapore Exchange Bitcoin Futures Launch Signals Institutional Momentum as MATIC Tests Key Support at $0.38
Polygon trades at $0.38 amid broader crypto consolidation following Singapore Exchange's announcement of Bitcoin and Ether perpetual futures for institutional investors.
MATIC Price Prediction: Targeting $0.45-$0.50 Breakout Within 2-4 Weeks
MATIC price prediction shows potential 18-32% upside to $0.45-$0.50 range if current support at $0.35 holds, with technical indicators suggesting consolidation phase ending.
MATIC Tests Six-Month Lows as Bitcoin Collapse Triggers Crypto Market Selloff
Polygon's MATIC token trades at $0.38 following Bitcoin's drop below $90,000, with technical indicators suggesting further downside risk as broader crypto markets face institutional selling pres...
MATIC Price Prediction: Polygon Eyes 30% Rally to $0.50 Despite Current Weakness
MATIC price prediction shows potential for recovery to $0.50 within 4-6 weeks as technical indicators suggest oversold conditions, though immediate weakness persists below key resistance.
MATIC Holds $0.38 Support as Broader Crypto Markets Navigate Mixed Traditional Asset Signals
Polygon trades at $0.38 amid neutral crypto sentiment as Wall Street's mixed inflation response and Bitcoin's sub-$95K weakness create uncertain conditions for altcoin momentum.
MATIC Price Prediction: Targeting $0.58 Breakout with 53% Upside Potential by December 2025
MATIC price prediction points to $0.45-$0.58 medium-term targets as Polygon tests critical resistance levels, with technical indicators suggesting potential breakout momentum ahead.
MATIC Holds $0.38 Support as Polygon Partnership Buffers Fed Rate Hike Concerns
Polygon's MATIC price maintains $0.38 support level despite broader crypto weakness, as new financial institution partnership provides bullish counterweight to Federal Reserve hawkish signals an...
MATIC Price Prediction: Targeting $0.45-0.73 Recovery Despite Current Weakness
MATIC price prediction shows potential for 18-92% gains targeting $0.45-0.73 range despite bearish momentum, with key resistance break at $0.43 needed for bullish confirmation.
MATIC Price Prediction: $0.45-$0.58 Target by December 2025 as Polygon Tests Critical Resistance
MATIC price prediction shows potential 53% rally to $0.58 if resistance breaks, with December 2025 targets ranging $0.45-$0.58 based on technical analysis.
MATIC Tests Critical $0.38 Support as Momentum Indicators Flash Bearish Signals
Polygon trades at $0.38 after minor decline as MACD histogram turns negative and RSI sits in neutral territory, with traders watching key support levels.
MATIC Price Prediction: $0.45-$0.58 Target by December 2025 as Polygon Tests Key Resistance
MATIC price prediction points to $0.45-$0.58 range in December 2025, with critical $0.58 resistance determining whether Polygon rallies 53% or retreats to $0.35 support.
Polygon DeFi Lending Dominance Fails to Lift MATIC Price as Payments Consortium Launch Underwhelms
MATIC trades at $0.38 despite leading DeFi lending growth and joining blockchain payments consortium, as technical indicators suggest continued weakness below key resistance.
Polygon Faces Technical Pressure as MATIC Tests 52-Week Lows Amid Broad Crypto Weakness
MATIC price hovers at $0.38 near yearly lows as technical indicators flash bearish signals and the token struggles below key moving averages in absence of major catalysts.
MATIC Price Prediction: Recovery to $0.45-$0.58 Targets as Polygon Eyes Q1 2026 Breakout
MATIC price prediction shows potential 18-53% upside to $0.45-$0.58 by Q1 2026, but must first break critical $0.43 resistance as Polygon technical analysis reveals mixed signals.
MATIC Price Prediction: Targeting $0.45-$0.58 by December 2025 Despite Current Weakness
MATIC price prediction shows potential recovery to $0.45-$0.58 range within 4-6 weeks, though current bearish momentum suggests caution with $0.35 support critical.
MATIC Price Prediction: Targeting $0.45-$0.50 Recovery Within 2-3 Weeks as Key Resistance Looms
MATIC price prediction suggests potential 18-32% upside to $0.45-$0.50 if bulls can break $0.42 resistance, with critical $0.35 support holding firm in current consolidation phase.
MATIC Tests Critical Support at $0.38 as Technical Indicators Signal Continued Weakness
Polygon trades at $0.38 with bearish MACD and oversold conditions as MATIC price action remains below all major moving averages in absence of major catalysts.
MATIC Price Prediction: Target $0.45-$0.52 Range Within 30 Days Despite Current Bearish Momentum
MATIC price prediction suggests recovery to $0.45-$0.52 range over next month as oversold conditions near key support at $0.35, with immediate resistance at $0.58.
MATIC Price Prediction: $0.45-$0.55 Target by December 2025 Amid Mixed Technical Signals
MATIC price prediction shows potential recovery to $0.45-$0.55 range within 4-6 weeks despite current bearish momentum, with key resistance at $0.43 SMA 20 level.
MATIC Price Consolidates Near $0.38 as Polygon Tests Lower Bollinger Band Support
Polygon (MATIC) trades at $0.38 with minimal 0.3% decline as technical indicators signal potential oversold bounce from current support levels in quiet market conditions.
MATIC Price Prediction: $0.45 Target by December 2025 Despite Near-Term Volatility
MATIC price prediction shows potential recovery to $0.45-$0.50 range within 4-6 weeks, though short-term downside risk to $0.35 support remains active with current bearish momentum indicators.
MATIC Price Consolidates at $0.38 as Technical Indicators Signal Potential Breakout Despite Broader Market Weakness
Polygon (MATIC) holds steady at $0.38 amid mixed technical signals, with analysts eyeing $0.45-$0.55 recovery target as RSI shows oversold conditions and volume remains subdued.
MATIC Price Prediction: Targeting $0.45-$0.58 Resistance Zone Within 30 Days
MATIC price prediction suggests potential 18-53% upside targeting $0.45-$0.58 resistance levels, though bearish momentum indicators warrant caution for short-term traders.
MATIC Consolidates at $0.38 as Wall Street Rally Boosts Crypto Sentiment Amid Light Trading
Polygon trades sideways at $0.38 following record Wall Street highs, with technical indicators suggesting potential breakout as Fed meeting approaches next week.
MATIC Price Prediction: Targeting $0.52 by December 2025 Despite Current Bearish Momentum
MATIC price prediction suggests potential recovery to $0.52 within 8 weeks, though current technical indicators show mixed signals with RSI at 38 and bearish MACD momentum.
MATIC Price Prediction: Targeting $0.45-$0.55 Recovery Within 30 Days Despite Mixed Signals
MATIC price prediction suggests potential recovery to $0.45-$0.55 range over next month, though bearish momentum and analyst disagreement create uncertainty for Polygon investors.
MATIC Price Prediction: Targeting $0.50-$0.58 Breakout by November 2025
MATIC price prediction shows potential 25-40% upside to $0.50-$0.58 range if key $0.43 resistance breaks, despite current bearish momentum signals.
MATIC Price Prediction: $0.45 Target by November 2025 as Technical Indicators Signal Recovery
MATIC price prediction shows potential 18% upside to $0.45 within 4 weeks, with analysts divided on short-term outlook ranging from $0.20 to $0.80.
Polygon Faces Technical Pressure as Layer-2 Competition Intensifies Following zkEVM Shutdown
MATIC price holds $0.38 amid sector-wide headwinds as Polygon grapples with increased layer-2 competition and the recent shutdown of its zkEVM solution, testing key support levels.
MATIC Price Prediction: Technical Divergence Suggests $0.45-$0.50 Target by November 2025
MATIC price prediction shows conflicting signals as current $0.38 trading contradicts analyst forecasts of $0.19, with technical analysis pointing to $0.45 upside potential.
MATIC Tests Monthly Lows as Bitcoin Volatility Weighs on Layer-2 Tokens Despite ETF Inflows
Polygon's MATIC token trades at $0.38 amid Bitcoin's 3% decline to $109,800, though Ethereum ETF inflows exceeding $1 billion signal growing layer-2 interest ahead of POL transition.
MATIC Tests Critical $0.38 Support as Bearish Momentum Builds Despite Polygon Technical Oversold Signals
Polygon (MATIC) holds $0.38 support level amid bearish MACD signals and oversold conditions, with Bitcoin correlation weighing on near-term price action despite technical bounce potential.
MATIC Tests Critical $0.35 Support as Polygon POS Upgrade Sparks Mixed Sentiment
Polygon trades at $0.38 (-0.3% daily) as upcoming October POS upgrade promises 5,000 TPS while MATIC price faces technical pressure at key support levels.
Polygon Gains Momentum Ahead of October POS Upgrade Despite Short-Term Consolidation
MATIC trades at $0.38 with mixed signals as October network upgrade announcement drives weekly gains despite recent sideways action and technical headwinds.
Polygon Tests Key Support at $0.38 as Technical Indicators Flash Mixed Signals
MATIC trades at $0.38 with bearish momentum building as price sits 44.6% below 200-day moving average, testing critical support levels amid neutral RSI readings.
MATIC Technical Breakdown: Oversold Conditions Signal Potential Reversal Opportunity
MATIC price trades at $0.38 with RSI at 38, creating potential entry setup as Polygon shows oversold conditions near critical support levels for strategic positioning.
Polygon (MATIC) Price Tests Support at $0.38 as Bearish Momentum Builds
MATIC price holds at $0.38 amid weak bullish trend signals, with technical indicators suggesting potential breakdown below key support levels in coming sessions.
MATIC Price Struggles at $0.38 as Polygon Technical Analysis Reveals Bearish Momentum
MATIC price holds at $0.38 amid bearish technical signals. Polygon's RSI at 38 suggests potential oversold bounce, but key resistance looms at $0.58.
MATIC Price Struggles at $0.38 as Polygon Shows Weak Bullish Signals
MATIC trades at $0.38 with bearish momentum despite weak bullish trend classification. Technical indicators suggest caution for traders.
MATIC Price Tests Key Support as Polygon Shows Mixed Signals at $0.38
Polygon (MATIC) trades at $0.38 with bearish momentum indicators, while RSI suggests potential oversold conditions may present buying opportunities.
Polygon (MATIC) Price Analysis: Testing Critical Support at $0.38 as Bears Maintain Control
MATIC price struggles at $0.38 with bearish momentum signals across multiple timeframes. Technical indicators suggest further downside risk as Polygon tests key support levels.
MATIC Price Analysis: Polygon Shows Weak Bullish Signals Despite 24h Decline
MATIC price holds steady at $0.38 amid bearish momentum signals, with Polygon's RSI at 38 suggesting potential oversold conditions developing in the market.
Polygon (MATIC) Hovers Near Support at $0.38 as Bearish Momentum Builds
MATIC price trades at $0.38 with technical indicators showing mixed signals. RSI at 38 suggests potential oversold conditions while key support levels remain intact.
MATIC Price Hovers Near Support as Polygon Shows Weak Bullish Signs Despite Technical Headwinds
MATIC trades at $0.38 with bearish momentum indicators, but Polygon's weak bullish trend suggests potential reversal if key support levels hold firm.
Polygon (MATIC) Price Struggles Below $0.40 as Bearish Momentum Builds
MATIC trades at $0.38 (-0.29% in 24h) with RSI at 38 signaling potential oversold conditions. Technical indicators point to continued weakness despite proximity to 52-week lows.
MATIC Price Tests $0.38 Pivot Point as Technical Indicators Flash Mixed Signals
Polygon (MATIC) trades at $0.38 with bearish momentum indicators, though RSI suggests potential oversold bounce opportunity for traders.
Polygon (MATIC) Price Struggles Below SMA Lines as RSI Signals Potential Reversal
MATIC price trades at $0.38 with bearish momentum indicators, though RSI at 38 suggests oversold conditions may create buying opportunities near support levels.
MATIC Price Struggles Near $0.38 as Polygon Shows Weak Bullish Signals
MATIC price trades at $0.38 with -0.29% daily decline. Technical indicators show mixed signals with RSI at 38 suggesting potential oversold conditions ahead.
MATIC Price Struggles at $0.38 as Polygon Shows Weak Bullish Signals Despite Technical Headwinds
MATIC trades at $0.38 with bearish momentum indicators, though Polygon maintains weak bullish trend. RSI neutral at 38, key support at $0.35.
MATIC Price Holds Steady at $0.38 Despite Polygon's Major POL Migration Milestone
Polygon (MATIC) trades at $0.38 with minimal volatility following successful mainnet upgrade, while technical indicators suggest continued weakness below key resistance.
MATIC Price Struggles at $0.38 Despite Successful POL Token Migration
Polygon (MATIC) trades at $0.38 with bearish momentum emerging despite completing its major POL token migration, as technical indicators signal potential downside.
Polygon (MATIC) Price Slides to $0.38 as Technical Indicators Flash Mixed Signals
MATIC price drops 0.29% to $0.38 amid bearish momentum signals, while RSI suggests potential oversold bounce opportunity for Polygon traders.
MATIC Price Struggles at $0.38 Following POL Token Migration as Technical Indicators Turn Bearish
MATIC price drops to $0.38 (-0.29%) after Polygon's successful migration to POL token, with RSI at 38 signaling potential further weakness ahead.
MATIC Price Holds at $0.38 Despite Major POL Migration Completion
Polygon's MATIC trades at $0.38 with minimal volatility following successful POL token migration, while technical indicators suggest neutral momentum
Polygon (MATIC) Price Slides Despite Successful POL Token Migration
MATIC trades at $0.38 with bearish momentum signals emerging despite successful migration to POL token completing on September 4th.
MATIC Price Drops 0.29% as Polygon Completes Major POL Migration
MATIC trades at $0.38 following successful token migration from MATIC to POL. Technical indicators show bearish momentum despite network upgrade completion.
** Polygon (MATIC) Technical Analysis: Price Tests Key Support at $0.38 Amid POL Migration
** MATIC price holds $0.38 support following successful POL token migration. Technical indicators show mixed signals as Polygon network activity surges 25%.
MATIC Price Struggles at $0.38 Despite Polygon's Token Migration to POL
MATIC price holds $0.38 amid successful POL migration and 400% NFT sales surge, but technical indicators suggest continued weakness ahead.
Polygon (MATIC) Price Analysis: POL Migration Drives Recovery Despite Technical Weakness
MATIC trades at $0.38 with mixed signals as Polygon's successful token migration to POL boosts sentiment, but technical indicators suggest caution ahead.
MATIC Price Shows Bearish Signals as Polygon Prepares for POL Migration
MATIC trades at $0.38 with bearish momentum ahead of the September 4 POL migration. Technical indicators suggest further downside despite positive adoption metrics.
Polygon (MATIC) Struggles Below $0.40 Despite 110% Volume Surge
MATIC price holds at $0.38 amid network growth catalysts, but technical indicators suggest caution as token trades well below key moving averages.
MATIC Price Drops to $0.38 as Polygon Faces Technical Breakdown Despite Network Growth
MATIC trades at $0.38 after 25% weekly decline, RSI signals oversold conditions while Polygon network activity reaches 2024 highs amid bearish momentum.
MATIC Price Holds $0.38 as Polygon User Growth Surges 14% Despite Bearish Technicals
MATIC trades at $0.38 with neutral RSI at 38, while Polygon reports 817K weekly active users (+14%) and NFT sales spike 400% to $656M, creating mixed signals for traders.
MATIC Price Struggles at $0.38 as Polygon Bears Maintain Control
Polygon (MATIC) trades at $0.38 with bearish momentum as technical indicators signal continued weakness despite oversold conditions.
Polygon (MATIC) Price Tests Support at $0.38 Despite Coinbase Migration News
MATIC trades at $0.38 with bearish momentum despite Coinbase's POL migration support. Technical indicators signal potential downside risk ahead.
MATIC Price Faces Key Support Test at $0.38 as POL Migration Nears Completion
MATIC trades at $0.38 (-0.29% 24h) near critical support levels while Coinbase's POL migration support provides underlying bullish sentiment despite technical weakness.
Polygon (MATIC) Hovers Near Support as POL Migration Approaches
MATIC price trades near critical $0.35 support with RSI at oversold 38 levels ahead of Coinbase's POL token migration on August 26.
MATIC Price Holds $0.37 Support as Polygon Prepares for POL Migration
MATIC trades near $0.37 support with oversold RSI at 38. zkEVM testnet launch and upcoming POL token migration on August 26 could drive next price move.
MATIC Price Hovers at $0.37 Support as POL Token Migration Looms
Polygon trades near critical $0.37 support with oversold RSI of 38 as markets prepare for August 26 POL token swap, creating potential reversal opportunity.
Polygon (MATIC) Faces Technical Challenges Ahead of POL Token Migration
MATIC trades in oversold territory with RSI at 38 as the market awaits major token migration to POL scheduled for August 26, showing mixed signals despite protocol upgrades.
Polygon MATIC Price Analysis: Oversold Conditions Signal Potential Reversal Ahead of POL Migration
MATIC trades near $0.37 support with RSI at 38, showing oversold conditions as major exchanges prepare for the August 26 POL token migration.
MATIC Price Struggles Below Key Moving Averages as Technical Indicators Flash Warning Signs
Polygon (MATIC) faces bearish pressure with RSI at 38 and price trading well below major moving averages, signaling potential further weakness ahead.
Polygon (MATIC) Shows Mixed Signals Despite POL Migration and Protocol Upgrades
MATIC price action reveals conflicting signals as recent ecosystem developments clash with bearish technical indicators below key support levels.
MATIC Price Faces Critical Support Test as Polygon Shows Bearish Momentum
MATIC trading near lower Bollinger Band at $0.00, with RSI at 38 signaling potential oversold conditions as Polygon approaches key support levels around $0.35.
Polygon (MATIC) Hovers Near Critical Support as Bears Test $0.35 Level
MATIC price showing weakness near $0.35 support with RSI at 38, while Bollinger Bands signal potential oversold bounce opportunity for traders.
Polygon (MATIC) Technical Analysis Shows Oversold Conditions Amid Token Migration News
MATIC trades in oversold territory with RSI at 38 while major exchanges prepare for POL token swap scheduled for August 26, 2025.
Polygon (MATIC) Price Analysis: Technical Indicators Point to Bearish Momentum Despite Oversold Conditions
MATIC price hovers near critical support levels with RSI at 38, suggesting potential reversal opportunity amid broader market weakness.
Polygon (MATIC) Hovers Near Critical Support as Technical Indicators Flash Mixed Signals
MATIC price struggles near $0.35 support level with RSI at 38, while Bollinger Bands suggest oversold conditions may present buying opportunity for risk-tolerant traders.
Polygon (MATIC) Tests Critical Support at $0.35 as Bearish Momentum Intensifies
MATIC price hovers near crucial support levels with RSI at 38 showing oversold conditions may be approaching for Polygon traders.
Polygon (MATIC) Tests Critical Support at $0.35 Amid Bearish Technical Signals
MATIC price hovers near key support levels with RSI at 38 and bearish MACD, signaling potential further downside as technical indicators flash warning signs.
Polygon (MATIC) Shows Mixed Signals as Central Bank Partnership Boosts Adoption Outlook
MATIC trades with bearish technicals despite Italy's Central Bank partnership announcement. RSI at 38 suggests oversold conditions may present opportunity.
MATIC Price Shows Bearish Momentum as Polygon Tests Critical Support Near $0.35
MATIC price faces downward pressure with RSI at 38 and trading below all major moving averages, testing key support levels around $0.35 in current market conditions.
Polygon (MATIC) Price Surges on Italy Central Bank Partnership and NFT Dominance
MATIC trades near support levels around $0.37 despite recent positive catalysts from Italy's Central Bank partnership and Polygon surpassing Ethereum in NFT sales.
Polygon (MATIC) Tests Lower Bollinger Band Support Amid Central Bank Partnership News
MATIC trades near $0.35 support with RSI at 38, while Italy's Central Bank partnership and Palm Network launch provide fundamental catalysts for potential recovery.
MATIC Price Struggles Below $0.40 as Polygon Shows Bearish Technical Signals
MATIC price hovers near critical support at $0.35 with RSI at 38, signaling potential oversold conditions as Polygon faces mounting selling pressure.
Polygon (MATIC) Price Faces Pressure Despite POL Token Migration and Binance Listing Success
MATIC trading at bearish levels with RSI at 38 despite recent Polygon 2.0 upgrade announcement and successful POL token Binance listing driving 21% surge earlier this week.
MATIC Price Analysis: Polygon Shows Bearish Momentum Near Critical Support Levels
MATIC trades near $0.37 support as Polygon technical analysis reveals bearish MACD signals and oversold conditions pointing to potential reversal or breakdown.
Polygon (MATIC) Price Analysis: Technical Bearish Signals Despite POL Token Listing Boost
MATIC price shows mixed signals at current levels with RSI at 38 despite recent Binance POL listing providing 15% weekly gains and major partnership announcements.
Polygon Price Defies Technical Weakness as POL Token Migration Drives New Interest
MATIC shows mixed signals despite major corporate partnerships and Binance POL listing, with technical indicators suggesting caution at current levels.
Polygon (MATIC) Technical Analysis July 2025: Bearish Signals Emerge Despite Weak Bullish Trend
MATIC shows mixed signals with RSI at 38 and price below all major moving averages. Technical indicators suggest potential consolidation phase ahead.
Polygon (MATIC) Surges 21% Following 2.0 Upgrade Announcement and POL Token Migration Proposal
MATIC rallied from $0.72 to $0.87 after Polygon announced its 2.0 upgrade and proposed migrating to POL token, reclaiming 10th position by market cap.
Polygon (MATIC): Binance Listing, Major Partnerships, and Technical Upgrades Propel Market Sentiment
Polygon (MATIC) sees bullish momentum fueled by Binance listing, Polygon 2.0 upgrade, and partnerships with Starbucks, Nike, and Meta. Discover the latest developments.
Polygon (MATIC) Faces Mixed Signals Amid Bitfinex Delisting and Heimdall v2 Upgrade
Polygon (MATIC) navigates a critical week with mixed market sentiment. Key developments include the Heimdall v2 upgrade, a €100M blockchain bond, and Bitfinex's delisting announcement.
Polygon (MATIC) Weekly Update: Heimdall v2 Upgrade, €100M Blockchain Bond, and Mixed Market Signals
Polygon's (MATIC) ecosystem saw major developments this week, including the €100M NRW.BANK blockchain bond and the Heimdall v2 upgrade. Despite Bitfinex delisting, technical upgrades and institutio...
Polygon (MATIC) News Roundup: Key Partnerships, Technical Upgrades, and Price Outlook for 2025
Discover how Polygon's (MATIC) strategic partnerships, technical innovations, and mixed market signals shape its 2025 outlook. Explore trading strategies and price forecasts.
Polygon (MATIC): Key Partnerships, Technical Advances, and Price Predictions for 2025
Polygon (MATIC) solidifies its enterprise blockchain leadership with major partnerships, technical upgrades, and NFT dominance. Discover how these developments could shape its price trajectory in 2...
Infrastructure Giants Cash In as Memecoin Traders Face Losses
The memecoin trend is drawing significant profits, mainly for exchanges, launchpads, and trading bots, rather than for traders investing in viral tokens.
NEAR Price Prediction: $2.25 Target Within 4-6 Weeks as Technical Indicators Signal Potential 38% Rally
NEAR Protocol forecast shows bullish momentum building with MACD turning positive. Our NEAR price prediction targets $2.25-$2.35 range if key $2.00 resistance breaks.
NEAR Price Prediction: Technical Setup Points to $1.85 Target by January 2026
NEAR Protocol shows bullish MACD momentum with analysts targeting $1.76-$2.25. Current $1.66 price sits near Bollinger Band support, setting up potential 11-35% upside.
NEAR Price Prediction: $2.25 Target by January 2026 as Technical Indicators Signal Recovery
NEAR Protocol shows bullish MACD momentum despite trading 48% below highs. Technical analysis suggests $2.25 price target within 4-6 weeks if $2.09 resistance breaks.
NEAR Price Prediction: $2.10 Target by December 2025 as Protocol Tests Key Resistance
NEAR price prediction targets $2.10 by December 2025, representing 20% upside. Technical analysis shows neutral RSI and emerging bullish momentum signals.
NEAR Price Prediction: $2.35 Target by Year-End with Potential 33% Upside
NEAR Protocol forecast suggests $2.35 price target by December 31st as technical indicators show bullish momentum building despite recent weakness below key moving averages.
NEAR Price Prediction: $2.40 Target by End of December as Protocol Eyes Critical $2.00 Breakout
NEAR price prediction points to $2.40 target by December 31st if bulls can reclaim the $2.00 resistance level, with technical analysis showing oversold conditions creating potential entry opportunity.
NEAR Price Prediction: Target $2.35-$2.82 by End December 2025 Despite Current Bearish Momentum
NEAR Protocol forecast shows potential 24-47% upside to $2.35-$2.82 range by December 2025, contingent on breaking $2.00 resistance with current neutral RSI at 44.26.
NEAR Price Prediction: Targeting $2.35-$2.82 Recovery by December 2025 Despite Current Bearish Momentum
NEAR Protocol shows oversold conditions with analyst targets of $2.35-$2.82 by December 2025, though immediate resistance at $2.00 must break first.
NEAR Price Prediction: Recovery to $2.35-$2.80 Target by January 2025
NEAR Protocol technical analysis suggests potential 39-66% upside to $2.35-$2.80 range as oversold RSI conditions and analyst consensus point to medium-term recovery.
NEAR Price Prediction: Target $2.35 by December 2025 Despite Current Bearish Momentum
NEAR Protocol shows potential for 42% upside to $2.35 target despite current oversold conditions, with key support at $1.65 and resistance at $2.66 shaping near-term outlook.
NEAR Price Prediction: $2.35 Target by December 2025 Amid Technical Recovery Signs
NEAR price prediction suggests 22% upside to $2.35 by December 2025, with analysts forecasting recovery from oversold conditions despite current bearish momentum signals.
NEAR Price Prediction: $2.35 Target by December 2025 Amid Technical Recovery
NEAR price prediction suggests 22% upside to $2.35 by December 2025, with analysts targeting short-term gains to $1.95 despite current bearish momentum signals.
NEAR Price Prediction: $2.82 Target by December with Potential Rally to $4.67 in Q1 2026
NEAR Protocol shows bullish potential with analysts targeting $2.82 short-term and $4.67 long-term as technical indicators suggest oversold conditions may reverse.
NEAR Price Prediction: Technical Indicators Point to $2.36 Short-Term Target Despite Current Bearish Momentum
NEAR price prediction suggests potential recovery to $2.36 within one week, though current technical indicators show mixed signals with RSI at 35.62 and bearish MACD momentum.
NEAR Price Prediction: Target $2.50-$2.80 by December 2024 Despite Current Bearish Momentum
NEAR Protocol faces bearish pressure at $1.90, but technical analysis suggests potential recovery to $2.50-$2.80 range within 4-6 weeks if key support holds.
NEAR Price Prediction: $2.80-$3.20 Target by December 2025 as Technical Indicators Signal Recovery
NEAR price prediction suggests potential 27-45% upside to $2.80-$3.20 range within 4-6 weeks, contingent on breaking $2.44 resistance and sustained volume confirmation.
NEAR Price Prediction: Targeting $3.20 Breakout Within 2-4 Weeks Despite Current Consolidation
NEAR Protocol faces key $3.20 resistance with analysts forecasting 42% upside potential, while technical indicators show mixed signals requiring careful risk management.
NEAR Price Prediction: $3.20 Target by Early December Amid Technical Recovery
NEAR Protocol forecast points to $3.20 resistance test within 2-4 weeks as technical indicators align for potential breakout from current $2.32 consolidation zone.
NEAR Price Prediction: Targeting $3.20 Within 2 Weeks as Technical Momentum Builds
NEAR Protocol shows bullish MACD signals pointing to $3.20 resistance test within two weeks, with medium-term forecast suggesting $7.70-$10 range if key levels break.
NEAR Price Prediction: Target $3.20 Short-Term, $7.70 by Year-End 2025
NEAR Protocol shows bullish momentum with MACD confirmation targeting $3.20 resistance. Medium-term forecast suggests potential rally to $7.70-$10 range.
NEAR Price Prediction: Technical Breakout Targets $3.20-$7.70 by Year-End 2025
NEAR Protocol shows bullish momentum with MACD confirmation. Technical analysis suggests potential rally to $3.20 resistance, with long-term targets reaching $7.70-$10.
NEAR Price Prediction: $3.20-$5.00 Target Within 4 Weeks as Protocol Tests Key Resistance
NEAR Protocol forecast shows bullish momentum targeting $3.20-$5.00 range within one month, with critical $3.37 resistance breakout needed for continuation to higher levels.
NEAR Price Prediction: $3.20 Target Within 4 Weeks as Technical Momentum Builds
NEAR Protocol shows bullish momentum with analysts targeting $3.20-$3.50. Current technical setup suggests 20% upside potential as MACD turns positive.
NEAR Protocol Tests Lower Bollinger Band Support as RSI Signals Oversold Conditions
NEAR price trades at $2.23 amid 2.7% decline, approaching critical support zone as technical indicators suggest potential reversal setup in oversold territory.
NEAR Protocol Tests $2.17 Support as RSI Signals Oversold Bounce Opportunity
NEAR Protocol trades at $2.17 with modest 1.17% gains as technical indicators suggest potential reversal from oversold conditions despite absence of major catalysts.
NEAR Protocol Tests Key Support at $2.15 as Bitcoin Weakness Pressures Altcoins
NEAR Protocol trades at $2.15 amid broader crypto market pressure, with technical indicators suggesting further downside risk as Bitcoin faces resistance above $115,000.
NEAR Analysis: Protocol Tests Critical Support as Technical Indicators Signal Potential Reversal Setup
NEAR trades at $2.67 after a 3.05% decline, hovering near key support levels with mixed signals suggesting a strategic entry opportunity for positioned traders.
NEAR Technical Breakdown: Protocol Holds Above Key Support Despite Mixed Momentum Signals
NEAR price trades at $2.75 with 2.76% daily gains as technical indicators show conflicting signals between bullish trend structure and bearish momentum divergence.
NEAR Protocol Price Drops 1.36% Despite Network Upgrade Success - NEAR Technical Analysis
NEAR price currently at $2.68 amid conflicting signals as successful network upgrade fails to sustain bullish momentum while technical indicators show mixed outlook.
NEAR Protocol Technical Analysis: AI Integration Boosts NEAR Price Despite Recent Pullback
NEAR Protocol trades at $2.86 after a 4.63% daily decline, but recent AI integration and network upgrade position it for potential recovery from key support levels.
NEAR Protocol Surges Above $3 as Network Upgrade Fuels Bullish Momentum (NEAR)
NEAR Protocol trades at $3.02 following successful network upgrade and AI integration, with technical indicators showing continued bullish strength despite minor 24h decline.
NEAR Protocol Surges 1.5% as Network Upgrade Completes, RSI Shows Bullish Momentum
NEAR trades at $2.92 (+1.5%) following successful hard fork. Technical indicators suggest continued upside with RSI at 56 and MACD turning bullish.
NEAR Protocol Price Drops 9.5% to $2.84 as NEAR Tests Critical Support Levels
NEAR Protocol trades at $2.84 after a sharp 9.52% decline, but technical indicators suggest potential reversal as NEAR RSI remains neutral at 53.26.
NEAR Protocol Surges Above $3.14 as Bulls Target $3.34 Resistance - NEAR Technical Outlook
NEAR price hits $3.14 with strong bullish momentum as technical indicators flash buy signals. RSI at 67.91 suggests more upside potential before overbought conditions.
NEAR Protocol Surges Above $3 as Technical Indicators Signal Strong Bullish Momentum
NEAR price trades at $3.13 with RSI approaching overbought territory while multiple moving averages confirm bullish trend continuation for NEAR Protocol.
NEAR Protocol Surges 10.4% as NEAR Price Breaks Key Resistance at $3.21
NEAR Protocol (NEAR) rallies to $3.21 with 10.4% daily gains, breaking above key resistance as RSI enters overbought territory signaling potential consolidation ahead.
NEAR Protocol Surges 8.57% as NEAR Price Tests Critical $3.06 Resistance
NEAR trades at $2.94 with strong bullish momentum as technical indicators signal potential breakout above key resistance levels in the coming sessions.
NEAR Protocol Holds Above $2.60 Support as Technical Indicators Signal Bullish Momentum
NEAR price trades at $2.69 with RSI in neutral territory while MACD shows bullish divergence, setting up potential upside toward $2.89 resistance level.
NEAR Protocol Surges 4.23% as Technical Indicators Flash Strong Bullish Signals
NEAR Protocol (NEAR) trades at $2.71 with bullish momentum building. RSI in neutral zone while MACD shows positive divergence, suggesting potential upside continuation.
NEAR Protocol Shows Bullish Momentum Despite 4.65% Daily Decline - NEAR Price Analysis
NEAR price drops to $2.62 amid 4.65% decline, but technical indicators suggest underlying bullish momentum as NEAR Protocol MACD signals potential reversal.
NEAR Protocol Faces Resistance at $2.89 as NEAR Price Tests Key Technical Levels
NEAR price currently at $2.75 (-3.77% in 24h) as bulls challenge $2.89 resistance. Technical indicators show mixed signals with RSI at 59 and MACD bullish.
NEAR Protocol Surges 5.16% as Cross-Chain Expansion Drives Bullish Momentum (NEAR)
NEAR price jumps to $2.85 following cross-chain integrations with Aptos and Tron. Technical indicators show strong bullish momentum with RSI at 64.46.
NEAR Protocol Price Analysis: NEAR/USDT Tests $2.70 Amid Cross-Chain Expansion
NEAR price holds at $2.70 despite 0.77% daily decline as protocol expands to 20 blockchains. Technical indicators show mixed signals with RSI at neutral 57.77.
NEAR Protocol Surges 1.69% as Cross-Chain Expansion Drives NEAR Price Above $2.70
NEAR price hits $2.71 (+1.69%) as protocol expands to 20 blockchains through Aptos and Tron integration, with technical indicators showing strong bullish momentum.
NEAR Protocol Surges 7% as Cross-Chain Integration Expands to 20 Blockchains (NEAR)
NEAR price jumps to $2.70 (+7.09%) following major cross-chain expansion and AI partnerships, with technical indicators showing bullish momentum near resistance levels.
NEAR Protocol Bounces Above $2.48 Support as MACD Shows Early Bullish Divergence (NEAR)
NEAR price sits at $2.49 (+2.09% in 24h) with technical indicators showing mixed signals as the protocol trades near critical pivot levels around $2.48.
NEAR Protocol Rallies 2.14% as Technical Indicators Signal Consolidation Phase
NEAR trades at $2.44 with a 2.14% daily gain, showing stability amid market-wide consolidation as technical analysis reveals neutral momentum signals.
NEAR Protocol Tests Support as NEAR Price Drops 3.43% to $2.39
NEAR Protocol trades at $2.39 following a 3.43% daily decline, with technical indicators showing mixed signals as traders watch key support levels.
NEAR Protocol Shows Neutral Price Action at $2.43 as NEAR RSI Signals Consolidation
NEAR price holds steady at $2.43 with 0.66% daily gains while technical indicators suggest consolidation phase ahead of potential directional breakout.
NEAR Protocol Price Analysis: Technical Indicators Signal Potential Reversal at $2.40
NEAR Protocol trades at $2.40 amid mixed technical signals, with RSI neutral at 44.45 and key support holding at $2.28 levels.
NEAR Protocol Shows Weak Bullish Momentum as NEAR Price Holds Above $2.40 Support
NEAR Protocol trades at $2.45 (+3.42% in 24h) with neutral RSI at 46.27, testing key support levels as technical indicators show mixed signals for traders.
NEAR Protocol Faces Bearish Pressure as NEAR Price Tests $2.28 Support Level
NEAR trades at $2.35 (-1.55%) with technical indicators suggesting continued weakness. RSI at 41.74 and price near Bollinger Band lower support signal caution for traders.
NEAR Protocol Price Analysis: NEAR Tests Critical $2.30 Support After 3.76% Drop
NEAR Protocol trades at $2.35 after declining 3.76% in 24 hours, approaching crucial support levels as technical indicators flash mixed signals for traders.
NEAR Protocol Price Consolidates Below Key Resistance as NEAR RSI Signals Potential Reversal
NEAR price trades at $2.45 with bearish momentum indicators, testing critical support levels while RSI suggests oversold conditions may trigger bounce.
NEAR Protocol Shows Mixed Signals as NEAR Price Tests Lower Support at $2.43
NEAR price drops 1.58% to $2.43 as technical indicators flash mixed signals with RSI neutral at 43.89 and price approaching critical support levels.
NEAR Protocol (NEAR) Drops 2.21% as Technical Indicators Signal Bearish Momentum
NEAR price falls to $2.47 with bearish MACD signals and RSI at 45.36. Key support at $2.35 holds as traders watch for potential breakdown below $2.30.
NEAR Protocol Price Analysis: Technical Indicators Point to Potential Support Test at $2.35
NEAR price trades at $2.51 (-1.33% today) with RSI at 46.57 suggesting neutral momentum, but MACD bearish divergence warns of potential decline toward key support levels.
NEAR Protocol Price Drops 8% After Network Upgrade Despite Institutional Interest
NEAR price falls to $2.57 (-8.22%) following successful hard fork completion, with technical indicators showing mixed signals and institutional selling pressure weighing on sentiment.
NEAR Protocol Rebounds to $2.75 After Heavy Institutional Selling Triggers 7% Drop
NEAR trades at $2.75 (+1.18%) following institutional sell-off that pushed prices to $2.68. Technical indicators show bullish momentum building despite recent volatility.
NEAR Protocol Faces 7.77% Decline as NEAR Price Tests Key Support at $2.77
NEAR price drops to $2.77 amid broader market weakness, but technical indicators suggest potential bullish reversal as NEAR RSI holds neutral territory.
NEAR Protocol Surges 8.26% as Bulls Target $3.10 Resistance
NEAR trades at $3.04 after an 8.26% daily rally, approaching critical resistance at $3.10 while technical indicators show bullish momentum continuing.
NEAR Protocol Surges 5.29% to $2.76 as Institutional Flows Signal Bullish Momentum
NEAR Protocol trades at $2.76 with 5.29% daily gains, supported by $10.1M institutional inflows and bullish technical indicators suggesting continued upward momentum.
NEAR Protocol Price Analysis: NEAR Tests $2.62 Support After 4.4% Daily Decline
NEAR trades at $2.62 (-4.44% today) despite recent institutional accumulation. Technical indicators suggest consolidation phase with key support at $2.30.
NEAR Protocol Surges Above Key Resistance as NEAR Price Eyes $3.10 Breakout
NEAR trades at $2.75 with bullish momentum building as institutional accumulation drives ecosystem expansion and technical indicators signal potential upside.
NEAR Protocol Price Drops 2.5% Despite Recent Institutional Buying - Technical Analysis Shows Mixed Signals
NEAR trades at $2.73 after a 2.5% daily decline, with RSI at neutral 54.28 while institutional accumulation continues following last week's 5% rally driven by ecosystem growth.
NEAR Protocol Surges 5.91% as Institutional Buying Drives NEAR Above Key Resistance
NEAR price hits $2.79 with strong 5.91% daily gains as institutional accumulation and bullish technicals signal continued upside momentum for NEAR Protocol.
NEAR Protocol Rallies 6.41% to $2.64 as Institutional Buying Drives Recovery
NEAR Protocol trades at $2.64 after a 6.41% daily surge, backed by institutional accumulation and strong volume signals pointing to potential breakout above resistance.
NEAR Protocol Recovers to $2.48 as Strategic Partnership Offsets Altcoin Market Weakness
NEAR price rebounds 2.99% to $2.48 despite broader altcoin selloff, with RSI showing neutral conditions around 45 while cross-chain partnership provides fundamental support.
NEAR Protocol Price Rebounds 8% as Institutional Buying Drives NEAR Recovery from Support
NEAR trades at $2.48 with 3.04% daily gains as institutional accumulation and governance developments shape near-term outlook for the Layer 1 protocol.
NEAR Protocol Drops Below Key Support as NEAR Price Faces $2.30 Test
NEAR Protocol trades at $2.40 (+1.26%) but remains below critical moving averages. Technical indicators signal bearish momentum despite recent institutional buying surge.
NEAR Protocol Price Drops 4.74% Despite Institutional Buying Wave (NEAR)
NEAR trading at $2.37 after 4.74% decline, testing key support despite recent institutional accumulation that drove 8% recovery from $2.52 support zone.
NEAR Protocol Faces Pressure Despite Double Bottom Signal - NEAR Price Tests Critical Support
NEAR Protocol trades at $2.48 after an 8% decline, testing key support levels despite recent bullish technical patterns and strategic partnerships driving growth optimism.
NEAR Protocol Bounces Back Above $2.70 as Strategic Partnership Sparks 9% Rally (NEAR)
NEAR trades at $2.70 after rebounding from $2.59 lows, driven by Everclear partnership announcement targeting trillion-dollar cross-chain settlement market.
NEAR Protocol Faces Bearish Pressure as NEAR Price Tests $2.40 Support Level
NEAR trading at $2.66 (-2.88% in 24h) struggles below key moving averages despite recent Everclear partnership boost, with technical indicators pointing to potential breakdown.
NEAR Protocol Faces Pressure Below $3 as Technical Patterns Signal Mixed Outlook
NEAR trades at $2.75 after an 8.29% decline, testing critical support levels while technical analysis reveals conflicting signals for the altcoin's next move.
NEAR Protocol Falls 5.2% to $2.77 Despite Strategic Partnership Boost
NEAR drops to $2.77 (-5.2%) as altcoin weakness overshadows recent Everclear partnership. Technical indicators show mixed signals with NEAR RSI at 54.35.
NEAR Protocol Surges to $2.90 as Institutional Buying Drives Recovery After Market Volatility
NEAR Protocol rebounds to $2.90 (+1.82% in 24h) following institutional buying and Everclear partnership, with technical indicators showing bullish momentum despite recent market turmoil.
NEAR Protocol Rebounds 7.5% as Technical Indicators Signal Continued Bullish Momentum (NEAR)
NEAR Protocol trades at $2.87 with 7.5% daily gains as RSI enters neutral zone and partnership with Everclear drives institutional interest amid volatile week.
NEAR Protocol Price Drops 4.7% Despite Recent Partnership Rally - NEAR Technical Analysis
NEAR Protocol trades at $2.67 after a 4.7% decline, testing key support levels despite institutional buying following Everclear partnership announcement.
NEAR Protocol Eyes $3.10 Resistance as AI Momentum Builds Despite 2% Daily Decline
NEAR price trades at $2.72 (-2.02% today) but shows bullish momentum from recent AI integration news. Technical indicators suggest potential breakout above $3.10 resistance.
NEAR Protocol Surges to $3.01 as AI Integration Drives Double-Digit Gains (NEAR)
NEAR Protocol trades at $3.01 with 12% weekly gains as AI integration momentum and Grayscale inclusion fuel bullish sentiment despite overbought RSI signals.
NEAR Protocol Surges Past $3 as AI Integration Fuels 12% Rally
NEAR Protocol trades at $3.00 (+3.17% daily) after reaching $3.04 high, driven by AI integration momentum and overbought RSI signaling potential consolidation ahead.
NEAR Protocol Surges 12% as AI Integration Drives Bullish Momentum in July 2025
NEAR Protocol jumps 12% to $3.04 as AI sector momentum and altcoin rally fuel investor optimism. Technical indicators show strong bullish signals despite overbought conditions.
NEAR Protocol Surges 12% as AI Sector Rally Drives Institutional Interest - Technical Analysis & Price Outlook
NEAR Protocol rallied 12% to $3.04 amid AI sector resurgence and Bitwise's bullish commentary on 'billions of AI agents' managing capital on the blockchain.
NEAR Protocol (NEAR) Surges Amid Bullish Momentum: Technical Analysis and Price Outlook
NEAR Protocol has rallied by over 9% in 24 hours, fueled by institutional adoption and a bullish altcoin market. Explore recent events, technical analysis, and price predictions.
NEAR Protocol Targets $3 Amid Institutional Adoption and Bullish Momentum
NEAR Protocol is gaining institutional traction, with recent adoption milestones and bullish technical signals pushing its price toward the $3 resistance level.
NEAR Protocol (NEAR) Eyes $3 Amid Bullish Momentum and Adoption Surge
NEAR Protocol gains traction with bullish momentum, surging adoption, and scaling ambitions. Market eyes $3, supported by technical indicators and major ecosystem developments.
NEAR Protocol Surges Amid Adoption and Institutional Support: Price Analysis and Outlook
NEAR Protocol reached 46M monthly active users, gained institutional traction, and maintained bullish momentum despite volatility. Discover the latest price insights and forecast.
NEAR Protocol Targets 1 Million TPS Amid Bullish Momentum and Institutional Interest
NEAR Protocol is making waves with its ambitious scalability goals and institutional adoption. Discover how recent developments and technical indicators shape its outlook.
NEAR Protocol (NEAR) Targets Scalability Amid Mixed Market Signals
NEAR Protocol sets its sights on 1M TPS, boosting adoption potential. Despite recent price declines, positive developments like staking ETP launch fuel cautious optimism.
NEAR Protocol Price Surge: Institutional Momentum and Bullish Breakout Signals
NEAR Protocol surges to $2.54, fueled by institutional adoption and bullish momentum. With a potential breakout to $3.50, traders eye technical signals and market trends.
NEAR Protocol (NEAR) Price Analysis: Bullish Signals Amid Recent Gains
NEAR Protocol surges 4.25% in 24 hours, trading at $2.35. With bullish momentum indicators and key resistance levels ahead, here’s what traders need to know.
NEAR Protocol (NEAR) July 2025 Analysis: $2.35 Price Action & Market Outlook
NEAR Protocol shows 4.49% gains at $2.35 as institutional interest grows. Technical indicators signal neutral trend with potential for breakout above $2.39 resistance.
NEAR Protocol Price Analysis: $2.35 Target After 4.40% Surge - July 2025 Update
NEAR Protocol shows bullish momentum at $2.35, up 4.40% in 24h. Technical indicators suggest potential breakout toward $3.5 resistance amid recent institutional developments.
Global NFT Market Expected to Hit $97.6B by 2028, Recording a CAGR of 31.6%
Since non-fungible tokens (NFTs) help build authentic intellectual property, this is one of the key drivers expected to push the sector to a $97.6 billion valuation by 2028, according to a report by Research and Markets.
NFT Trading Volume Surpasses $54B, Exceeds 200% in 2022
The NFT market continues to take the world by storm based on the notable adoption and trading volume witnessed.
NFT Sales Slide to a 12-Month Low Amid Crypto Meltdown
The bloodbath in the crypto market has contributed to sales in the non-fungible token (NFT) sector slipping to a 12-month low, according to crypto analytic firm Chainalysis.
NVIDIA NIM Revolutionizes Financial Data Analysis with AI
NVIDIA's NIM technology transforms financial analysis by integrating AI microservices, enhancing data synthesis, and improving investment decision-making.
NVIDIA Introduces AI Agent for IT Ticket Analysis with Nemotron
NVIDIA unveils an AI agent leveraging Nemotron to analyze IT tickets, transforming unstructured data into actionable insights through advanced AI models and graph databases.
NVIDIA Unveils AI Blueprint for Video Search and Summarization
NVIDIA introduces a new AI Blueprint enabling industries to develop visual agents for video analysis, enhancing productivity and safety across various sectors.
NVIDIA's RAPIDS-singlecell Revolutionizes Billion-Cell Data Analysis in Biology
NVIDIA's RAPIDS-singlecell tool addresses data size and analysis speed challenges in single-cell biology, revolutionizing research with GPU acceleration for billion-cell data sets.
Data Shows US Economy Shrinks Amid Recession while Crypto Surges in Bearish Rally
According to the New York Empire State Index, a weakening of the U.S economy is worrying manufacturers. Meanwhile, Bitcoin and other cryptocurrencies are seeing a rally in their movements.
Crypto Exchange OKX Unveils Precautionary Measures Ahead of the Ethereum Merge
With the Ethereum merge just around the corner, crypto exchange OKX has given a service update that includes suspension of ETH deposits and withdrawals during the much-anticipated event.
MANTRA Tests Critical Support as OM Price Drops 3.7% Amid Broader Crypto Weakness
OM price falls to $0.12 as MANTRA technical analysis reveals bearish momentum building with RSI at 35.51 and trading below key moving averages in thin volume.
OM Price Drops to $0.12 as Bitcoin Sell-Off and Fed Rate Hike Signals Pressure MANTRA
MANTRA (OM) trades at $0.12 following a 3.3% decline as Bitcoin's drop below $110,000 and Federal Reserve hawkish signals weigh on cryptocurrency markets.
** Breaking: MANTRA Faces Critical $0.15 Support Test Amid Binance Network Changes
** MANTRA (OM) trades at $0.16 after Binance ceased ERC20/BEP20 support, creating unique positioning opportunity as RWA tokenization partnership offers bullish counterbalance.
MANTRA (OM) Price Analysis: Technical Indicators Signal Oversold Conditions Near $0.17
OM price trades at $0.17 with 0.97% daily gains, but technical indicators reveal oversold conditions as MANTRA tests critical support levels around $0.15.
MANTRA (OM) Hovers at 52-Week Low as Technical Indicators Signal Oversold Conditions
OM price trades at $0.17, matching its yearly low despite modest 1.22% daily gains. Technical analysis reveals potential reversal signals with RSI at 30.26.
MANTRA (OM) Price Drops to 52-Week Low as Oversold RSI Signals Potential Reversal
OM price hits $0.17 after -2.87% decline, marking new yearly low. Technical indicators show oversold conditions with RSI at 28.61, suggesting potential bounce opportunity.
MANTRA (OM) Price Analysis: Neutral Signals at $0.21 as RSI Shows Oversold Relief
OM price trades at $0.21 with neutral RSI at 42.92, showing potential relief from oversold conditions while key resistance looms at $0.23 level.
MANTRA (OM) Price Hovers at $0.21 as Neutral Signals Dominate Technical Landscape
OM price trades at $0.21 with mixed technical signals as MANTRA faces key resistance at $0.23 while RSI remains neutral at 43.68 amid limited market catalysts.
MANTRA (OM) Price Consolidates at $0.21 as Technical Indicators Signal Neutral Territory
OM price trades at $0.21 with mixed technical signals. MANTRA's RSI sits in neutral zone while MACD shows potential bullish momentum despite recent -0.60% decline.
MANTRA (OM) Holds $0.22 Support as Technical Indicators Show Mixed Signals
OM price maintains $0.22 level with 5.79% daily gains amid neutral RSI and bullish MACD momentum, approaching key resistance at $0.23 Bollinger Band.
MANTRA (OM) Drops 7% After Binance Network Support Halt - Technical Recovery Signals Emerge
OM price trades at $0.21 with early bullish momentum despite Binance's network support discontinuation announcement causing a 7% decline this week.
MANTRA (OM) Price Shows Modest Recovery at $0.21 Amid Neutral Market Signals
OM price currently trades at $0.21 with a 3.34% daily gain, but technical indicators suggest consolidation phase as MANTRA faces key resistance levels ahead.
MANTRA (OM) Drops 5% as Technical Indicators Signal Neutral Territory
OM price falls to $0.21 with bearish momentum, but MACD histogram shows potential bullish divergence as key support holds at $0.19 level.
MANTRA (OM) Price Faces Headwinds at $0.22 as Technical Indicators Signal Mixed Outlook
OM price drops 3.03% to $0.22 amid neutral technical signals, with MANTRA trading near key pivot levels as momentum indicators show conflicting signals for traders.
MANTRA (OM) Price Surges 4.7% as Technical Indicators Signal Potential Breakout
OM price hits $0.23 with 4.7% daily gains as MACD histogram turns bullish and stochastic indicators reach overbought territory, suggesting momentum shift.
MANTRA (OM) Hovers Near Support at $0.21 as Technical Indicators Show Mixed Signals
OM price currently sits at $0.21, up 0.80% in 24h, with RSI at 44 showing neutral momentum while MACD histogram suggests emerging bullish divergence for MANTRA.
MANTRA (OM) Shows Bullish Momentum Despite Trading Near Year Lows at $0.22
OM price gains 3.18% to $0.22 as technical indicators suggest potential reversal from oversold conditions, though challenges remain below key resistance.
MANTRA (OM) Holds Above Support at $0.21 Despite 2.3% Daily Decline
OM price trades at $0.21 after a 2.31% drop, but technical indicators suggest potential bullish momentum as MANTRA approaches key support levels.
MANTRA (OM) Consolidates at $0.21 as Institutional Momentum Battles Technical Headwinds
OM price holds steady at $0.21 (+3.12% today) as recent 27.9% institutional surge faces resistance at key technical levels amid mixed signals.
MANTRA (OM) Consolidates at $0.21 as UAE Partnership Impact Fades
OM price trades at $0.21 with bearish technical signals emerging despite recent UAE banking partnership driving 8% weekly gains before pullback to support.
MANTRA (OM) Price Consolidates at $0.20 Despite Recent 27% Rally - Technical Analysis
OM price holds critical $0.20 support level with bearish MACD signals challenging bullish momentum from institutional RWA adoption interest.
MANTRA (OM) Shows Mixed Signals as OM Price Battles Key Support at $0.21
OM price currently at $0.21 with 4.33% daily gains, but technical indicators reveal conflicting signals as MANTRA tests critical support levels.
MANTRA (OM) Price Consolidates at $0.20 as Bearish Signals Challenge Recent Rally
OM price holds critical $0.20 support despite 8% weekly gains, with technical indicators showing mixed signals after $25M buyback announcement.
MANTRA (OM) Tests Critical Support at $0.20 Despite 8% Rally This Week
OM price consolidates at $0.20 after hitting weekly highs near $1.00, with bearish MACD signals challenging recent bullish momentum from strong performer status.
MANTRA (OM) Price Tests Critical Support at $0.21 as Technical Indicators Flash Mixed Signals
OM price drops 2.72% to $0.21, approaching key support levels while RSI shows neutral positioning. Technical analysis reveals critical decision point ahead.
MANTRA (OM) Battles Between $25M Buyback Boost and Technical Breakdown
OM price sits at $0.22 after mixed signals from $25M institutional buyback announcement versus broken support levels, creating key trading opportunities.
OM Price Analysis - MANTRA's RSI sits in neutral territory
Discover the top 5 altcoins for Q4 2025 gains. Analysts rank Ethereum, XRP, and MAGACOIN FINANCE among the best altcoins to buy now for strong upside potential.
MANTRA (OM) Price Analysis: $25M Buyback Program Battles Technical Headwinds
OM price sits at $0.22 despite recent $25M buyback announcement, with technical indicators showing mixed signals as MANTRA navigates key support levels.
MANTRA (OM) Price Drops 6.6% as Bears Target $0.21 Support Level
OM price trades at $0.22 after a 6.59% decline, with technical indicators showing bearish momentum as the token approaches critical support levels.
MANTRA (OM) Price Consolidates at $0.26 as Technical Indicators Signal Potential Breakout
OM price holds steady at $0.26 with 2.26% daily gains. Technical analysis reveals neutral RSI and key resistance at $0.30, setting stage for directional move.
MANTRA (OM) Price Drops 9.6% to $0.26 Despite Bullish Technical Outlook
OM price falls to $0.26 amid market volatility, but technical indicators suggest potential recovery with key support holding at $0.22 levels.
MANTRA (OM) Faces 8% Drop as Technical Indicators Show Mixed Signals
OM price currently at $0.26 after an 8.14% decline, with MANTRA technical analysis revealing neutral RSI and bullish MACD momentum despite recent selling pressure.
MANTRA (OM) Price Surges 1.94% as Bullish Technical Signals Emerge
OM price hits $0.28 with bullish MACD crossover and RSI at 56. Key resistance at $0.32 could spark further upside momentum for MANTRA traders.
MANTRA (OM) Price Hovers at $0.27 as Bulls Eye Key Resistance Break
OM price trades at $0.27 after a 3.52% decline, with MANTRA technical analysis revealing bullish momentum despite recent weakness as traders watch critical levels.
MANTRA (OM) Price Breaks Higher: Technical Analysis Shows Bullish Momentum at $0.28
OM price trades at $0.28 with +3.08% daily gains as technical indicators signal strengthening momentum and key resistance levels come into focus.
MANTRA (OM) Price Analysis: Consolidation Near $0.25 As Bears Test Support
OM price trades at $0.25 with -3.54% daily decline. Technical indicators show neutral momentum while traders eye $0.22 support level for potential reversal signals.
MANTRA (OM) Surges 9.86% as Bulls Eye $0.40 Resistance Target
OM price jumps to $0.26 with strong 9.86% daily gains, but technical analysis shows mixed signals as MANTRA approaches critical resistance levels.
MANTRA (OM) Price Analysis: Consolidation at $0.23 as Bulls and Bears Battle Key Support
OM price trades at $0.23 with neutral RSI at 43.39, testing critical support levels while MACD signals bearish momentum continues for MANTRA.
MANTRA (OM) Price Rallies 3% to $0.26 as Bulls Test Key Resistance
OM price climbs 3.01% to $0.26 in 24-hour trading, with technical indicators showing mixed signals as MANTRA approaches critical resistance levels.
MANTRA (OM) Price Drops 4.6% as Technical Indicators Signal Mixed Outlook
OM price trades at $0.25 after a 4.57% decline, with RSI at 46.34 showing neutral momentum while MACD signals bearish pressure for MANTRA traders.
ONDO Tests Lower Bollinger Band Support at $0.71 as Technical Indicators Signal Oversold Conditions
Ondo price slides to $0.71 amid broad crypto weakness, with technical analysis showing oversold RSI conditions and proximity to key Bollinger Band support levels.
ONDO Tests Lower Bollinger Band Support at $0.71 as Broader Crypto Selloff Pressures RWA Tokens
ONDO trades at $0.71 after falling 2.2% in 24 hours, testing critical lower Bollinger Band support near $0.68 as technical indicators signal oversold conditions in absence of major catalysts.
ONDO Price Bearish: Technical Indicators Flash Warning Despite 1.58% Daily Gain
ONDO trades at $0.89 with mixed signals as bearish momentum builds despite modest gains. Key support at $0.86 under pressure with RSI at 39.85 signaling potential weakness ahead.
ONDO Price Analysis: Testing Critical Support at $0.87 Amid Bearish Momentum
ONDO trades at $0.87, down 1.07% in 24 hours, as technical indicators signal oversold conditions with RSI at 37.50 and price approaching lower Bollinger Band support.
ONDO Price Falls 3.3% as Technical Indicators Flash Mixed Signals
ONDO trades at $0.90 after a 3.31% decline, with RSI at 38.73 suggesting oversold conditions while price tests critical support levels near $0.89.
ONDO Price Analysis: Bears Take Control as Token Tests $0.90 Support Zone
ONDO price drops 0.45% to $0.94 as bearish momentum builds. Technical indicators suggest further downside potential with key support at $0.89.
ONDO Price Analysis: Bullish Momentum Meets Technical Resistance at $0.94
ONDO trades at $0.94 with +2.48% daily gains as technical indicators show mixed signals between bullish trend and bearish momentum divergence.
ONDO Price Analysis: Mixed Signals Emerge as Token Trades at $1.01
ONDO price trades at $1.01 with -0.98% decline in 24h. Technical indicators show conflicting signals while strong bullish trend remains intact despite recent weakness.
ONDO Price Consolidates at $1.02 After 15% Surge - Technical Breakout Signals Emerge
ONDO trades at $1.02 (-3.2% daily) following recent 15% surge driven by tokenized asset growth. Technical indicators suggest potential breakout above $1.14 resistance.
ONDO Price Holds Above Key Support Despite Market Volatility - Technical Analysis
ONDO trades at $1.05 with strong bullish momentum indicators despite recent 0.40% decline, showing resilience above critical $0.99 support level.
ONDO Surges 6% to $1.07 as Bulls Test Critical Resistance Near $1.14
ONDO price climbs 6.09% to $1.07 with bullish momentum building. Technical indicators show potential breakout above key resistance levels as trading volume reaches $41.7M.
ONDO Price Analysis: Token Consolidates Above Key Support Despite 1.3% Daily Decline
ONDO price trades at $1.01 with mixed technical signals as the token maintains position above critical $0.97 support level while showing neutral momentum indicators.
ONDO Price Breaks Above $1.03 as Bullish Momentum Builds
Ondo (ONDO) trades at $1.03 with strong bullish signals emerging across multiple technical indicators, positioning for potential breakout above key resistance levels.
ONDO Price Analysis: Mixed Signals as Technical Indicators Show Conflicting Trends
ONDO trades at $1.03 with -2.20% daily decline despite bullish MACD signals. Technical analysis reveals key resistance at $1.14 with neutral RSI suggesting consolidation ahead.
ONDO Price Retreats 6% Despite Bullish Technical Breakout Pattern
ONDO trades at $1.05 after a 5.96% decline, testing key support following last week's 12% breakout from bullish pennant formation.
ONDO Price Surges 12% After Bullish Pennant Breakout - Technical Analysis Shows Strong Momentum
ONDO trades at $1.12 (+3.82%) following a confirmed breakout from bullish pennant pattern. Technical indicators signal continued upward momentum toward $1.14 resistance.
ONDO Price Surges 7.83% as Tokenized Assets Platform Gains Momentum
ONDO trades at $1.09 with 7.83% daily gains following platform TVL milestones and tokenized assets expansion driving bullish technical breakout.
ONDO Price Surges 7.39% to $1.02 as Tokenization Platform Gains Momentum
ONDO trades at $1.02 with strong bullish momentum following tokenized stocks launch. Technical indicators suggest potential breakout above resistance.
ONDO Price Consolidates at $0.95 as Tokenized Assets Platform Drives Mixed Signals
ONDO trades at $0.95 (+0.66% daily) with RSI neutral at 51.85 following Ondo Finance's tokenized U.S. stocks launch, creating consolidation pattern.
ONDO Price Climbs to $0.93 as Tokenized Assets Platform Shows Mixed Technical Signals
ONDO trades at $0.93 (+2.25%) following Global Markets launch, but technical indicators suggest consolidation ahead with key resistance at $1.03.
ONDO Price Consolidates at $0.91 as Ethereum Tokenization Platform Launches
ONDO trades at $0.91 (+0.82%) following Ondo Finance's launch of 100+ tokenized U.S. stocks on Ethereum, with technical indicators showing mixed signals.
ONDO Price Consolidates at $0.90 as Tokenized Assets Platform Gains Momentum
ONDO trades at $0.90 (-1.05% daily) with RSI at 45, showing neutral momentum despite recent tokenized stocks launch boosting platform adoption prospects.
ONDO Price Holds $0.93 Despite Mixed Technical Signals and Whale Accumulation
ONDO trades at $0.93 with slight daily gains as whale accumulation provides support, though technical indicators show conflicting bullish and bearish signals.
ONDO Price Analysis: Key Support Test at $0.86 as RSI Signals Oversold Territory
ONDO trades at $0.92 (-4.04% daily) approaching critical support levels with RSI at 47, signaling potential bounce opportunity for swing traders.
ONDO Price Surges 7.5% as Bulls Target $1.04 Resistance Level
ONDO trades at $0.97 with +7.51% daily gains as technical indicators signal neutral momentum while bulls eye key resistance at $1.04.
ONDO Price Analysis: Token Holds Above Support Despite Mixed Technical Signals
ONDO trades at $0.92 with 3.84% daily gains, showing resilience near key support levels while technical indicators present conflicting signals for traders.
ONDO Price Analysis: Consolidation Pattern Hints at Potential 40-50% Breakout Above $1.20
ONDO trades at $0.91 (-0.93% in 24h) within key consolidation zone, with technical indicators suggesting potential bullish momentum if resistance breaks.
ONDO Price Analysis: Token Tests Support at $0.92 Amid Neutral Market Conditions
ONDO trades at $0.92 with 0.46% daily gains. Neutral RSI and bearish MACD suggest consolidation phase as token approaches key support levels.
ONDO Price Falls to $0.90 as Bears Test Critical Support Levels
ONDO trades at $0.90 (-0.46% daily) near Bollinger Band support with RSI showing neutral signals amid bearish momentum indicators.
ONDO Price Drops 3.7% as Technical Indicators Flash Mixed Signals
ONDO trades at $0.91 after declining 3.69% in 24 hours, with RSI at 44.41 suggesting neutral momentum while price approaches key support levels near $0.88.
ONDO Price Drops 1.36% as Technical Indicators Signal Mixed Momentum
ONDO trades at $0.93 after declining 1.36% in 24 hours, with RSI at 46.84 showing neutral momentum while MACD signals bearish pressure ahead.
ONDO Price Surges 3.68% as Bulls Target $1.17 Resistance
ONDO trades at $1.02 after a 3.68% daily gain, with technical indicators showing strong bullish momentum despite minor MACD divergence concerns.
ONDO Price Dips 8% Despite Robinhood Listing Momentum - Technical Analysis Points to Key Levels
ONDO trades at $1.02 after a -7.93% pullback, but technical indicators suggest bullish momentum remains intact following the recent Robinhood listing surge.
ONDO Price Surges 7.39% as Technical Indicators Flash Bullish Signals
ONDO trades at $1.07 with strong momentum as RSI hits 60.95 and price approaches upper Bollinger Band resistance near $1.10 resistance zone.
ONDO Price Falls 3.7% Despite Robinhood Listing Boost - Technical Analysis Shows Mixed Signals
ONDO trades at $0.98 after declining 3.7% in 24 hours, despite recent Robinhood listing catalyst driving earlier gains and bullish analyst predictions.
ONDO Price Surges Past $1.02 as Strong Bullish Momentum Builds
Ondo (ONDO) trades at $1.02 with +0.79% daily gains, showing strong bullish technical signals across multiple indicators as momentum builds toward resistance levels.
ONDO Price Analysis: Token Shows Resilience Above $1 Despite Market Correction
ONDO price holds at $1.01 (-3.96% daily) with bullish technical momentum emerging despite broader market weakness, presenting strategic entry opportunities.
ONDO Price Surges 2.22% as Bullish Technical Signals Strengthen
Ondo (ONDO) trades at $1.04 with strong bullish momentum as technical indicators align for potential upside breakout above key resistance levels.
ONDO Price Hovers at $0.94 as Mixed Technical Signals Challenge August Bullish Predictions
ONDO trades at $0.94 (+1.74% daily) with neutral RSI at 49.64, creating uncertainty despite analyst predictions of explosive August growth following recent strategic developments.
ONDO Price Analysis: Mixed Signals as August Explosive Growth Predictions Face Technical Headwinds
ONDO trades at $0.92 (-1.90% daily) as bullish analyst forecasts clash with neutral RSI and bearish momentum indicators on Binance spot markets.
ONDO Price Retreats to $0.93 Despite Major ETF Filing and SEC Progress
ONDO trades at $0.93 (+2.53% daily) as technical indicators show mixed signals following 21Shares' spot ETF filing and positive SEC regulatory developments.
ONDO Price Surges 8% After ETF Filing Despite Technical Consolidation at $0.90
ONDO trades at $0.90 (+1.21% today) following 21Shares' spot ETF filing and Binance.US listing, but technical indicators suggest mixed signals ahead.
ONDO Price Drops 7.5% to $0.89 Despite Bullish Market Sentiment and USDY Launch
ONDO trades at $0.89 after a 7.5% decline, testing key support levels while technical indicators show mixed signals amid recent positive developments.
ONDO Price Surges 2.87% as ETF Filing Momentum Continues to Drive Bullish Action
ONDO trades at $0.98 with 2.87% daily gains as 21Shares ETF filing and Binance.US listing fuel continued bullish momentum in the tokenized asset space.
ONDO Price Retreats to $0.94 Despite ETF Filing and Binance.US Listing
Ondo (ONDO) trades at $0.94 after a 5% daily decline, testing key support levels despite recent positive catalysts including 21Shares ETF filing and Binance.US listing.
ONDO Price Analysis: Bullish Breakout Despite 4.89% Daily Decline
ONDO trades at $1.01 after 4.89% decline, but technical indicators show overall bullish trend remains intact amid ETF filing momentum and key resistance at $1.17.
ONDO Price Dips 6.2% Despite ETF Filing Momentum - Technical Analysis Shows Mixed Signals
ONDO trades at $1.00 after a 6.22% decline, pulling back from recent highs driven by 21Shares ETF filing and Binance.US listing despite strong bullish fundamentals.
ONDO Breaks $1 Barrier Following SEC Meeting as ETF Filing Sparks Institutional Interest
ONDO price surged past $1 following regulatory clarity from SEC meeting, while 21Shares ETF filing signals growing institutional adoption for real-world asset tokenization.
ONDO Price Surges 5.12% as 21Shares Files Spot ETF Application with SEC
ONDO trades at $1.04 after gaining 5.12% in 24 hours following major ETF filing and Binance.US listing announcement, with technical indicators showing bullish momentum.
ONDO Surges 4.49% Following Binance.US Listing and ETF Filing News
ONDO price climbs to $1.05 with strong bullish momentum as 21Shares files for spot ETF and Binance.US adds trading support for the real-world asset token.
ONDO Price Surges 1.36% as Technical Indicators Flash Overbought Warning
Ondo (ONDO) trades at $1.07 with RSI hitting 74.89, signaling potential pullback despite strong bullish momentum continuing across all timeframes.
ONDO Price Surges 3.43% to $1.07 as Bulls Target $1.09 Resistance
ONDO price climbs to $1.07 with strong bullish momentum, but RSI at 74.83 signals overbought conditions as traders eye key resistance at $1.09.
OP Price Prediction: Targeting $0.37-$0.42 Recovery Within 4 Weeks Despite Current Consolidation
OP price prediction suggests a potential 19-35% upside to $0.37-$0.42 range over the next month, contingent on breaking $0.35 resistance with current RSI neutrality.
OP Price Prediction: Targeting $0.38-$0.49 Rally Over Next 30 Days
Optimism (OP) shows bullish momentum signals with MACD histogram turning positive. Technical analysis points to $0.38 medium-term target with potential extension to $0.49.
OP Price Prediction: Targeting $0.37-$0.42 Range Within 4-6 Weeks Amid Mixed Technical Signals
OP price prediction shows potential 16-31% upside to $0.37-$0.42 range over next month, with critical support at $0.29 and key resistance at $0.37 determining direction.
OP Price Prediction: Targeting $0.37-$0.42 Range Within 4 Weeks Amid Technical Recovery
OP price prediction suggests a move to $0.37-$0.42 over the next month as technical indicators show early bullish momentum despite mixed analyst sentiment.
OP Price Prediction: Target $0.24-$0.37 Range as Technical Indicators Signal Mixed Outlook Through December 2025
OP price prediction points to $0.24-$0.37 trading range over next 2-4 weeks, with current technical analysis showing weak bullish momentum despite bearish analyst consensus.
OP Price Prediction: Targeting $0.37-$0.42 Recovery by January 2025 Despite Near-Term Downside Risk
OP price prediction shows mixed signals with potential recovery to $0.37-$0.42 range by January 2025, though immediate risk of decline to $0.24 support exists in coming weeks.
OP Price Prediction: Targeting $0.37 Recovery Amid Mixed Signals - December 2025 Forecast
OP price prediction suggests potential 16% upside to $0.37 resistance, though bearish analysts warn of possible decline to $0.24 support within 2-4 weeks.
OP Price Prediction: Targeting $0.24 in December 2025 Amid Bearish Technical Setup
OP price prediction points to $0.24 target within 2-4 weeks as technical indicators align with analyst forecasts showing 17% downside from current $0.29 levels.
OP Price Prediction: Optimism Eyes $0.42 Recovery Despite Current Bearish Pressure - December 2025 Forecast
OP price prediction targets $0.42 medium-term recovery if $0.37 resistance breaks, though short-term risks persist with support at $0.29 critical for bulls.
OP Price Prediction: $0.42 Target by December 2025 as Technical Indicators Show Mixed Signals
Optimism (OP) faces critical resistance at $0.37 with analyst targets ranging from $0.29 to $0.46. Current technical setup suggests potential 24% upside if key levels break.
OP Price Prediction: Targeting $0.42-$0.46 by December 2025 Despite Mixed Signals
OP price prediction shows potential 24-41% upside to $0.42-$0.46 range by December 2025, with critical resistance at $0.37 and key support holding at $0.29.
OP Price Prediction: Targeting $0.42-$0.46 by December 2025 Despite Near-Term Consolidation
OP price prediction shows consolidation around $0.32 with medium-term bullish targets of $0.42-$0.46 by December 2025, though $0.29 support remains critical for bulls.
OP Price Prediction: Targeting $0.42-$0.46 Recovery by December 2025 Despite Near-Term Bearish Pressure
OP price prediction shows potential 40-53% upside to $0.42-$0.46 by December 2025, though short-term weakness may test $0.29 support first.
OP Price Prediction: Targeting $0.42-$0.46 Recovery by December 2025 Despite Current Oversold Conditions
OP price prediction indicates potential 35-48% upside to $0.42-$0.46 target zone by December 2025, with current oversold RSI and proximity to 52-week lows creating opportunity.
OP Price Prediction: Targeting $0.42-0.46 Break Above Key Resistance in Next 2-4 Weeks
Optimism forecast shows potential 17-28% upside to $0.42-0.46 resistance zone, with bullish MACD momentum despite current consolidation below $0.40 level.
OP Price Prediction: Targeting $0.46 Recovery Within 30 Days Despite Current Weakness
OP price prediction suggests potential recovery to $0.46 resistance level within 30 days, though immediate downside to $0.32 support remains possible before bullish momentum returns.
OP Price Prediction: Targeting $0.46 Resistance Break for 25% Upside by December 2025
Our OP price prediction targets $0.46 immediate resistance for short-term gains, with Optimism forecast showing potential for $0.55-$0.60 range by year-end despite current bearish sentiment.
OP Price Prediction: Testing $0.32 Support Before Potential Recovery to $0.45 Range
OP price prediction suggests testing key $0.32 support level in coming weeks, with potential recovery to $0.42-$0.45 range if bullish divergence signals confirm.
OP Price Prediction: Targeting $0.42-$0.45 Recovery Within 2 Weeks Despite Current Weakness
OP price prediction suggests potential recovery to $0.42-$0.45 range within two weeks, despite current bearish momentum, as MACD histogram shows early bullish divergence signals.
OP Price Prediction: Targeting $0.55-0.65 Range by December 2025 Amid Technical Recovery
Optimism shows bullish momentum signals with MACD turning positive. OP price prediction targets $0.55-0.65 by year-end, requiring break above $0.48 resistance.
OP Price Prediction: Targeting $0.48 Resistance with 17% Upside Potential in Next 2 Weeks
OP price prediction points to $0.48 target within 2 weeks as technical indicators show bullish momentum despite recent weakness, with critical $0.35 support holding firm.
OP Price Prediction: Targeting $0.48-0.83 Range Despite Mixed Analyst Forecasts for November 2025
OP price prediction shows potential rally to $0.48-0.83 despite bearish analyst calls. Technical analysis reveals bullish MACD momentum supporting upside targets.
OP Price Tests Critical $0.44 Support as Technical Indicators Signal Oversold Conditions
Optimism trades at $0.44 down 3.5% as OP price finds support near 52-week lows while RSI suggests potential bounce ahead amid broader crypto weakness.
OP Price Holds $0.42 as SEC Innovation Exemption Plan Boosts Layer-2 Sentiment
Optimism trades at $0.42 with modest 0.8% gains as SEC's planned innovation exemption framework and S&P's new digital markets index signal growing institutional acceptance of L2 solutions.
OP Consolidates Near $0.66 as Major Token Unlock Creates Selling Pressure
Optimism trades at $0.66 following a significant 116 million token unlock that increased circulating supply by 6.89%, creating downward momentum despite firm open interest.
Breaking: Optimism Trades at $0.68 as 116M Token Unlock Creates Mixed Signals
OP price holds $0.68 after recent token unlock pressure, while upcoming Superchain upgrade and ecosystem funding signal potential reversal ahead.
Optimism (OP) Price Analysis: Testing Critical Support at $0.66 After Token Unlock Impact
OP trades at $0.66 (-1.69% daily) near crucial support levels as markets digest the impact of 116M token unlock that triggered an 11.82% decline earlier this week.
Optimism (OP) Price Drops to $0.67 After 116M Token Unlock Event
OP trades at $0.67 (-4.21% in 24h) following massive token unlock that triggered 11.82% weekly decline, with technical indicators showing oversold conditions.
Optimism (OP) Faces Selling Pressure After 116M Token Unlock Despite Firm Open Interest
OP trades at $0.71 (+0.54%) as recent token unlock creates bearish momentum while technical indicators show oversold conditions with potential bounce opportunity.
OP Price Tests Critical Support at $0.71 as Bearish Momentum Builds
Optimism (OP) trades at $0.71 after a 0.94% decline, with technical indicators suggesting further downside pressure as OP RSI sits in neutral territory.
Optimism (OP) Faces Key Test at $0.71 as Bearish Momentum Builds
OP trades at $0.71 after a sharp 12% decline, testing critical support levels as technical indicators signal weakening momentum despite recent positive news.
Optimism (OP) Tests Critical $0.82 Resistance After 7% Rally - Bullish Breakout Ahead?
OP trades at $0.82 (+1.61% today) after forming rounded bottom pattern. Technical indicators signal potential breakout above key resistance zone.
Optimism (OP) Tests Key Resistance at $0.82 After 7% Rally - Technical Breakout Imminent?
OP price currently trades at $0.81 (-3.10% today) after forming bullish rounded bottom pattern, with critical resistance at $0.82-$0.85 determining next major move.
Optimism (OP) Breaks Above Key Resistance as Bullish Momentum Builds
OP price surges 2.40% to $0.83, breaking above multiple moving averages with strong technical indicators signaling continued upward momentum ahead.
** Optimism (OP) Breaks Above $0.82 as Bullish Momentum Accelerates
** OP price surges 6.56% to $0.82, trading 30% above predictions as technical indicators flash strong bullish signals with RSI at 59 and MACD turning positive.
Optimism (OP) Shows Strong Bullish Momentum as Price Climbs Above Key Moving Averages
OP price trades at $0.77 with 1.06% daily gains, breaking above major moving averages while technical indicators signal continued upward momentum for traders.
Optimism (OP) Shows Strong Bullish Momentum as Price Holds Above Key Support Levels
OP price trades at $0.76 with 3.65% daily gains, technical indicators signal continued bullish momentum with MACD showing positive divergence across all timeframes.
Optimism (OP) Price Shows Mixed Signals Despite 6.25% Daily Drop
OP price falls to $0.75 amid 6.25% decline, but technical indicators suggest underlying bullish momentum remains intact with MACD showing positive divergence.
Optimism (OP) Tests $0.84 Resistance as Technical Indicators Flash Mixed Signals
OP price sits at $0.80 after a 2.53% decline, with bullish momentum indicators conflicting with immediate resistance at $0.84 as traders watch key support levels.
Optimism (OP) Surges 7.36% as Bulls Target $0.88 Resistance Level
OP price climbs to $0.83 with strong bullish momentum as technical indicators signal potential breakout above key resistance levels in the near term.
Optimism (OP) Price Hovers Near $0.77 as Technical Indicators Signal Mixed Momentum
OP price trades at $0.77 with -0.68% decline in 24h. Optimism technical analysis reveals bullish MACD divergence despite neutral RSI readings and key resistance at $0.82.
Optimism (OP) Breaks Above Key Moving Averages - Bulls Target $0.83 Resistance
OP price surges 2.87% to $0.78, breaking above all major moving averages with bullish MACD momentum pointing toward immediate resistance at $0.83.
Optimism (OP) Eyes $0.88 Rally as Bullish Momentum Builds Above Key Support
OP trades at $0.77 (+4% today) with bullish MACD signals and strong momentum indicators pointing toward potential $0.88 breakout within weeks.
Optimism (OP) Price Hovers at $0.73 as Granite Upgrade Approaches
OP trades at $0.73 with neutral momentum ahead of September 11th network upgrade. Technical indicators suggest potential breakout above $0.83 resistance level.
Optimism (OP) Consolidates at $0.72 as Technical Indicators Signal Neutral Momentum
OP price holds steady at $0.72 with neutral RSI at 50.19, while traders watch key support at $0.65 and resistance at $0.83 for next directional move.
Optimism (OP) Price Drops 16% After Major Token Unlock - Technical Analysis Shows Mixed Signals
Optimism (OP) trades at $0.71 following a 31.34 million token unlock that triggered a sharp selloff, while technical indicators remain neutral.
Optimism (OP) Price Analysis: Neutral Territory at $0.71 as Technical Indicators Show Mixed Signals
OP trades at $0.71 with 0.84% daily gains. RSI sits neutral at 49.25 while MACD signals bearish momentum. Key resistance at $0.83 tests bulls' resolve.
Optimism (OP) Tests Key Support at $0.70 as Bearish Momentum Builds
OP price dropped 1.39% to $0.70 amid neutral RSI and bearish MACD signals, testing critical support levels with immediate downside risk to $0.65.
Optimism (OP) Price Analysis: Neutral Momentum at $0.72 as Indicators Show Mixed Signals
OP price sits at $0.72 (+3.03%) with RSI neutral at 49.87, while MACD signals bearish momentum despite recent gains on Binance spot trading.
OP Price Falls 1.86% as Optimism Tests Critical Support at $0.65
Optimism (OP) trades at $0.69 with bearish momentum signals emerging as price approaches key support levels amid neutral market conditions.
Optimism (OP) Struggles Below Key Support as Bears Take Control
OP price drops 1.87% to $0.69, trading below all major moving averages with bearish MACD signaling potential further downside ahead.
OP Price Analysis: Optimism Tests Critical Support at $0.71 Amid Bearish Momentum
OP price trades at $0.71 (-1.37% in 24h) as technical indicators signal potential breakdown below key support levels with MACD showing bearish divergence.
Optimism (OP) Faces Technical Pressure as Price Tests Support at $0.70
OP price drops 0.28% to $0.70, testing crucial support levels as bearish momentum indicators signal potential weakness ahead.
Optimism (OP) Price Drops 2.34% as Bears Test $0.68 Support Level
OP price trades at $0.70 after declining 2.34% in 24 hours, with technical indicators showing neutral momentum as traders watch key support at $0.68
Optimism (OP) Struggles Below Key Moving Averages as Bearish Momentum Builds
OP price sits at $0.72, trading below most major moving averages while technical indicators signal neutral to bearish momentum in the near term.
Optimism (OP) Surges 7% as Bulls Eye $0.88 Resistance Level
OP price jumps to $0.77 with 7.06% daily gains as technical indicators show bullish momentum building toward key resistance at $0.88.
Optimism (OP) Faces Correction After Testing $0.88 Resistance - Technical Analysis Shows Mixed Signals
OP price drops 10.81% to $0.76 despite recent Season 8 momentum, as technical indicators suggest potential consolidation phase ahead for Optimism traders.
Optimism (OP) Surges 7.4% to $0.85 as Technical Indicators Flash Bullish Signals
OP price jumps to $0.85 with strong momentum indicators suggesting potential breakout above key resistance at $0.88 as Optimism technical analysis turns bullish.
Optimism (OP) Price Rallies 2.37% as Technical Indicators Flash Bullish Signals
OP trades at $0.78 with bullish momentum emerging. Technical analysis reveals key resistance at $0.87 while RSI suggests room for further upside movement.
Optimism (OP) Tests Key Resistance at $0.75 After 66% Surge Cools Down
OP price retreats 5.18% to $0.75 as profit-taking emerges following last week's explosive 66% rally driven by protocol upgrades and massive token burns.
Optimism (OP) Maintains Bullish Momentum Above $0.79 Following 66% Surge
OP price holds steady at $0.79 with +2.73% gains as technical indicators show bullish momentum following major protocol upgrades and massive token burn events.
OP Price Analysis: Optimism Shows Mixed Signals as Technical Indicators Diverge
OP trades at $0.77 with -3.40% daily decline despite bullish MACD signals. Technical analysis reveals key resistance at $0.87 challenging further upside momentum.
OP Price Surges 11% to $0.80 as Optimism Season 8 Launch Drives Technical Breakout
OP rallies to $0.80 with 10.99% gains following Season 8 launch, breaking above key resistance levels as bullish momentum indicators strengthen.
Optimism (OP) Breaks Above $0.70 as Technical Indicators Show Mixed Signals
OP price surges 7.60% to $0.72 following Season 8 launch, but MACD histogram signals potential bearish momentum ahead for Optimism traders.
Optimism (OP) Surges 3.89% as Upbit Listing Fuels Trading Volume Spike
OP trades at $0.67 with 3.89% daily gains following Upbit exchange listing. Technical indicators show mixed signals as price approaches key resistance levels.
Optimism (OP) Breaks Above $0.67 as Technical Indicators Signal Mixed Momentum
OP price surges 3.89% to $0.67 despite bearish MACD signals, with RSI at neutral 47.76 suggesting potential for further upside if key resistance breaks.
Optimism (OP) Price Struggles Below Key Moving Averages as Bearish Momentum Builds
OP price trades at $0.64, down from recent highs as technical indicators signal weakening momentum. Key support at $0.61 under pressure.
OP Price Holds $0.64 Support as Optimism Season 8 Launches Amid Mixed Technical Signals
OP trades at $0.64 (-2.14% daily) while technical indicators show conflicting signals despite positive Season 8 launch news for the Optimism ecosystem.
OP Price Drops 7.4% Despite Optimism Season 8 Launch: Technical Analysis Shows Mixed Signals
OP trades at $0.66 after declining 7.45% in 24 hours, even as Optimism launches Season 8 security upgrades. Technical indicators suggest potential bounce from support.
Optimism Price Analysis: OP Consolidates at $0.72 Amid Neutral Technical Signals
OP price trades at $0.72 with minimal daily movement as technical indicators show mixed signals. RSI neutral at 54.41 while MACD suggests weakening momentum.
Optimism (OP) Price Plunges 8.6% as Market Correction Intensifies
OP trades at $0.69 after sharp decline from recent highs, with technical indicators suggesting further weakness despite Upbit listing boost
Optimism (OP) Tests Key Resistance at $0.87 Despite Recent Upbit Listing Surge
OP trades at $0.78 (-3.09% today) after yesterday's Upbit listing sparked 10-15% gains, now facing critical resistance levels with RSI at 64.78 signaling potential reversal.
Optimism (OP) Surges 13% as Upbit Listing Sparks Bullish Momentum
OP price rallies to $0.76 with 3.96% daily gains following Upbit exchange listing, though technical indicators suggest mixed signals ahead.
Optimism (OP) Faces Bearish Momentum After $0.80 Correction - Key Support Levels in Focus
OP trades at $0.72 (+0.28%) after sharp correction from $0.80. Bearish MACD divergence and key support tests signal potential downside ahead for traders.
Optimism (OP) Rebounds 7.86% to $0.73 Despite Recent Bearish Pressure
OP trades at $0.73 with 7.86% daily gains, showing recovery signs despite technical weakness and upcoming token unlock concerns affecting trader sentiment.
Optimism (OP) Price Struggles Below $0.70 as Bearish Momentum Intensifies
OP trades at $0.68 (-3.01% in 24h) as technical indicators signal continued weakness despite recent late-day breakout attempts failing to sustain momentum.
Optimism (OP) Price Hovers at $0.71 as Major Token Unlock Looms Next Week
OP trades at $0.71 (+1.43% today) with mixed signals as whale accumulation battles upcoming 31M token unlock pressure on July 31st.
Optimism (OP) Surges to $0.81 as Layer-2 Adoption Drives Bullish Momentum
OP trades at $0.81 (+2.54% daily) after strategic partnerships fuel 25% weekly surge, but technical indicators signal potential overbought conditions ahead.
Optimism Surges Past $0.79 as OP RSI Signals Overbought Territory Amid Layer-2 Adoption Boom
OP price hits $0.79 with 25% weekly gains driven by Polygon partnership and Layer-2 surge, but technical indicators warn of potential pullback risks.
Optimism (OP) Breaks $0.70 Resistance, Targets New Highs After SuperStacks XP Redemption Launch
OP surges past key resistance levels with strong momentum indicators pointing to $0.80+ targets as SuperStacks XP redemption drives increased trading activity.
Optimism (OP) Soars Above $0.75 Following Strategic Partnerships and Layer-2 Adoption Surge - July 2025 Analysis
Optimism breaks key resistance levels, surging 25% this week on Layer-2 adoption and Polygon partnership, with technical indicators pointing to $0.80 target.
Optimism (OP) Price Analysis: Recent Rally, Resistance at $0.71, and Future Outlook
Optimism (OP) surged 17% this week, driven by bullish momentum and DeFi interest, but resistance at $0.71 triggered bearish consolidation. Explore key insights and future trends.
Optimism (OP) Price Analysis: Recent Developments and Technical Insights for July 2025
Optimism (OP) faces mixed market sentiment amid whale accumulation, resistance at $0.71, and SuperStacks XP redemption. Learn about key price levels, trends, and trading strategies.
Optimism (OP) Market Update: SuperStacks Launch, Whale Activity, and Price Outlook
Optimism (OP) faces mixed market sentiment, driven by whale activity, partnerships, and SuperStacks XP redemption. Explore key price levels, risks, and trading signals.
Optimism (OP) Gains Momentum Amid Whale Accumulation and Strategic Partnerships
Optimism (OP) sees bullish momentum fueled by whale accumulation, a Polygon partnership, and increased Layer-2 adoption. Weak but promising technical signals suggest further gains.
Optimism (OP) Surges 25%: Market Trends, Technical Insights, and Price Predictions
Optimism (OP) gained 25% this week, driven by Layer-2 adoption, a Polygon partnership, and strong bullish momentum. Discover OP's price outlook and trading strategies.
Optimism (OP) Surges Amid Positive Market Sentiment: Key Developments and Outlook
Optimism (OP) rallies with a 25% surge fueled by Layer-2 adoption and strategic partnerships. Technical indicators signal further bullish potential as trading activity intensifies.
Optimism (OP) Price Analysis and Forecast: Is a Breakout on the Horizon?
Optimism (OP) surges 6.67% in 24 hours, trading at $0.59. Backed by strong momentum indicators and recent developments, traders eye $0.62 resistance for short-term gains.
PEPE Price Prediction: Targeting $0.000035 by Year-End Amid Mixed Technical Signals
PEPE price prediction shows potential bounce to $0.000035 resistance despite current bearish sentiment, with key support at $0.0000033 critical for bulls.
PEPE Price Prediction: Consolidation Phase Expected Before Potential 35% Rally to $0.0000097
PEPE price prediction targets $0.0000097 medium-term if critical support holds, with short-term consolidation around $0.000005 expected in coming weeks.
PEPE Price Prediction: Meme Coin Eyes $0.000034 Recovery Despite Bearish Headwinds Through December 2025
PEPE price prediction shows potential recovery to $0.000034 despite current bearish sentiment, with technical analysis revealing mixed signals for the popular meme coin.
PEPE Price Prediction: Target $0.0000065 by January 2026 as Meme Coin Eyes 45% Rally
PEPE price prediction suggests consolidation near $0.000004096 before potential breakout to $0.0000065. Technical analysis shows neutral RSI with emerging bullish momentum signals.
PEPE Price Prediction: Targeting $0.0000065 Recovery Despite Near-Term Consolidation Through December 2025
PEPE price prediction shows mixed signals with short-term consolidation expected around $0.000004096 before potential 45% rally to $0.0000065 target by January 2026.
PEPE Price Prediction: Consolidation Expected at $0.000005 Before Potential 30% Rally to $0.0000065
PEPE price prediction targets consolidation around $0.000005 support over next week, with analysts forecasting potential recovery to $0.0000065 by year-end if technical breakout occurs.
PEPE Price Prediction: Target $0.000049 by December 5th Amid Mixed Technical Signals
PEPE price prediction shows potential rebound to $0.000049 short-term despite bearish analyst consensus, with critical support at $0.00003160 determining direction.
PEPE Price Prediction: Bearish Momentum Points to $0.0000034 Target Within 7 Days
PEPE price prediction shows bearish bias with analysts targeting $0.0000034 short-term. Mixed signals from RSI neutral zone vs bullish MACD create trading opportunity.
PEPE Price Prediction: Recovery to $0.0000062 Expected as Oversold Conditions Signal Bounce Opportunity
PEPE price prediction targets $0.0000062 within 30 days as RSI at 29.03 indicates severely oversold conditions, with analysts forecasting recovery from current bearish momentum.
PEPE Price Prediction: Recovery to $0.000005 Target as Oversold Conditions Signal Potential Bounce
PEPE price prediction shows potential recovery to $0.000005 in the short term as RSI at 30.90 indicates oversold conditions, though bearish sentiment persists across major resistance levels.
PEPE Price Prediction: Targeting $0.000005 Recovery Within 2 Weeks as Oversold Conditions Signal Bounce
PEPE price prediction suggests a bounce to $0.000005 target within 2 weeks as RSI oversold conditions and falling wedge pattern indicate potential 15-20% upside from current levels.
PEPE Price Prediction: Targeting $0.0000065 Recovery Amid Technical Consolidation Through December 2025
PEPE price prediction suggests consolidation near $0.000005 with potential recovery to $0.0000065 target if RSI climbs above 50 and key resistance breaks.
PEPE Price Prediction: Targeting $0.0000045 Recovery Despite 70% Drop from Highs
PEPE price prediction shows mixed signals with analysts targeting $0.0000045 short-term recovery, though medium-term Pepe forecast suggests $0.0000038 retest possible.
PEPE Price Prediction: Oversold Bounce to $0.0000065 Target Within 30 Days
PEPE shows extreme oversold conditions at RSI 24.85, targeting $0.0000065 recovery within a month as technical indicators suggest potential reversal from current levels.
PEPE Price Prediction: Oversold Bounce to $0.000005 Expected Within 2 Weeks
PEPE price prediction shows potential recovery to $0.000005 target as RSI hits 26.40 oversold levels, with analysts forecasting short-term bounce despite bearish sentiment.
PEPE Price Prediction: Recovery to $0.000005 Target Expected by December 2025
PEPE price prediction suggests oversold bounce to $0.000005 short-term, with analysts targeting $0.0000043-$0.0000062 range despite current bearish momentum.
PEPE Price Prediction: Bearish Momentum Targets $0.000005 by December 2025
PEPE price prediction suggests downside to $0.000005 short-term as RSI at 30.47 and negative MACD signal bearish momentum, but long-term Pepe forecast eyes $0.00004500 by 2030.
PEPE Price Prediction: Targeting $0.0000043-$0.0000062 Recovery Zone Through December 2025
PEPE price prediction shows potential recovery to $0.0000043-$0.0000062 range despite current bearish momentum, with whale accumulation signaling possible reversal ahead.
PEPE Price Prediction: Targeting $0.000005-$0.0000065 Range Through December 2025
PEPE price prediction suggests consolidation between $0.000005-$0.0000065 with bearish bias. Technical analysis shows RSI at 32.89 in neutral zone while MACD remains negative.
PEPE Price Prediction: Targeting $0.0000067 Short-Term with Potential Rally to $0.00012 by Early 2026
PEPE price prediction shows mixed signals with short-term target of $0.0000067 while long-term Pepe forecast suggests massive 1,500% rally to $0.00012 by 2026.
PEPE Price Prediction: Targeting $0.000018 Rally as Triangle Breakout Looms
PEPE price prediction points to potential 80% upside to $0.000018 if triangle consolidation breaks higher, with key resistance at $0.000012 level.
PEPE Price Prediction: Bearish Momentum Targets $0.000004434 with 66% Decline Risk Through December 2025
PEPE price prediction shows bearish sentiment dominating with technical indicators pointing to $0.000004434 short-term target and potential 66% decline to $0.00000185.
PEPE Price Prediction: Technical Analysis Points to $0.0000048-$0.0000061 Range Through December 2025
PEPE price prediction shows mixed signals with analyst targets ranging $0.0000048-$0.0000061. RSI at 40.49 suggests potential upside despite recent bearish momentum.
PEPE Price Faces Fresh Decline as Technical Indicators Signal Continued Weakness
PEPE trading at $0.00 with a 2.1% daily decline as bearish technical indicators dominate the meme coin's outlook, with 88% of signals pointing toward further downside pressure.
PEPE Rebounds 7% Despite 40% Monthly Decline as Falling Wedge Pattern Signals Recovery
PEPE price trades at $0.00 up 7.14% today following last week's 40% decline from May highs, with technical analysts spotting bullish falling wedge formation amid Bitcoin's surge.
PEPE Consolidates Near Neutral Territory as Meme Coin Sector Awaits Fresh Catalysts
PEPE price holds steady at $0.00 with modest 0.4% decline as technical indicators suggest sideways action amid absence of major market-moving events in the meme coin space.
PEPE Drops 40% in Monthly Decline as Bitcoin Correction Triggers Meme Coin Selloff
PEPE trading at $0.00 down 1.9% daily amid broader 40% monthly decline following Bitcoin's drop below $65,000 and weakening investor confidence in altcoin markets.
Pepe Analysis: PEPE Surges 8% as Whale Accumulation Drives Market Momentum
PEPE price climbs amid significant whale activity and 111% volume spike. Technical indicators reveal mixed signals as the meme coin navigates key support levels.
PEPE Price Analysis: Meme Coin Shows Bearish Momentum Amid Technical Breakdown
PEPE trades at oversold levels with RSI at 37.10, showing bearish MACD signals and testing lower Bollinger Band support after 1.94% daily decline.
PEPE Price Analysis: Whale Activity Meets Technical Resistance at Critical Levels
PEPE trades sideways following recent whale-driven rally, with RSI at 37.46 signaling potential oversold bounce while key support levels remain untested.
PEPE Price Struggles as Technical Indicators Flash Mixed Signals
PEPE trades at current levels with bearish momentum despite overall weak bullish trend, as key technical indicators suggest potential consolidation phase ahead.
PEPE Price Analysis: Meme Coin Shows Mixed Signals as Technical Indicators Flash Warning
PEPE trades sideways with bearish momentum emerging. RSI at 40.03 suggests potential oversold conditions while volume remains robust at $110M daily.
PEPE Price Drops 7.34% as Technical Indicators Flash Mixed Signals
PEPE trades under pressure with RSI at 40.24 showing neutral momentum while Bollinger Bands suggest potential support near current levels.
PEPE Price Holds Steady Amid Neutral Market Sentiment - Technical Analysis Shows Mixed Signals
PEPE trades sideways with RSI at 48.80 in neutral territory. Technical indicators suggest consolidation phase with bullish MACD histogram providing hope for recovery.
PEPE Price Drops 3.4% as Neutral Technical Signals Suggest Consolidation Ahead
PEPE trades sideways with 3.4% daily decline, RSI at neutral 49.26 suggests potential consolidation phase for the meme coin ahead.
PEPE Price Drops 6% as Whales Accumulate Despite Market Selloff
PEPE trades at $0.0000107 after recent decline, but technical indicators show mixed signals with RSI at 53.39 and bullish MACD momentum emerging.
PEPE Price Surges 5% as Meme Coin Shows Strong Bullish Momentum
PEPE trades with 4.98% daily gains as technical indicators signal continued bullish momentum, with RSI at 57.08 and strong volume support on Binance.
PEPE Price Analysis: Bullish Momentum Builds Despite Market Volatility
PEPE shows strong bullish trend with neutral RSI at 52.16, offering potential entry opportunities as meme coin maintains steady trading volume of $130M.
PEPE Price Surges 3.39% as Bullish Technical Signals Emerge for Pepe Token
PEPE price shows strong momentum with 3.39% daily gains and bullish MACD signals, while technical indicators suggest continued upward pressure for the meme coin.
PEPE Price Drops 5.83% Despite Bullish Technical Signals - Meme Coin Analysis
PEPE trades with mixed signals as RSI holds neutral at 52.23 while MACD shows bullish momentum despite 5.83% daily decline to current levels.
PEPE Price Drops 7% as Meme Coin Tests Critical Support Levels
PEPE trades at current levels with technical indicators showing mixed signals as the popular meme coin faces key resistance near Bollinger Band upper levels.
PEPE Price Surges 15.75% as Technical Indicators Flash Bullish Signals
PEPE trades with strong momentum after 15.75% daily gains, with technical analysis showing bullish MACD and overbought conditions near resistance levels.
PEPE Price Consolidates as Bullish Momentum Builds Despite Minor Decline
PEPE trades at neutral levels with RSI at 51.52, showing early bullish momentum signals amid $77M daily volume on Binance spot markets.
PEPE Price Surges 2.85% as Indonesia Listing Boosts Legitimacy Amid 40x Breakout Predictions
PEPE trades higher at 2.85% daily gains following Indonesia's regulatory approval, while technical indicators show bullish momentum despite testing critical support levels.
PEPE Price Surges 3.74% as Bullish Momentum Builds Despite Neutral RSI
PEPE trades higher with 3.74% daily gains and $132M volume, showing bullish MACD signals while RSI remains neutral at 52.78 on Binance spot data.
PEPE Price Surges 4.2% Amid Strong Bullish Momentum Despite Technical Neutrality
PEPE price climbs 4.2% in 24 hours with $59.8M trading volume on Binance, showing mixed technical signals as RSI remains neutral at 48.90 while MACD histogram turns bullish.
PEPE Price Drops After Massive Whale Sell-Off: Technical Analysis Shows Mixed Signals
PEPE trades at current levels following a 726 billion coin whale dump. Technical indicators show neutral RSI at 45.11 while MACD suggests potential bullish momentum.
PEPE Price Analysis: Meme Coin Battles Critical Support as September Tests Begin
PEPE trades near crucial $0.0000096 support level with RSI at 42.88, showing neutral momentum as traders watch for potential 25-90% upside if support holds.
PEPE Price Analysis: Meme Coin Tests Critical Support at $0.0000096 Amid September Uncertainty
PEPE faces bearish pressure as it tests key support at $0.0000096, with mixed technical signals suggesting potential 25-90% upside if current levels hold.
PEPE Price Analysis: Meme Coin Shows Weak Bullish Signals Despite -1.83% Daily Decline
PEPE trades with bearish momentum as technical indicators reveal mixed signals. Daily RSI at 41.47 suggests potential oversold conditions developing.
PEPE Price Analysis: Meme Coin Shows Weak Bullish Momentum Despite Neutral RSI
PEPE trades with 2.41% daily gains while technical indicators signal mixed momentum. RSI at 42.47 suggests neutral territory as traders watch key levels.
PEPE Price Analysis: Mixed Signals as RSI Shows Neutral Zone Trading
PEPE trades with minimal movement as technical indicators present mixed signals, while analysts eye potential $0.000013-$0.000019 range target amid oversold conditions.
PEPE Price Analysis: Meme Coin Tests Support Amid Mixed Technical Signals
PEPE trades with bearish momentum as RSI hits 41.91, while analysts target $0.000013-$0.000019 range despite recent decline predictions.
PEPE Price Struggles Near Support as Mixed Signals Cloud September Outlook
PEPE trades with bearish momentum despite analyst predictions of 25-90% upside potential. Technical indicators show neutral RSI but concerning MACD divergence.
PEPE Price Rallies 4% Despite Weekly Volatility as Whale Accumulation Continues
PEPE trades at $0.00 with 1.13% daily gains despite recent 8% selloff. Technical indicators show mixed signals with RSI at neutral 42.05 as whale activity drives recovery.
PEPE Price Falls 3.75% as Technical Indicators Signal Mixed Outlook
PEPE trades with bearish momentum as RSI hits 40.89 and recent market volatility continues to impact meme coin sentiment across trading platforms.
PEPE Price Consolidates as RSI Shows Neutral Territory - What's Next for Pepe?
PEPE price holds steady with modest -0.40% decline as Pepe technical analysis reveals neutral RSI at 42.04 and positioning near Bollinger Band support levels.
PEPE Price Faces Mixed Signals as Technical Analysis Shows Neutral RSI Despite 4.18% Daily Drop
PEPE trades with bearish momentum despite bullish overall trend, as technical indicators paint a complex picture for the popular memecoin's near-term direction.
PEPE Price Surges 3.41% as Meme Coin Eyes $0.000017 Target Amid Technical Recovery
PEPE rebounds with 3.41% daily gains following 25% weekly recovery, as technical indicators show neutral RSI and bullish momentum building toward analyst target of $0.000017.
PEPE Price Plunges 12% Despite Recent Whale Accumulation - Technical Breakdown
PEPE trades at neutral RSI 46.30 after 12% daily decline, testing support levels despite recent whale buying activity and positive long-term sentiment signals.
PEPE Price Surges 1.3% as Technical Indicators Flash Bullish Signals
PEPE trades with modest gains while technical analysis reveals strong bullish momentum building, with key resistance levels coming into focus for traders.
PEPE Price Surges 9.17% as Bullish Momentum Builds in Meme Coin Rally
PEPE trades higher with strong bullish signals emerging from technical indicators, presenting new opportunities for cryptocurrency traders seeking momentum plays.
PEPE Price Faces 7% Drop Despite Recent Breakout Above Key Resistance
PEPE trades with 7% daily decline after breaking $0.00001230 resistance last week. Technical indicators show mixed signals as whale accumulation continues.
PEPE Price Struggles Below Key Resistance as Bulls Target Recovery
PEPE trades at $0.00001985 after -1.99% decline, but technical indicators show mixed signals with RSI neutral at 53.44 while MACD hints at potential bullish momentum.
PEPE Price Holds Above Support Despite 2% Daily Decline - Technical Analysis Shows Mixed Signals
PEPE trades with bearish momentum as price drops 2.10% in 24 hours, but technical indicators suggest potential bullish reversal ahead for the meme coin.
PEPE Price Surges 9.75% as Whale Accumulation Drives Bullish Momentum
PEPE price rallies to $0.00 with 9.75% daily gains as whale purchases 807 billion tokens worth $1 million, while technical indicators signal potential 25% upside ahead.
PEPE Price Surges 4.79% as Technical Indicators Signal Mixed Momentum
PEPE trades higher at current levels with 4.79% daily gains, while RSI at 41.02 suggests neutral territory amid bearish MACD signals for the meme coin.
PEPE Price Analysis: Meme Coin Shows Mixed Signals Despite 1.54% Daily Gain
PEPE trades with modest 1.54% gain but technical indicators reveal bearish momentum as RSI sits at 39.51 in neutral territory with key support levels being tested.
PEPE Price Faces Technical Pressure Despite Whale Accumulation and Bullish Pattern Formation
PEPE trades at oversold levels with RSI at 37.25, while recent whale purchases of 200.4B tokens and falling wedge pattern suggest potential reversal ahead.
PEPE Price Faces Critical Support Test as Technical Indicators Flash Mixed Signals
PEPE trades with modest 1.44% gains while technical analysis reveals bearish momentum and oversold conditions creating potential buying opportunity near support levels.
PEPE Price Plunges 5.25% as Technical Indicators Signal Continued Weakness
PEPE trades at critical support levels after 5.25% daily decline, with RSI at 37.78 suggesting oversold conditions may present buying opportunity for risk-tolerant traders.
PEPE Price Shows Resilience as Smart Money Accumulates Despite Market Decline
PEPE demonstrates stability with only 4% decline vs 5.7% market drop as analysts eye $0.000015-$0.000016 targets amid smart money accumulation.
PEPE Price Crashes 6% as Technical Indicators Flash Mixed Signals
PEPE drops 6% to $0.00 while RSI hits neutral territory at 41.41, creating potential buying opportunity despite bearish momentum signals from MACD indicators.
PEPE Price Drops 8.5% Despite Whale Accumulation - Technical Analysis Shows Mixed Signals
PEPE trades at $0.00 down 8.55% in 24h, creating conflicting signals as recent whale buying meets bearish momentum indicators on the PEPE/USDT pair.
PEPE Price Drops 5.48% Despite Massive Whale Accumulation of 9 Trillion Tokens
PEPE trades at current levels with 5.48% daily decline, but whale accumulation of $90M worth of tokens signals potential reversal ahead for the meme coin.
PEPE Price Surges on $90M Whale Accumulation as Double Golden Cross Signals Bullish Momentum
PEPE trading shows strong technical signals with whale accumulation of 9 trillion tokens worth $90 million, while double golden cross pattern emerges on charts.
PEPE Price Surges 5% as Open Interest Crosses $1 Billion Milestone
PEPE trades with 5% daily gains amid record $1B open interest and 300% spike in Google searches, signaling renewed meme coin momentum.
PEPE Price Drops 4.39% as Technical Indicators Flash Mixed Signals
Pepe (PEPE) faces selling pressure with neutral RSI at 48.50, while strong bullish trend remains intact despite recent decline in PEPE/USDT trading.
PEPE Price Surge: Ethereum Rally Drives 28% Monthly Gains as Bulls Target $0.000024
PEPE trades with bullish momentum after 10% daily rally, supported by whale accumulation and Ethereum's surge. Double golden cross signals potential move to $0.000024.
PEPE Price Surges 4.72% as Whale Accumulation Fuels Bullish Momentum
PEPE trades with strong gains today following massive whale purchases worth $90 million, while technical indicators flash overbought signals at key resistance levels.
PEPE Price Surges 5.2% as Technical Indicators Flash Strong Bullish Signals
PEPE gains 5.2% in 24 hours with RSI at 71.02 showing overbought conditions. Strong bullish momentum continues following July's 14% breakout rally.
Polkadot Price to Continue its Consolidation with Imminent Breakout
Just like the rest of the entire crypto market, Polkadot has been in a period of consolidation while making attempts to break out from its current levels.
Polygon MATIC Price Surges to $0.951, Driven by Major Institutional Network Adoptions
The MATIC price has grown impressively over the last week driven by the chain's adoption.
Aptos Token Price Surged over 30% following First Week of Trading
The price surge is driven by three major factors: negative funding rates, VC support, and the market's recovery.
Top Performing Cryptocurrencies to Watch This Week: BTC, ADA, SOL, XTZ, DOT, and ATOM
Besides Bitcoin, popular crypto analyst Michaël van de Poppe shares where he sees some of the biggest opportunities in altcoins this week.
Crypto Prices Remain in Red, Shina Inu Falls Over 15%
Cryptocurrencies remain to behave weakly after the weekend.
Optimizing Multi-GPU Data Analysis with RAPIDS and Dask
Explore best practices for leveraging RAPIDS and Dask in multi-GPU data analysis, addressing memory management, computing efficiency, and accelerated networking.
To Avoid a Global Recession the Fed Should Ease Interest Rate Hikes - UN Report
Caution should not be thrown to the wind when it comes to tightening fiscal and monetary policies because this could trigger a global recession, according to a UN agency report.
XRP Status Classified as Unclear, Meanwhile Analysts Say XRP Price Could Jump to $0.30
The US Commodities and Futures Trading Commission (CFTC) Chairman Heath Tarbert indicated in an interview that the status of XRP has been classified as unclear. He said, “It’s unclear. Stay tuned I’d say. Part of the issue is that our jurisdiction we share with the SEC (Securities and Exchange Commission). If it’s a security, it falls under their jurisdiction. If it’s a commodity, it falls under ours.”
Ripple XRP Continues Consolidating Its Value Above $0.6 New Support Level
Technical indicators show that XRP is likely to consolidate its price inside a range of the $0.60 support level and the 0.65 resistance level.
Ripple Pilots Private Version of XRP Ledger for CBDC Issuance
Judging from the daily candlestick chart of Ripple (XRP), the bulls are currently working hard to push XRP above the Exponential Moving Average Ribbon.
Understanding RSI: A Key Tool for Spotting Market Extremes
Explore the Relative Strength Index (RSI), a fundamental tool in technical analysis for identifying overbought and oversold market conditions, as detailed in Bitfinex's Chart Decoder Series.
Understanding RSI: Simplifying Overbought and Oversold Market Indicators
Explore the Relative Strength Index (RSI) as a tool to assess market conditions, identify overbought or oversold assets, and enhance trading strategies.
Understanding RSI: A Key Tool for Overbought and Oversold Markets
Explore how the Relative Strength Index (RSI) serves as a crucial indicator in identifying overbought and oversold market conditions, aiding traders in making informed decisions.
SHIB Price Prediction: Targeting $0.000012-$0.000016 Rally Within 4 Weeks
SHIB price prediction shows potential 25-40% upside to $0.000012-$0.000016 range as oversold conditions and bullish MACD momentum align for December rally.
SHIB Price Prediction: Target $0.000010 by Year-End 2025 Amid Bullish Technical Setup
SHIB price prediction shows potential 15-20% upside to $0.000010 target within 3 weeks, supported by neutral RSI and emerging bullish MACD momentum signals.
SHIB Price Prediction: Targeting $0.00001019 by December 31st as Technical Indicators Signal Modest Rally
SHIB price prediction suggests a potential 17% upside to $0.00001019 by year-end, supported by neutral RSI and bullish MACD momentum despite current consolidation phase.
SHIB Price Prediction: December Rally to $0.00001019 Target Despite Neutral Technicals
SHIB price prediction shows potential 17% upside to $0.00001019 by December end, with analysts targeting $0.0000085-$0.000009 range amid neutral RSI and bullish MACD momentum.
SHIB Price Prediction: Testing $0.0000085-$0.00001019 Range with December 2025 Rally Potential
SHIB price prediction shows mixed signals as analysts target $0.0000085-$0.00001019 range. Technical analysis suggests neutral momentum with December rally potential.
SHIB Price Prediction: December Rally to $0.000016 Target Despite Current Consolidation
SHIB price prediction suggests potential 40% upside to $0.000016 by month-end, with technical indicators showing bullish MACD momentum despite neutral RSI conditions.
SHIB Price Prediction: Targeting $0.000012-$0.000016 Rally as Technical Setup Improves in December 2025
SHIB price prediction points to 25-40% upside potential as oversold conditions and bullish MACD momentum align for December recovery targeting $0.000012-$0.000016.
SHIB Price Prediction: Neutral Consolidation Expected with Limited Upside Through December 2025
SHIB technical analysis shows neutral momentum with RSI at 36. Our forecast suggests sideways trading with potential 15-20% moves in either direction over the next month.
SHIB Price Prediction: Targeting $0.00001000-$0.00001139 Recovery Within 4-6 Weeks
SHIB price prediction shows potential 15-25% upside to $0.00001000-$0.00001139 as oversold RSI and bullish MACD signal possible reversal from current levels.
SHIB Price Prediction: Neutral Consolidation Phase Points to Limited Upside Through December 2025
SHIB price prediction shows muted momentum with RSI at 49.78 and minimal MACD signals, suggesting range-bound trading with modest 5-10% upside potential over next 4 weeks.
SHIB Price Prediction: Neutral Consolidation Phase with Limited Upside Potential Through December 2025
SHIB technical analysis reveals neutral momentum with RSI at 45.28. Current data limitations suggest cautious approach for Shiba Inu forecast through year-end.
SHIB Price Prediction: Targeting $0.000019 by December 2025 Amid Technical Recovery
SHIB price prediction suggests potential 127% gains to $0.000019 in the medium term, with current technical indicators showing neutral to bullish momentum despite recent consolidation.
SHIB Price Prediction: Oversold Bounce Target Could Drive 25-40% Rally in December 2025
SHIB's RSI at 28.25 signals oversold conditions. Technical analysis suggests potential bounce to retest resistance levels, targeting 25-40% upside in the coming weeks.
SHIB Price Prediction: Oversold Bounce to $0.00001139 Expected by December 2025
SHIB technical analysis shows oversold RSI at 28.75, suggesting potential rebound to $0.00001139 target within 4-6 weeks as analysts predict 15% recovery from current levels.
SHIB Price Prediction: Targeting $0.000019 by December 2025 Despite Current Bearish Momentum
SHIB price prediction analysis suggests potential recovery to $0.000019 within 4-6 weeks, though current RSI of 34.15 and bearish MACD signal near-term weakness.
SHIB Price Prediction: Targeting $0.00001 by December 2025 Despite Near-Term Weakness
SHIB price prediction analysis shows mixed signals with bearish momentum but analyst targets of $0.00001 short-term and $0.000012 long-term based on technical patterns.
SHIB Price Prediction: Targeting $0.0000193 by December 2025 Despite Current Bearish Momentum
SHIB price prediction shows mixed signals with analysts targeting $0.0000193 upside potential, though current technical indicators suggest near-term weakness to $0.00000828.
SHIB Price Prediction: Testing $0.0000095 Resistance Before Potential Rally to $0.000019 by Month-End
SHIB price prediction shows potential 15% bounce to $0.0000095 this week, with medium-term Shiba Inu forecast targeting $0.000019 range despite current bearish momentum.
SHIB Price Prediction: Bearish Target $0.00000828 as Technical Indicators Signal November Decline
SHIB price prediction points to potential 15% decline toward $0.00000828 support level as RSI remains neutral and analysts forecast bearish November trend.
SHIB Price Prediction: Targeting $0.000019 by December 2025 Amid Mixed Technical Signals
SHIB price prediction shows potential rally to $0.000019 medium-term despite neutral RSI at 48.01. Analysts eye $0.00001025 resistance break for bullish continuation.
SHIB Price Prediction: Targeting $0.0000104 by December 2025 Despite Current Consolidation
Shiba Inu technical analysis reveals neutral momentum at RSI 46.72, with analyst consensus targeting $0.0000104-$0.000019 range. Current consolidation phase may precede breakout.
SHIB Price Prediction: $0.0000091 Target Within 1 Week as Technical Indicators Show Mixed Signals
SHIB price prediction points to $0.0000091 target in the short term, with technical analysis revealing neutral momentum and key resistance at $0.00001178 level.
SHIB Technical Analysis Points to Potential $0.00002 Rally as Accumulation Signals Strengthen
Shiba Inu trades at $0.00001088 despite 2.2% daily decline, with analysts eyeing $0.00002 resistance amid growing whale activity and increased burn mechanisms driving accumulation patterns.
SHIB Holds Above $0.00 as Technical Indicators Signal Neutral Territory Despite Modest Gains
Shiba Inu trades at $0.00 with 3.75% daily gains as technical analysis reveals mixed signals with RSI at 39.57 and MACD showing bearish momentum in quiet news cycle.
SHIB Consolidates Near Lower Bollinger Band as Meme Coin Sector Lacks Catalysts
Shiba Inu trades at $0.00 with subdued 24-hour volume of $7.9M on Binance as technical indicators point to oversold conditions amid broader crypto market weakness.
SHIB Technical Analysis Points to Potential $0.00002 Breakout as Whale Activity Increases
Shiba Inu trades at $0.00 down 1.7% as technical indicators suggest accumulation phase may be setting up for October surge toward key resistance levels.
SHIB Trading Update: Neutral Zone Analysis Shows Key Support Test at $0.00
SHIB price holds steady with 1.97% daily gain as technical indicators suggest consolidation phase. RSI at 41.16 signals potential buying opportunity near current levels.
** SHIB Price Under Pressure as Technical Indicators Signal Bearish Momentum
** Shiba Inu trades with bearish signals as SHIB RSI drops to 37.94 and momentum indicators flash warning signs for traders watching key support levels.
SHIB Price Drops 2% as Technical Indicators Signal Bearish Momentum
Shiba Inu trades lower at current levels with RSI at 38.89 and MACD showing bearish signals. Key support levels remain critical for SHIB recovery.
** SHIB Price Rebounds Above $0.00001222 as Holder Base Expands to 1.5M
** Shiba Inu trades at $0.00001222 with growing holder base reaching 1,537,364. Technical indicators suggest potential breakout above key resistance levels.
SHIB Price Holds Support as Burn Rate Surges 1,431% - Technical Analysis
SHIB trades sideways with RSI at 41.03 while massive burn rate spike and ETF speculation create mixed sentiment for Shiba Inu holders.
** SHIB Price Faces Pressure Despite Recent Rally - Technical Analysis Shows Mixed Signals
** Shiba Inu trades with bearish momentum as SHIB RSI hits 40.56, testing key support levels after recent 15% surge loses steam in volatile crypto market conditions.
Shiba Inu Price Analysis: SHIB RSI Shows Neutral Signals Amid Mixed Technical Indicators
SHIB price trades flat with 0.23% gains as technical indicators show conflicting signals. RSI neutral at 49.73 while MACD suggests bearish momentum for traders.
SHIB Price Analysis: Shiba Inu Shows Neutral RSI Despite 2.19% Daily Decline
SHIB price drops 2.19% to current levels while technical indicators show mixed signals. Shiba Inu RSI remains neutral at 49.33, suggesting potential consolidation ahead.
SHIB Price Faces Mixed Signals as Cultural Boost Meets Technical Correction
Shiba Inu trades with modest decline after recent 8.49% surge, while World Athletics mascot announcement provides cultural catalyst for SHIB price momentum.
SHIB Price Holds Above Key Support as Technical Indicators Signal Potential Breakout
Shiba Inu trades with modest gains amid neutral RSI conditions and bullish MACD signals, presenting mixed technical outlook for SHIB traders.
SHIB Price Consolidation Continues as Shiba Inu Shows Neutral Technical Signals
SHIB trades sideways with neutral momentum indicators, while technical analysis reveals mixed signals for the popular meme coin's near-term direction.
SHIB Price Surges 8.49% as Technical Indicators Flash Mixed Signals
Shiba Inu trades with bullish momentum despite large holder selling pressure. SHIB RSI at 51.56 suggests neutral positioning ahead of key resistance test.
SHIB Price Analysis: Neutral RSI Signals Potential Breakout Despite 6% Daily Drop
SHIB trades with mixed signals as daily losses clash with neutral RSI at 51.66, suggesting consolidation before potential 15-20% October breakout.
SHIB Price Analysis: Bullish Momentum Emerges Despite 3.46% Daily Decline
Shiba Inu trades with mixed signals as SHIB RSI hits 62.28 in neutral territory while bullish MACD momentum suggests potential reversal ahead.
SHIB Price Surges 10.84% as Technical Indicators Flash Overbought Signals
Shiba Inu trades with strong bullish momentum despite SHIB RSI hitting 70.75, signaling potential correction ahead for traders watching key resistance levels.
SHIB Price Rebounds Testing Key Resistance as Bullish Momentum Builds
SHIB trading at higher levels with 1.92% daily gains, approaching critical 200-day EMA resistance that could trigger breakout to $0.000020-$0.000024 range.
Shiba Inu (SHIB) Shows Mixed Signals as Golden Cross Meets Death Cross in September 2025
SHIB price remains stable despite conflicting technical signals including a rare golden cross followed by death cross pattern, creating uncertainty for traders.
SHIB Price Shows Bullish Momentum as Technical Indicators Signal Potential Breakout
Shiba Inu trades with 2.43% daily gains as SHIB RSI holds neutral at 55.63 while momentum indicators suggest growing bullish pressure near resistance levels.
SHIB Price Analysis: Golden Cross Forms as Shiba Inu Eyes October Rally
SHIB trades at current levels after forming bullish golden cross. Technical indicators mixed with RSI neutral at 50.61 as traders eye October potential.
SHIB Death Cross Signals Bearish Momentum as Price Holds Above Support
Shiba Inu trades with 1.39% gains despite death cross formation. SHIB RSI at 47.83 suggests neutral momentum while technical patterns point to potential downside.
SHIB Price Analysis: Neutral Territory as Shiba Inu Faces Mixed Technical Signals
SHIB price shows bearish momentum with RSI at 45.70 in neutral zone. Technical analysis reveals conflicting signals as Shiba Inu traders await clear direction.
** SHIB Holders Refuse to Sell as Technical Indicators Show Mixed Signals
** Shiba Inu trades sideways with near-zero exchange deposits signaling strong holder conviction, while SHIB RSI at 46.37 suggests potential for directional move.
SHIB Price Stalls Despite Whale Accumulation as Technical Indicators Signal Mixed Outlook
Shiba Inu trades flat with RSI at 46.99 while whales accumulate 359.6B tokens, but declining burn rates and bearish MACD create uncertainty for SHIB traders.
SHIB Price Analysis: Meme Coin Tests Support as Bears Take Control
Shiba Inu trades with bearish momentum as SHIB RSI hits 43.51 in neutral territory. Technical indicators suggest further downside pressure for the popular meme cryptocurrency.
SHIB Price Faces Critical Support Test as Whales Accumulate 4.66 Trillion Tokens
Shiba Inu trades with mixed signals as massive whale accumulation of $64M worth of SHIB tokens contrasts with bearish technical momentum and narrow range trading.
SHIB Price Faces Mixed Signals as Technical Analysis Shows Neutral Territory
Shiba Inu trades with mild bearish pressure at -0.56% daily decline, while SHIB RSI sits in neutral zone at 46.14 amid recent volume surge catalysts.
SHIB Price Faces Mixed Signals as Whale Accumulation Counters Burn Rate Collapse
Shiba Inu trades in consolidation amid conflicting signals - massive whale accumulation of 359.6B tokens offset by 98.89% burn rate decline, creating uncertainty for SHIB traders.
SHIB Price Faces Bearish Pressure Despite Massive Whale Accumulation
SHIB trading near support amid mixed signals - whale accumulation of 4.66 trillion tokens conflicts with declining burn rates and bearish technical indicators.
SHIB Price Analysis: Whale Accumulation of 4.66 Trillion Tokens Provides Support Despite Market Weakness
SHIB trades with neutral momentum as whale accumulation of $64 million worth of tokens helps absorb selling pressure, while Shibarium network activity surges.
SHIB Price Faces Bearish Pressure as Technical Indicators Signal Caution
Shiba Inu trades with bearish momentum as SHIB RSI sits at 45.36 in neutral territory while recent market data suggests continued downward pressure for traders.
** SHIB Price Resilience: Shiba Inu Defies AI Predictions Despite 16% Drop Forecast
** SHIB trades with 1.07% daily gains as technical indicators show bullish momentum despite Google AI predicting significant decline by month-end.
SHIB Price Holds Strong Despite Google AI Predicting 16% Drop - Technical Breakout Signals
SHIB trades at current levels with mixed signals as Google AI forecasts decline while technical analysis suggests potential breakout opportunity for traders.
SHIB Price Surges 14% as Technical Indicators Flash Mixed Signals
Shiba Inu trades with 2.85% daily gains following a strong two-week rally, but bearish AI predictions and overbought conditions suggest caution ahead.
SHIB Price Holds Despite Google AI Predicting 16% Drop - Technical Breakout Signals Mixed
Shiba Inu trades with 2.98% daily gains amid conflicting signals as Google's Gemini AI forecasts significant decline while technical indicators suggest potential breakout.
SHIB Price Faces Critical Test at $0.00001400 Resistance as Bears Take Control
Shiba Inu encounters strong resistance at $0.00001400, declining 4.42% in 24h amid bearish sentiment and weakening technical indicators across SHIB/USDT trading pair.
SHIB Price Faces Potential 16% Drop as AI Prediction Weighs on Bullish Momentum
SHIB trades with weak bullish signals while Google's AI forecasts a 16% decline to $0.00001 by month-end, creating uncertainty for traders despite accumulation signs.
Shiba Inu Price Faces Bearish Pressure as Google AI Predicts 16% Drop for SHIB
SHIB trades in neutral territory at $0.00001196 despite Google Gemini's bearish forecast, with technical indicators showing mixed signals for August 2025.
SHIB Price Rebounds 5.64% From Key Support as Technical Indicators Flash Mixed Signals
Shiba Inu recovers with 5.64% daily gains after finding support at $0.000010, but bearish trends persist as SHIB faces critical resistance levels ahead.
SHIB Price Faces 16% Drop Prediction as Bearish Momentum Builds
Shiba Inu trades with bearish signals as Google's AI predicts potential decline to $0.00001, while SHIB RSI shows neutral positioning at 43.13.
Shiba Inu (SHIB) Faces Bearish Pressure as Technical Indicators Signal Weakness
SHIB trading shows concerning signals with RSI at 38.55 and bearish MACD momentum as selling pressure intensifies despite token burn efforts.
SHIB Price Faces Critical Test at Support Levels After 5th Anniversary Celebration
Shiba Inu trades near lower Bollinger Band support with SHIB RSI at 40.87, as the meme coin celebrates 5 years since launch amid cautious August outlook from analysts.
SHIB Price Faces Technical Pressure Despite 5th Anniversary Milestone
Shiba Inu trades near lower Bollinger Band support with RSI at 37.85, while celebrating its 5th anniversary amid consolidation around key resistance levels.
Shiba Inu (SHIB) Consolidates at $0.000012 as Traders Eye August Breakout
SHIB trades near support levels following resistance at $0.000016, with technical indicators showing mixed signals as the token celebrates its fifth anniversary milestone.
SHIB Price Faces Critical Support Test as RSI Signals Oversold Territory
Shiba Inu trades with bearish momentum as SHIB RSI drops to 38.41, indicating potential buying opportunity near key support levels for contrarian traders.
SHIB Price Struggles Despite Massive Burn Rate Spike as Bears Maintain Control
Shiba Inu trades sideways with weak bullish momentum while technical indicators suggest consolidation phase ahead for SHIB investors.
SHIB Price Drops 4.5% as Bears Test Lower Support Levels
Shiba Inu trades near Bollinger Band support with RSI at 41.70, suggesting potential oversold bounce opportunity for SHIB/USDT traders.
SHIB Price Retreats 6% Despite July AI Rally Momentum
Shiba Inu trades lower at current levels after 30% July surge driven by AI integration initiatives, with technical indicators showing mixed signals for SHIB traders.
SHIB Price Drops 5% Despite Whale Accumulation and Base Network Expansion
Shiba Inu trades lower at current levels as mixed signals emerge from recent Base Network expansion news and security concerns, while whale dominance hits 74%.
SHIB Price Holds Neutral Territory as Technical Indicators Signal Mixed Momentum
Shiba Inu trades sideways with SHIB RSI at 54.52, showing neutral momentum while bearish MACD signals suggest caution for SHIB/USDT traders.
SHIB Price Rallies 6.34% as Technical Indicators Flash Mixed Signals
Shiba Inu trades with bullish momentum despite bearish MACD signals. SHIB RSI at 55.45 suggests neutral territory with room for further upside movement.
Shiba Inu (SHIB) Technical Reset as Token Burn Plans Counter Overbought Signals
SHIB price retreats 4.27% to neutral RSI territory despite 200 trillion token burn announcement and July's impressive 30% surge breaking key resistance levels.
SHIB Price Shows Bullish Momentum as Technical Indicators Signal Potential Uptrend
Shiba Inu trades with modest gains as SHIB RSI sits neutral at 54.25 while MACD histogram indicates building bullish momentum for the meme coin.
Shiba Inu Surges 30% in July as SHIB Breaks Key Resistance at Overbought Levels
SHIB price shows strong bullish momentum after breaking 2025 downtrend, but RSI at 78 signals potential pullback risk for traders.
** Shiba Inu Surges 30% in July as AI Integration and Burn Rate Fuel Bullish Rally
** SHIB trades at overbought levels with 78.65 RSI as July's 30% rally continues, driven by AI initiatives and accelerated token burns targeting $0.000017.
Shiba Inu Surges 30% in July 2025: AI Integration and Burn Rate Drive Bullish Momentum to $0.000017 Target
SHIB rockets 30% in July driven by AI initiatives, explosive burn rates, and whale accumulation. Technical analysis reveals strong bullish trend with $0.000017 target.
Shiba Inu (SHIB) Breaks 2025 Downtrend Amid AI Integration and Explosive Burn Rate Surge
SHIB surges 2.8% breaking key resistance levels as AI initiatives, whale accumulation, and record burn rates drive bullish momentum despite overbought technical signals.
Shiba Inu (SHIB) Surges on AI Integration and Technical Breakouts: Price Outlook and Risks
Shiba Inu (SHIB) rallies on AI-focused developments, technical upgrades, and whale accumulation, signaling strong bullish momentum. Risks like centralization remain.
Shiba Inu (SHIB) Gains Momentum Amid AI Innovations, Whale Activity, and Technical Breakouts
Shiba Inu (SHIB) shows bullish momentum fueled by AI integration, whale accumulation, and technical breakouts. Despite risks like centralization, SHIB targets $0.00001650.
Shiba Inu (SHIB) Surges on AI Integration and Technical Upgrades: Price Outlook and Risks
Shiba Inu (SHIB) sees bullish momentum, driven by AI-focused initiatives, metaverse upgrades, and whale activity. However, centralization risks and exchange delistings pose challenges.
Shiba Inu (SHIB) Surges Amid AI Integration and Technical Breakouts: Price Outlook for 2025
Shiba Inu (SHIB) sees bullish momentum with AI-focused developments, whale accumulation, and technical upgrades. However, risks like centralization and delistings loom.
Shiba Inu (SHIB) Gains Momentum Amid Bullish Signals and Technical Breakouts
Shiba Inu (SHIB) sees bullish momentum fueled by whale accumulation, technical breakouts, and ecosystem upgrades. Will it sustain its rally or face risks ahead?
Shiba Inu (SHIB) Gains Momentum Amid Whale Activity and Bullish Breakout Signals
Shiba Inu (SHIB) is surging with whale accumulation, technical breakouts, and AI-backed bullish predictions. Explore key market trends, risks, and price outlook.
Shiba Inu (SHIB) Gains Momentum: Whale Activity and Technical Breakout Signal Bullish Outlook
Shiba Inu (SHIB) shows signs of a major bullish breakout with whale activity surging and technical indicators turning positive. However, risks like centralization and exchange delistings add uncert...
Shiba Inu On Track to Follow Dogecoin Rally Amid Musk's Twitter Buying
Shiba Inu has found success quickly and is currently the second-largest meme coin in the market. But its impressive performance appears related to Doge.
Solana Surges 8% to $203 as Cathie Wood Compares Hyperliquid to Early-Stage SOL
Solana (SOL) rallied 8% in the past 24 hours to reach $203.44, as ARK Invest CEO Cathie Wood compared perpetual futures exchange Hyperliquid to Solana's earl...
SOL Price Prediction: Targeting $140-145 Rally Within 7-10 Days as Technical Momentum Builds
SOL price prediction points to $140-145 upside targets as bullish MACD momentum emerges from oversold conditions near critical $130 support level.
SOL Price Prediction: Targeting $140-145 by Year-End as Technical Momentum Builds
SOL price prediction shows potential for $140-145 rally within 2 weeks, supported by bullish MACD histogram and oversold conditions near key $130 support level.
SOL Price Prediction: Targeting $149 by January with Bullish Momentum Building
Solana shows technical recovery signs with MACD turning positive. SOL price prediction targets $149 medium-term as analysts forecast 11% gains ahead.
SOL Price Prediction: Targeting $145-150 Within 7 Days as Technical Momentum Builds
SOL price prediction points to $145-150 target by mid-December as MACD bullish divergence emerges despite recent 4.59% decline, with critical $127 support holding firm.
SOL Price Prediction: Targeting $165-180 Breakout Within 2 Weeks as Bulls Eye Recovery
Solana shows bullish momentum signals with SOL price prediction targeting $165-180 range short-term, supported by improving MACD histogram and critical $146.91 resistance test ahead.
SOL Price Prediction: Targeting $155-$165 Recovery Within 2-4 Weeks Despite Current Consolidation
Solana shows bullish MACD momentum with analyst targets at $155-$165. Key resistance at $146.91 must break for SOL to reach medium-term forecasts of $186-$259.
SOL Price Prediction: Targeting $155-165 Range as Bullish Momentum Builds Through December
Technical analysis suggests SOL could reach $155-165 in the next 2-4 weeks, with immediate resistance at $146.91 providing the first test for bullish continuation.
SOL Price Prediction: Solana Targets $155-165 by Year-End as Bullish Momentum Builds
SOL price prediction shows potential 8-15% upside to $155-165 by December 31st, with analysts eyeing $186-259 targets as bullish MACD signals emerge from current $143.58 level.
SOL Price Prediction: Targeting $155-$165 by December 2025 as Bullish Momentum Builds
Technical analysis suggests SOL could reach $155-$165 range within weeks, with immediate target at $144.30. Current bullish MACD histogram supports upside potential.
SOL Price Prediction: Targeting $186-$259 Recovery by Year-End 2025
SOL price prediction points to $186-$259 targets as Solana shows bullish MACD momentum despite trading near lower Bollinger Band support at $127.43.
SOL Price Prediction: Targeting $155-200 Recovery Within 4-6 Weeks After Oversold Bounce
SOL price prediction indicates potential recovery to $155-200 range as technical indicators show oversold conditions with bullish momentum building despite recent 7% decline.
Solana ETFs See First Outflow After 21-Day Streak as SOL Tests Key Support at $137
SOL trading at $137.44 following first ETF outflow since October launch, ending 21-day inflow streak that previously supported price above $140 resistance level.
SOL Price Prediction: Targeting $150-$155 by December 2025 Despite Near-Term Headwinds
Solana faces immediate resistance at $150 with bearish momentum, but technical indicators suggest a potential recovery to $150-$155 range within 4 weeks if key support holds.
SOL Price Prediction: Targeting $155-165 by December 2025 Amid Technical Recovery
SOL price prediction points to $155-165 targets as technical indicators show bullish momentum building, with key resistance at $171 and critical support holding at $121.
Solana ETFs Hit $568M in Record 20-Day Inflow Streak as SOL Price Consolidates Above $140
SOL trades at $142.71 (+2.6%) as Solana ETFs maintain unprecedented 20-day inflow streak totaling $568M, signaling sustained institutional appetite despite broader market consolidation.
SOL Tests Key Support at $137 as Technical Indicators Signal Potential Reversal
Solana trades at $137.10 with modest 0.9% gains as technical analysis reveals mixed signals between bullish MACD divergence and bearish moving average structure.
SOL Price Prediction: Targeting $175-$200 Recovery by December 2025 Amid Technical Oversold Bounce
Solana (SOL) shows bullish divergence signals with analysts targeting $175-$200 range by year-end, while long-term forecasts reach $520. Current oversold conditions suggest imminent bounce.
SOL Price Prediction: Targeting $175-$200 Recovery by December 2025 Despite Oversold Conditions
Solana shows oversold RSI at 29.82 with analyst targets ranging $169-$256. Technical analysis suggests SOL price prediction of $175-$200 by December 2025.
Forward Industries' $1B SOL Buyback Program Fails to Lift Price as Technical Weakness Persists
Solana trades at $127.72 despite Forward Industries announcing 6.9M SOL holdings and $1B share repurchase program, as technical indicators signal continued downside pressure.
SOL Price Prediction: Solana Eyes $180 Recovery After Oversold Bounce - $196 Target by December 2025
SOL price prediction shows potential 41% rally to $180 resistance after oversold conditions. Solana forecast targets $196 by year-end if bulls reclaim $142 pivot level.
Solana Consolidates Above $140 as Bitwise ETF Drives $420M First-Week Inflows
SOL trades at $143.71 (+4.0%) following historic Bitwise Solana ETF launch that captured $420M in initial week, while technical indicators suggest consolidation phase ahead.
SOL Price Prediction: Targeting $180-200 Recovery by December 2025 Despite Current Bearish Momentum
Solana faces critical $140 support test with technical indicators suggesting potential recovery to $180-200 range within 4-6 weeks if key resistance breaks.
SOL Price Prediction: Solana Eyes $175-$200 Recovery Despite Current Bearish Momentum
SOL price prediction shows mixed signals with analysts targeting $126-$204 range. Technical analysis suggests potential rebound from $139 level to $175-$200 within 2-4 weeks.
Solana Rallies 7.5% as Bitwise ETF Launch Drives Institutional Interest Despite Broader Crypto Volatility
SOL price surges to $141.24 following successful launch of first U.S. spot Solana ETF by Bitwise, which accumulated $420 million in its inaugural week despite Bitcoin's retreat below $95,000.
SOL Price Prediction: Targeting $148-155 Recovery Within 2 Weeks as Technical Oversold Conditions Signal Bounce
SOL price prediction points to $148-155 upside target over next 2 weeks as oversold RSI and analyst forecasts converge on bullish reversal from current $137 support.
Solana Hovers Near $139 as Alameda Selling Pressure Weighs on SOL Amid Broader Market Weakness
SOL trades at $138.78 after recent 4.9% decline triggered by Alameda Research token unlocks, testing critical support levels as broader crypto markets remain volatile.
SOL Price Prediction: Solana Eyes $120-$160 Recovery Range as RSI Shows Oversold Relief
SOL price prediction targets $150-$160 recovery within 30 days as oversold conditions and Bollinger Band support signal potential bounce from current $140 levels.
Solana Holds Above $140 as Alameda Token Unlocks Continue Pressuring SOL Market
SOL price consolidates at $140.46 amid ongoing selling pressure from Alameda Research token unlocks, while Bitwise ETF inflows provide support for the altcoin.
SOL Price Prediction: Targeting $160-175 Recovery Within 4-6 Weeks Despite Current Bearish Setup
Solana faces critical test at $135 support with analyst targets pointing to $160-175 recovery by year-end amid oversold technical conditions.
SOL Price Prediction: Solana Eyes $160-175 Recovery by December 2025 Despite Current Bearish Momentum
SOL price prediction targets $160-175 range within 4-6 weeks as technical indicators suggest oversold bounce potential from current $143.58 support level.
Bitwise Solana ETF Hits $420M as SOL Tests $145 Support Amid Market Decline
SOL trading at $149.22 down 2.9% as first U.S. spot Solana ETF accumulates $420M in debut week while technical indicators signal oversold conditions near key support levels.
SOL Price Prediction: Solana Targets $175-185 Recovery Before Month-End Despite Current Weakness
SOL price prediction shows potential recovery to $175-185 by November end despite current bearish momentum, with key support at $145 critical for bulls.
SOL Price Recovers 3.4% to $167 as ETF Launch Volatility Begins to Settle
Solana trades at $167.24 after bouncing from recent ETF launch selloff, with institutional flows providing stability despite broader crypto market uncertainty.
Solana Rallies 5.4% as Firedancer Upgrade and Fed Rate Cut Signals Boost Risk Assets
SOL surges to $165.94 amid network performance improvements and broader crypto market optimism following Bitcoin's historic $100K breakthrough and dovish Fed signals.
SOL Price Prediction: Targeting $195-210 Recovery Within 4 Weeks Despite Current Bearish Momentum
SOL price prediction shows potential recovery to $195-210 range within 4 weeks, though immediate downside risk to $150 exists as Solana trades below key moving averages.
SOL Price Prediction: Targeting $195-210 Recovery Within 30 Days Despite Current Bearish Momentum
SOL price prediction shows potential recovery to $195-210 range by December 2025, though current technical indicators suggest caution with RSI at 36.81 and bearish MACD signals.
SOL Price Prediction: Targeting $186 by November 14th Amid Mixed Technical Signals
Solana trades at $163.92 with analysts forecasting $186 near-term target. Technical analysis reveals conflicting signals as SOL battles key resistance levels.
SOL Technical Analysis: Oversold Conditions Present Opportunity as Price Tests Lower Bollinger Band at $155
Solana trades at $155.43 after a 3.4% decline, with RSI hitting oversold levels at 29.52 while testing critical technical support near the lower Bollinger Band.
SOL Price Prediction: Targeting $190-200 Recovery by November End Amid Oversold Conditions
SOL price prediction points to $190-200 upside potential within 3-4 weeks as technical indicators signal oversold bounce from current $156 levels despite bearish momentum.
SOL Price Prediction: Targeting $190-$200 Recovery by December 2025 After Testing Critical $163 Support
Solana faces key support test at $163 with analysts forecasting SOL price targets of $186-$200 by December 2025, driven by upcoming Alpenglow upgrade and oversold RSI conditions.
Solana Revenue Growth Story Overshadowed by Tariff-Induced Market Selloff as SOL Tests $183 Support
SOL price drops to $183.81 amid broader crypto liquidation cascade triggered by tariff announcements, despite reporting 30x faster revenue growth than early Ethereum.
SOL Price Prediction: Targeting $205 Within Two Weeks as Solana Tests Critical $196 Breakout Level
SOL price prediction points to $205 target as Solana bounces from $185 support. Technical analysis shows bullish momentum building with MACD turning positive.
SOL Tests Key $185 Support as Crypto Markets Face November Volatility
Solana trades at $186.35 after a 1.4% decline, hovering near critical support levels as traders position for potential breakout above $190 resistance in absence of major catalysts.
SOL Price Prediction: Targeting $240-275 by December 2025 as Technical Indicators Signal Bullish Reversal
SOL price prediction points to $240-275 upside potential within 4-6 weeks as MACD histogram turns bullish and analysts eye Solana ETF catalysts despite neutral RSI.
SOL Tests Key $186 Support as Halloween Trading Shows Bullish Momentum Despite Weekly Consolidation
Solana trades at $186.18 with 2.7% daily gains as technical indicators suggest potential breakout from recent consolidation phase near critical moving average levels.
SOL Price Prediction: Targeting $205-$220 Recovery Within 2 Weeks as Technical Momentum Shifts Bullish
SOL price prediction points to $205-$220 upside potential over next 2 weeks as MACD histogram turns bullish and RSI exits oversold territory, setting stage for test of key resistance.
SOL Price Prediction: Targeting $204-210 Range by November 2025
Solana technical analysis points to $204-210 price target within 2-3 weeks, with key resistance at $229.69. Current MACD bullish divergence supports upside momentum.
SOL Price Prediction: Targeting $245-260 Breakout Before Year-End 2025
SOL price prediction suggests a bullish move toward $245-260 if Solana holds $197 support, with December targets reaching $280-300 based on technical momentum.
SOL Price Prediction: Targeting $210-220 by November 2025 Despite Mixed Signals
SOL price prediction points to $210-220 upside potential within 4 weeks as Solana breaks above key support levels, though bearish MACD warns of near-term volatility.
SOL Tests Technical Support Near $184 as SEC ETF Delay Weighs on Sentiment
Solana trades at $184.06 with muted 0.03% daily gains as traders digest the SEC's October 16 delay on Solana ETF applications, while technical indicators suggest consolidation phase.
SOL Price Prediction: Solana Eyes $220 Target Despite Near-Term Headwinds Through Q4 2025
SOL price prediction shows mixed signals with short-term weakness to $186 possible, but medium-term Solana forecast points to $200-220 upside by year-end.
SOL Tests Key $182 Support Level as Broader Crypto Weakness Continues
Solana trades at $186.25 after testing $182.72 daily lows, with technical indicators suggesting further downside risk as the altcoin tracks Bitcoin's recent weakness in absence of major catalysts.
SEC Delays Solana ETF Decision While SOL Holds Above $190 Despite 4.5% Recovery
SOL price rebounds to $193.65 (+4.48%) as traders digest SEC's postponement of Solana ETF applications, with technical indicators showing mixed signals near key support levels.
SOL Tests Key Support as Technical Indicators Signal Potential Reversal Setup
Solana trades at $187.19 amid bearish momentum indicators while approaching critical support zones, with RSI neutral positioning suggesting potential inflection point ahead.
SOL Tests Critical Support at $183 as SEC ETF Delay Triggers 2.3% Decline
Solana trading at $183.07 after SEC postpones ETF decision, testing key support near 200-day moving average while breaking year-long downtrend signals conflicting signals.
SOL Solana Tests $195 Support as SEC ETF Delay Triggers 2.7% Selloff
SOL trading at $198.19 after SEC delays Solana ETF decision to October 16, creating uncertainty despite recent technical breakout from year-long downtrend.
SOL Analysis: Solana Holds Above Key Moving Averages Despite Market Weakness
SOL trades at $221.09 with relative strength against broader crypto decline, maintaining 28.5% premium over 200-day moving average while testing critical support levels.
SOL Price Watch: Technical Breakout Setup Eyes $241 Resistance After 32% Gains Above Key Moving Average
Solana trades at $226.90 with bullish momentum as SOL breaks above all major moving averages, setting up potential test of $241 resistance level.
Solana Consolidates Above $220 as Layer 1 Competition Intensifies Amid Market Uncertainty
SOL trades at $222.01 after a 3.75% decline, holding above key moving averages while technical indicators suggest consolidation phase ahead of potential breakout
SOL Consolidates Above Key Moving Averages as Bulls Maintain Control Near $234
Solana trades at $233.60 with modest 0.89% daily gain, holding well above all major moving averages while technical indicators suggest continued bullish momentum.
SOL Consolidates Above Key Moving Averages as Bulls Eye $253 Resistance
Solana trades at $232.12, up 1.10% in 24 hours, maintaining position above all major moving averages while approaching critical resistance at $253.51.
Solana Technical View: SOL Eyes $253 Resistance After Breaking Above Key Moving Averages
SOL trades at $231.42, up 3.17% as bulls target $253 resistance following decisive break above 20 and 50-day moving averages with strong momentum indicators.
SOL Consolidates Around $209 as ETF Approval Process Shows Mixed Signals
Solana trades at $209 amid conflicting ETF developments, with the SEC delaying decisions while streamlining approval processes and institutional investments totaling $267M.
SOL Consolidates Above 50-Day Moving Average as Technical Indicators Signal Neutral Territory
Solana trades at $210.46 with +1.19% daily gains, holding above the 50-day moving average while facing resistance near $214 as market sentiment remains mixed.
Breaking: Solana Price Surges as Alpenglow Upgrade Delivers Lightning-Fast Transaction Speeds
SOL trades at $208.32 (+3.35% daily) following the Alpenglow upgrade that reduced transaction finality to just 150ms, making Solana the fastest major blockchain.
Solana (SOL) Tests Critical Support at $201 as Futures Interest Hits Record High
SOL price drops 0.44% to $201.36 despite record $14.5B futures open interest and major Alpenglow upgrade improving transaction finality to 150ms.
Solana (SOL) Price Drops 4.6% Despite Record Trading Volume and Ecosystem Growth
SOL trades at $195.23 after a 4.6% decline, showing bearish momentum despite positive ecosystem developments including 85M new tokens launched.
SOL Price Tests Key Support at $204 Despite CME Futures Approval Boost
Solana trades at $204.31 (-2.69%) as technical indicators show mixed signals while institutional adoption accelerates with upcoming CME futures launch.
Solana (SOL) Tests Key Support at $212 as ETF Approval Hopes Drive Recovery
SOL price currently trading at $212.28 despite 2.98% daily decline. SEC's streamlined ETF approval process creates bullish catalyst for institutional adoption.
Solana (SOL) Price Drops 7% Despite $1.4 Billion in Institutional Investments
SOL trades at $215.46 after a 7.11% daily decline, testing key support levels while major institutions pour $1.4 billion into Solana ecosystem this week.
Solana (SOL) Price Analysis: Testing $225 Support After 6% Drop
SOL trades at $224.36 after a 6.32% decline, but technical indicators suggest the bullish trend remains intact despite short-term bearish momentum signals.
SOL Price Surges to $240 as Solana Network Processes Record 2.9 Billion Transactions
SOL trades at $240.22 (+0.45%) as Solana's network achieves unprecedented transaction milestone, matching Ethereum's lifetime volume in single month.
SOL Price Surges to $239 as Alpenglow Upgrade Slashes Transaction Times to 150ms
Solana trades at $239.18 after the groundbreaking Alpenglow upgrade and $1.4B in institutional investments drive bullish momentum despite minor 24h correction.
Solana (SOL) Surges Past $244 as DEX Volume Crushes Ethereum
SOL price hits $244.47 with 8% weekly gains as Solana's daily DEX volume nearly doubles Ethereum's $4.03B, signaling massive ecosystem growth and user adoption.
Solana (SOL) Surges to $246 as DEX Volume Overtakes Ethereum - Bulls Eye $250 Breakout
SOL trading at $246.21 (+5.12%) after surpassing Ethereum in DEX volume, with technical indicators pointing to potential $250+ breakout despite network concerns.
Solana (SOL) Consolidates at $235 as ETF Approval Sparks Institutional Interest
SOL trades at $235.28 with minimal 24h movement despite ETF eligibility news. Technical indicators show bullish momentum while 85M token launches highlight network dominance.
Solana (SOL) Surges Past $234 as DEX Volume Hits Record $2.6 Billion
SOL price reaches $234.28 with bullish technical signals emerging as Solana's DEX trading volume sets new record, surpassing Ethereum and BNB Chain combined.
Solana (SOL) Holds Above $234 Despite 5% Pullback as Whale Accumulation Continues
SOL trades at $234.90 after a 5% daily decline, but technical indicators remain bullish with RSI at 64.68 and strong whale accumulation supporting the uptrend.
Solana (SOL) Breaks Past $247 as Network Processes 2.9B Transactions
SOL price surges to $247.40 (+1.80%) after Solana matches Ethereum's lifetime transaction volume with 2.9 billion transactions in August 2025, signaling strong network adoption.
Solana (SOL) Eyes $300 Breakout as Transaction Milestone Sparks Rally
SOL trades at $243.12 (+2.30%) after matching Ethereum's lifetime transactions, with technical indicators suggesting bullish momentum toward $300 resistance.
SOL Price Surges 6% as Solana DeFi TVL Hits Record $12.3 Billion High
SOL trades at $239.10 with 6.08% daily gains as Solana's DeFi ecosystem reaches unprecedented $12.3B TVL, signaling strong institutional confidence and bullish momentum.
Solana (SOL) Surges 3.54% to $224.79 as Technical Indicators Signal Continued Bullish Momentum
SOL price climbs to $224.79 with strong technical signals despite regulatory headwinds, as Alpenglow upgrade and record transaction volumes fuel optimism.
Solana (SOL) Tests Upper Resistance at $217 as Technical Indicators Flash Mixed Signals
SOL price trades at $217.40 (+1.40% in 24h) near crucial $220 resistance level while RSI hits 61.10, suggesting potential consolidation ahead despite recent upgrade momentum.
Solana (SOL) Eyes $218 Breakout as Real World Assets Hit $500M Milestone
SOL trades at $207.30 (+2.31% today) with bullish momentum building toward key $218 resistance as institutional interest grows following major adoption milestones.
Solana (SOL) Price Analysis: Mixed Signals as Network Activity Soars Despite Exchange Inflows
SOL trades at $203.21 with neutral RSI as exchange balances surge to 32M tokens, creating potential selling pressure despite strong network fundamentals.
Solana (SOL) Retreats 2% Despite Record Transaction Volume and TVL Highs
SOL trades at $202.36 (-1.97%) as SEC ETF delay weighs on price despite Solana processing 2.9B transactions in August and hitting 3-year TVL highs.
Solana (SOL) Holds Above $200 Despite Network Activity Slowdown
SOL price trades at $204.48 with mixed signals as August revenue hits $78M but transaction volume retreats from July highs.
Solana (SOL) Tests $206 as Whale Activity Meets Rising Selling Pressure
SOL price trades at $206.60 (-1.30%) amid mixed signals as $505M whale staking conflicts with rising exchange balances and technical warning patterns.
Solana SOL Price Surges Past $209 as Whale Stakes $505M Amid Alpenglow Upgrade Optimism
SOL price trades at $209.37 (+2.71%) with bullish momentum from major whale staking activity and upcoming Alpenglow upgrades, though supply in profit raises correction concerns.
Solana (SOL) Consolidates Near $203 as Whale Staking Activity Drives Bullish Momentum
SOL trades at $202.72 (+1.77%) as massive whale staking of $505M and record TVL levels signal strong institutional confidence in Solana's ecosystem growth.
Solana (SOL) Tests Key Support at $198 as September Rally Faces Headwinds
SOL price retreats to $198.01 (-3.25%) despite whale staking activity, with technical indicators showing mixed signals as Solana enters historically strong September.
Solana (SOL) Tests $205 as ETF Filing Sparks Fresh Institutional Interest
SOL price holds steady at $204.63 despite minor 24h decline, while Solana technical analysis reveals bullish momentum amid ETF developments and record DeFi growth.
SOL Price Holds Above $200 Despite 2.8% Drop as Whale Stakes $505M
Solana trades at $202.43 with SOL RSI at 55.68 showing neutral momentum while massive whale staking activity suggests underlying strength despite recent pullback.
Solana (SOL) Price Surges to $207 Despite $505M Whale Staking Activity
SOL price hits $207.89 with bullish technicals as whale stakes $505M worth of tokens, but token unlocks threaten short-term volatility in Solana markets.
Solana (SOL) Tests $215 Resistance as Network Hits 2.3M Daily Users
SOL price consolidates at $210.45 (+0.21%) after hitting resistance at $215, while network activity reaches yearly highs with 2.3 million daily users.
Solana (SOL) Retreats 6% Despite 18% Weekly Surge - Critical Support Test at $180
SOL price drops to $181 after hitting $195.89 high, testing key support as technical upgrades drive institutional adoption despite network transaction decline.
Solana (SOL) Price Hovers Near $192 as ETF Delays Challenge Bull Run
SOL trades at $191.81 after SEC postpones ETF decision, but technical indicators suggest bullish momentum remains intact with RSI at 57.89.
Solana Price Holds Above $186 Despite SEC ETF Delay - SOL Technical Analysis Shows Mixed Signals
SOL trades at $186.98 (-3.58% today) as SEC delays ETF decision. Technical indicators show bullish momentum despite recent regulatory headwinds affecting price action.
Solana (SOL) Retreats to $192 After Hitting $200 Resistance - Key Support Levels in Focus
SOL price drops 5.43% to $192.52 despite bullish momentum from ETF approval odds reaching 90%. Technical indicators suggest consolidation near critical levels.
Solana (SOL) Surges Above $200 as ETF Approval Odds Reach 90%
SOL trades at $202.05 (+4.05%) after reclaiming the $200 level. Technical indicators show bullish momentum while ETF approval odds hit 90%, driving renewed investor confidence.
Solana (SOL) Surges 10.63% to $193.78 as Bulls Target Key Resistance
SOL price climbs to $193.78 with strong bullish momentum as technical indicators signal potential breakout above critical resistance levels.
SOL Price Plunges 5% as BlackRock ETF Denial Triggers Sell-Off
Solana (SOL) trades at $175.36, down 5% in 24h, as BlackRock's ETF denial weighs on sentiment despite positive ecosystem developments and neutral technical indicators.
SOL Price Surges 18% to $183 as Solana Technical Upgrades Drive Institutional Adoption
Solana trades at $183.37 (+2.23% daily) after an 18% weekly surge driven by Firedancer upgrades and institutional adoption, with SOL RSI showing neutral momentum at 58.48.
Solana (SOL) Breaks $180 Barrier as $1.4B Staking Withdrawal Fuels Rally
SOL price surges 17% weekly to $181.31 amid massive staking withdrawals, while technical indicators show strong bullish momentum above all major moving averages.
Solana (SOL) Price Holds Above $177 as Technical Indicators Flash Mixed Signals
SOL trades at $177.41 with 1.49% daily gains, while technical analysis reveals neutral RSI and bearish MACD divergence creating uncertainty for traders.
Solana (SOL) Surges 4.28% as Visa Expands Stablecoin Settlement to Blockchain
SOL price jumps to $174.33 after Visa announces Solana integration for stablecoin settlements, while technical indicators show neutral momentum with key levels in focus.
Solana (SOL) Tests Critical Support at $167 Amid 25% Correction from July Highs
SOL trades at $167.36 (+2.83% today) after dropping 25% from July peak, with RSI neutral at 47 but bearish MACD signaling potential further downside ahead.
Solana (SOL) Retreats to $162 as Bears Target Lower Support Levels
SOL trades at $161.94 (-3.72%) after a sharp 25% decline from July's $206 peak, with technical indicators signaling potential further downside risks.
Solana (SOL) Tests Key Support at $162 as July Rally Fades
SOL trades at $162.00 (+0.95% today) near crucial support levels as post-rally consolidation continues despite positive ecosystem developments.
SOL Price Drops 2.6% as Solana Tests Lower Bollinger Band Support at $160
SOL price falls to $160.48 amid bearish momentum signals. Solana's RSI at 41 suggests oversold conditions while technical indicators point to potential bounce.
SOL Price Retreats 7.4% Despite Ecosystem Wins - Technical Analysis Shows Key Support Test
Solana trades at $168.42 after a 7.4% decline, testing critical support levels while ecosystem partnerships with Visa and Shopify drive long-term optimism.
Solana (SOL) Consolidates Near $180 as Ecosystem Partnerships Drive Momentum
SOL price trades at $180.49 after July's 35% surge, with technical indicators showing mixed signals while Visa and Shopify integrations boost long-term outlook.
Solana (SOL) Holds $179 Despite Whale Accumulation and Technical Resistance
SOL trades at $179.11 (-2.94% in 24h) as $23M whale accumulation battles technical bearish signals and key resistance at $206.30 in volatile market conditions.
Solana (SOL) Pulls Back to $183 Despite Bullish ETF Launch and $200 Breakout
SOL trades at $183.67 (-4.73% daily) after hitting $200 highs. ProShares ETF launch and $102B market cap milestone drive bullish momentum despite technical correction.
Solana (SOL) Faces Resistance After 35% July Rally - Technical Analysis
SOL trades at $185.26 (-1.65%) after cooling from $208 peak. Bulls maintain control above key moving averages despite recent pullback from resistance.
Solana (SOL) Holds Above $187 Despite Minor Pullback as Bulls Eye $200 Reclaim
SOL trades at $187.18 with 0.62% daily gains as technical indicators suggest bullish momentum continues despite recent pullback from $200 highs.
Solana (SOL) Consolidates Near $186 After Hitting $200 Milestone, Technical Indicators Signal Continued Strength
SOL trades at $185.99 with bullish momentum intact despite slight pullback from recent highs above $200, as RSI remains in neutral territory at 60.72.
Solana (SOL) Retreats to $181 Despite Strong Weekly Gains - Key Support at $146 in Focus
SOL trades at $181.81 (-4.56% daily) after surging past $200 this week. Technical indicators show bullish momentum despite short-term pullback.
Solana (SOL) Price Faces Correction After $208 Peak - Support Test at $185
SOL trades at $185.81 (-3.06%) after retreating from July highs above $208, with bulls defending key support levels amid mixed technical signals.
Solana (SOL) Surges to $194 as DEX Volume Hits $1.4 Trillion - Bullish Breakout Continues
SOL trades at $194.77 (+7.71%) after breaking key resistance at $165.50, with RSI at 79 signaling overbought conditions but strong momentum persists.
Solana Breaks Key Resistance as DEX Volume Surges 140% - SOL Eyes $185 Target
SOL trades at $179.95 (+1.22%) after breaking resistance, with technical analysis pointing to $185 target despite Trump meme coin concerns weighing on sentiment.
Solana (SOL) Breaks $178 Resistance as Golden Cross Signals Bullish Rally Despite Trump Meme Coin Concerns
Solana surges past $165 resistance targeting $185 with Golden Cross formation, while Trump meme coin unlock and SlashApp integration create mixed market signals for SOL traders.
Solana (SOL) Surges to $177 as Pump ICO Raises $600M: Technical Analysis Shows Strong Bullish Momentum
SOL hits $177 amid Pump's massive $600M ICO success and $500M Trump token unlock. RSI at 70.5 signals overbought conditions while technical indicators remain bullish.
Solana (SOL) Surges Amid Positive News: Price Holds $160 as Bullish Momentum Builds
Solana (SOL) is gaining traction, holding strong above the $160 support level. Positive developments, including institutional interest and partnerships, signal further upside potential.
Solana (SOL) Targets $200 Amid Technical Upgrades and Growing Institutional Adoption
Solana (SOL) is on a bullish trajectory, fueled by technical upgrades, institutional partnerships, and increased adoption. With its price nearing $165, can it hit $200 soon?
Solana (SOL) Gains Momentum Amid Tokenized Asset Surge and ETF Optimism
Solana's blockchain sees a 140% surge in tokenized asset value and increasing institutional adoption. Regulatory progress on Solana ETFs fuels optimism despite minor setbacks.
Solana (SOL) Gains Momentum with ETF Approvals, Upexi Treasury Expansion, and Network Upgrades
Solana (SOL) sees bullish momentum driven by ETF progress, strategic partnerships, and technical upgrades. Despite minor setbacks, SOL shows resilience with price targets ahead.
Solana (SOL) Surges with ETF Launch and Technical Upgrades: Key Signals for Traders in July 2025
Solana (SOL) sees bullish momentum as ETF inflows spike 165% and technical upgrades enhance network performance. Explore price predictions, risks, and trading insights.
Solana (SOL) Surges with $4 Billion Deposits, Key Partnerships, and ETF Approval Momentum
Solana (SOL) gains momentum as ecosystem deposits hit $4 billion, partnerships drive adoption, and ETF approval odds soar. Technical signals hint at further growth.
Solana (SOL) Nears Critical Resistance Amid Recent Recovery
Solana (SOL) has rebounded significantly, approaching a crucial resistance level. This development could influence future price movements, as the crypto market closely watches SOL's next steps.
Solana (SOL) Faces Persistent Pressure Below Key Technical Level
Solana (SOL) struggles to maintain momentum above the 200-EMA, facing repeated rejections and potential downside pressure towards the $145 support level.
Solana (SOL) Hits New AHT of $145, Displaces Dogecoin To Become the Seven-Largest Cryptocurrency
Solana is making an impressive rally this year, prompting the need to understand such trading performance. SOL's recent performance has replaced Dogecoin to become the seven-largest cryptocurrency.
Solana (SOL) Faces Resistance, Yet Maintains Upward Momentum
Solana (SOL) encounters resistance, yet an ascending trendline supports its sustained upward momentum. Explore the latest market analysis and potential future movements.
South Korea Launches “Emergency” Inspection of Crypto Exchanges Following Terra Crash
To boost investor protection following the recent collapse of LUNA and TerraUSD (UST) tokens, financial authorities in South Korea have beefed up crypto exchange inspections.
Understanding the Stochastic Oscillator: A Tool for Market Reversals
Explore the Stochastic Oscillator's role in trading, known for identifying overbought/oversold conditions, and its application alongside other indicators like RSI and MACD.
StochRSI: A Deep Dive into Precision Market Timing
Discover the intricacies of StochRSI, a hybrid oscillator that enhances market timing precision by combining RSI momentum analysis with Stochastic oscillator insights.
SUI Price Prediction: Target $1.70-$2.10 as Technical Indicators Signal Recovery by End December 2025
SUI price prediction points to $1.70-$2.10 recovery zone within 2-4 weeks as MACD histogram turns bullish and Bollinger Band positioning suggests upward momentum.
SUI Price Prediction: $1.70-$2.40 Target Range as Technical Breakout Signals Recovery
SUI price prediction shows potential 25-49% upside with analysts targeting $1.70-$2.40 range following falling wedge breakout and improving momentum indicators.
SUI Price Prediction: $1.70 Short-Term Target as Technical Indicators Signal Bullish Recovery
SUI price prediction shows potential rally to $1.70 within one week, with medium-term Sui forecast targeting $2.10-$2.40 range based on improving momentum indicators.
SUI Price Prediction: Targeting $1.79 Resistance Break for $2.77 Rally by Q3 2025
SUI price prediction shows potential for 72% upside to $2.77 by September 2025, with immediate resistance at $1.79 crucial for bullish continuation from current $1.61 level.
SUI Price Prediction: Targeting $2.10 by January 2025 as Technical Indicators Signal Recovery
SUI price prediction points to $2.10 target within 4-6 weeks as MACD momentum turns bullish and analysts forecast potential 150% rally to $4.00 medium-term.
SUI Price Prediction: Targeting $1.70-$2.10 Recovery Despite 39% Decline
SUI price prediction shows potential recovery to $1.70 short-term and $2.10 medium-term as technical indicators signal bullish momentum despite recent volatility.
SUI Price Prediction: Targeting $2.20 Recovery by January 2025 Despite Short-Term Bearish Pressure
SUI price prediction shows potential recovery to $2.20 in January 2025, though near-term weakness toward $1.19-$1.25 expected as bearish sentiment dominates with 79-88% negative indicators.
SUI Price Prediction: Targeting $2.10-$2.40 Recovery in December 2025 Despite Mixed Analyst Views
SUI price prediction suggests recovery to $2.10-$2.40 range within 2-3 weeks as technical indicators show bullish momentum despite recent 39% decline.
SUI Price Prediction: $2.50-$3.40 Target by January 2025 as Oversold Conditions Signal Reversal
SUI price prediction points to $2.50-$3.40 recovery by January 2025 as RSI hits oversold levels at 27.93 and bullish MACD divergence emerges near critical $1.30 support.
SUI Price Prediction: Recovery to $1.75-$1.80 Expected as Oversold Conditions Signal Reversal
SUI price prediction shows potential 27-31% upside to $1.75-$1.80 within 1-2 weeks as RSI at 29.04 indicates extreme oversold conditions with bullish MACD divergence emerging.
SUI Price Prediction: Testing $1.75-$1.80 Recovery Target Within 2 Weeks
SUI price prediction shows potential bounce to $1.75-$1.80 as oversold conditions and bullish MACD momentum signal short-term recovery from current $1.56 levels.
SUI Price Prediction: Targeting $1.75-$1.80 Recovery Within 7 Days Amid Mixed Signals
SUI price prediction shows potential bounce to $1.75-$1.80 short-term despite technical sell signals, with critical $1.50 support determining bullish continuation.
SUI Price Prediction: Target $1.75 Within 2 Weeks as Technical Indicators Signal Reversal
SUI price prediction shows potential 14% upside to $1.75 target as MACD momentum turns bullish despite recent analyst bearish consensus around $1.38 levels.
SUI Price Prediction: Oversold Bounce to $1.77 Expected Within 7 Days
SUI price prediction targets $1.77 short-term rebound as RSI hits extremely oversold levels at 21.88, with medium-term Sui forecast ranging $1.60-$2.40.
SUI Price Prediction: Technical Oversold Bounce to $1.60-$1.77 Expected Within 7-14 Days
SUI price prediction shows oversold RSI at 22.29 signaling potential bounce to $1.60-$1.77 resistance zone, though bearish momentum persists with critical support at $1.32.
SUI Price Prediction: Oversold Bounce to $2.40 Target Within 2-4 Weeks Despite Near-Term Headwinds
SUI trades at $1.55 with RSI at oversold 26.59 levels, suggesting potential bounce to $2.40 resistance despite bearish momentum. Critical $1.49 support holds key.
SUI Price Prediction: $2.28 Target Within 30 Days as Oversold Conditions Signal Reversal
SUI price prediction shows potential 37% upside to $2.28 in the next 30 days as RSI at 28.64 indicates extreme oversold conditions with medium-term Sui forecast targeting $4.45.
SUI Price Prediction: Oversold Conditions Point to $2.28 Recovery by December 2025
SUI price prediction indicates potential bounce from current oversold levels at $1.71 to $2.28 target, with medium-term Sui forecast suggesting $4.45 by year-end.
SUI Price Prediction: $1.35-$2.28 Range Through December as Technical Indicators Signal Mixed Outlook
SUI price prediction shows bearish short-term pressure toward $1.35 but potential recovery to $2.28 support level, with RSI oversold conditions creating buying opportunity.
SUI Price Prediction: Oversold Bounce to $2.40 Target Within 2 Weeks
SUI price prediction shows potential recovery from oversold RSI levels, targeting $2.40 short-term with critical $1.82 support holding firm amid bullish options sentiment.
SUI Price Prediction: Targeting $1.75-$2.40 Range Through December Amid Mixed Technical Signals
SUI price prediction shows consolidation between $1.75-$2.40 over the next month, with immediate resistance at $2.27 and critical support at $1.82 determining direction.
SUI Price Prediction: $1.85 Target in Two Weeks Before $4.45 Recovery by Year-End 2025
SUI faces short-term bearish pressure toward $1.85 support, but medium-term Sui forecast points to $4.45 by December 2025 amid protocol upgrades and ETF speculation.
SUI Price Prediction: Bearish Momentum Targets $1.85 Support Within Two Weeks
SUI price prediction shows bearish continuation toward $1.85-$1.90 range as technical indicators signal further downside despite recent 6.82% bounce from daily lows.
SUI Price Tests Critical Support at $2.49 as Technical Indicators Signal Oversold Conditions
Sui (SUI) trades at $2.49 following a 5.67% decline, testing key support levels while RSI drops to 35.32, suggesting potential oversold bounce as traders eye technical recovery signals.
SUI Tests Support Near Lower Bollinger Band as Technical Momentum Weakens
Sui (SUI) trades at $2.49 after modest 2% daily gain, but remains well below key moving averages as technical indicators signal continued bearish momentum despite oversold conditions.
SUI Price Drops 3% as Bitcoin's Technical Weakness Pressures Altcoin Markets
Sui (SUI) trades at $2.44 following a 3.1% decline as Bitcoin's continued weakness near support levels weighs on broader cryptocurrency sentiment, testing key technical levels.
Sui Pulls Back Despite September's 115% Rally as DeFi TVL Hits $1 Billion Milestone
SUI trades at $3.23 after a 2.31% decline, pulling back from its remarkable 115% September surge that coincided with ecosystem TVL reaching an all-time high of $1 billion. CONTENT: What Happened S...
Sui Price Action: Can $3.32 SUI Break Above Critical Resistance Amid Google Deal Momentum?
** SUI trades at $3.32 with 6.26% daily gains as Google partnership and ETF speculation fuel bullish sentiment despite mixed technical signals requiring careful analysis.
SUI Price Faces Critical Support Test at $3.07 as Bears Take Control
SUI trades at $3.13 after a 2.15% daily decline, with technical indicators pointing to potential further weakness as the token approaches key support levels.
SUI Price Falls 23% Despite Golden Cross as Technical Indicators Show Mixed Signals
SUI trades at $3.23 after a sharp 23% decline, despite forming a bullish golden cross pattern. Technical analysis reveals conflicting signals for traders.
SUI Price Drops 23% Despite Golden Cross Formation - Technical Recovery Signs Emerge
SUI trades at $3.40 with mixed signals as recent 23% decline contrasts with bullish technical indicators and improving social sentiment.
SUI Price Analysis: Security Breach Overshadows Google Partnership as Token Trades at $3.38
SUI trades at $3.38 after Cetus Protocol hack drains $223M from ecosystem, despite recent Robinhood listing and Google AP2 partnership providing earlier support.
SUI Price Drops 7.5% Despite $50M Buyback Program and Robinhood Listing
SUI trades at $3.37 after a 7.49% decline, testing key support levels despite recent positive catalysts including Robinhood listing and $900M TVL milestone.
SUI Price Surges 115% in September Despite Minor Daily Dip - Robinhood Listing Fuels Rally
SUI trades at $3.66 (-0.06% daily) after massive September gains. Robinhood listing and ecosystem growth drive bullish momentum above key moving averages.
SUI Price Analysis: Robinhood Listing Drives Optimism Despite 3.7% Daily Drop
SUI trades at $3.67 with bullish momentum indicators intact following Robinhood's official listing announcement, presenting tactical trading opportunities.
SUI Price Surge to $3.82 as Google Partnership and Binance Alpha Listing Drive Momentum
SUI trades at $3.82 (+0.32%) with strong bullish signals emerging from Google's AP2 partnership and DeAgentAI's 215% Binance Alpha surge, positioning for potential breakout.
SUI Price Surges 8.85% to $3.89 as Technical Indicators Flash Bullish Signals
SUI price jumps to $3.89 with strong bullish momentum as RSI hits 61.24 and MACD signals continuation. Key resistance at $3.91 in focus for breakout potential.
SUI Price Holds Above $3.50 Despite $2.4M Exploit - Technical Analysis Shows Mixed Signals
SUI trades at $3.56 (-0.90% today) as security breach weighs on sentiment, but treasury expansion and bullish MACD signal potential recovery ahead.
SUI Price Breaks Above $3.60 as Institutional Buybacks Signal Strong Support
SUI trades at $3.61 (+3.55%) with bullish momentum building as SUI Group completes $2M buyback and announces $50M repurchase program, creating strong institutional support.
SUI Price Drops 6.7% to $3.53 Despite Recent Institutional Surge and Robinhood Listing
SUI trades at $3.53 after a 6.7% decline, but institutional backing from $50M buyback program and Robinhood listing suggest potential bullish reversal ahead.
SUI Price Surges to $3.78 as Robinhood Listing and $50M Buyback Program Fuel Rally
SUI trades at $3.78 with strong bullish momentum following Robinhood's spot trading launch and SUI Group's massive $50M stock repurchase authorization, signaling institutional confidence.
SUI Price Surges 5.14% to $3.81 as zkLogin Launch Drives Web3 Adoption
SUI rallies to $3.81 with strong bullish momentum as Sui launches zkLogin for Google and Twitch integration, targeting $4.44 resistance with technical indicators flashing buy signals.
SUI Price Holds Steady at $3.62 Despite Massive $344M Institutional Accumulation
SUI trades flat at $3.62 while SUI Group Holdings builds $344M treasury position. Technical indicators show bullish momentum despite mixed price action.
SUI Price Breaks Above Key Moving Averages as Bullish Momentum Builds
SUI trades at $3.60 with 4.35% daily gains as technical indicators signal strengthening bullish momentum despite overbought stochastic readings.
SUI Price Soars to $3.55 as Institutional Adoption Drives Bullish Momentum
SUI trades at $3.55 with 1.42% daily gains, fueled by SUI Group's $344M treasury expansion and positive technical signals pointing to continued upside potential.
SUI Price Surges Above $3.40 as Institutional Accumulation Drives 13% Weekly Rally
SUI trades at $3.43 (+0.84% daily) with bullish momentum emerging after SUI Group's 100M token accumulation and positive technical signals across key indicators.
SUI Price Tests $3.40 Support as 100M Token Treasury Milestone Counters Unlock Pressure
SUI trades at $3.40 amid conflicting signals as treasury milestone provides bullish catalyst while token unlock creates selling pressure, with RSI at neutral 47.75.
SUI Price Drops 2.66% Despite Massive Institutional Accumulation - Key Levels to Watch
SUI trades at $3.35 after a 2.66% decline, even as SUI Group Holdings accumulates over 100 million tokens worth $344 million, creating mixed signals for traders.
SUI Price Consolidates at $3.38 as Mixed Signals Emerge from Recent Supply Release
SUI trades at $3.38 (+1.48% in 24h) following mixed week with institutional accumulation offsetting concerns from 44M token release worth $153M.
Sui (SUI) Price Analysis: Testing Support at $3.30 as RSI Shows Neutral Momentum
SUI trades at $3.30 with slight 0.18% daily gains. Technical indicators show mixed signals as RSI sits neutral at 43.83 while price tests key support levels.
SUI Price Analysis: Mixed Signals at $3.35 as Momentum Indicators Flash Warning
SUI trades at $3.35 (+2.56% in 24h) but faces bearish MACD divergence while RSI remains neutral, creating uncertainty for traders ahead of key resistance at $3.89.
** SUI Price Drops 23% Following 44 Million Token Unlock Despite Ecosystem Growth
** SUI currently trading at $3.21 after a 23% decline from token unlock, but technical indicators suggest potential oversold bounce opportunity.
SUI Price Drops 2.1% as 44 Million Token Unlock Creates Selling Pressure
SUI price sits at $3.24 after falling 2.1% in 24 hours, with technical indicators showing bearish momentum as 44 million tokens unlock today.
SUI Price Hovers at $3.32 as Analysts Debate Channel Breakdown vs. Potential Reversal
SUI trades at $3.32 (-0.75% today) near critical support as technical indicators show mixed signals while gaming adoption accelerates on Sui blockchain.
SUI Price Faces $161M Token Unlock Pressure as Support Tests $3.21
SUI trades at $3.29 (-2.29%) as $161M token unlock creates selling pressure, despite ecosystem reaching $100B stablecoin volume milestone.
SUI Price Tests Key Support at $3.37 Amid DeFi Surge and ETF Filing News
SUI trades at $3.37 (-4.28% daily) as technical indicators show mixed signals while institutional interest grows through ETF applications and DeFi activity surges.
SUI Price Tests Critical $3.45 Support as DeFi Growth Fails to Lift Token
SUI trades at $3.45 (-0.79% in 24h) as strong DeFi metrics fail to translate into price gains. Technical indicators suggest neutral momentum with key levels ahead.
SUI Price Drops 7.3% Despite Swiss Banking Partnership and ETF Filing
SUI trades at $3.55 after institutional partnerships with Sygnum Bank and potential ETF approval create mixed signals for traders.
SUI Price Surges 2.44% as Technical Indicators Flash Mixed Signals
SUI trades at $3.82 with bullish momentum above key moving averages, but MACD shows bearish divergence. Critical resistance at $4.18 could determine next move.
SUI Price Surges 20% Weekly as Bitbank Listing and $2.19B TVL Milestone Drive Momentum
SUI trades at $4.15 (+6.08% daily) following Bitbank exchange listing today and network TVL surpassing $2.19 billion, with technical indicators signaling continued bullish momentum.
SUI Price Recovers 3.4% Despite Recent $210M Token Unlock Selloff
SUI trades at $3.82 with 3.4% daily gains as technical indicators show bullish momentum despite recent token unlock pressure that drove prices down 23%.
SUI Price Faces Mixed Signals as Technical Analysis Shows Neutral RSI Despite 4.55% Decline
SUI price currently trades at $3.68 following a 4.55% decline, with technical indicators showing mixed signals as Sui's RSI remains neutral at 50.44.
SUI Price Surges to $3.86 as $450M Investment Fuels Bullish Momentum
SUI trades at $3.86 (+0.69%) following Mill City Ventures' massive $450M investment, with technical indicators showing strong bullish signals despite recent volatility.
SUI Price Faces Mixed Signals After $210M Token Unlock Despite Banking Partnership
SUI trades at $3.84 (-2.31%) as institutional partnerships battle massive token unlock effects. Technical analysis shows neutral RSI at 55.18 with key resistance at $4.44.
SUI Price Surges 3.6% as Technical Indicators Signal Continued Bullish Momentum
SUI trades at $3.93, up 3.6% in 24h, with RSI at 57.61 showing neutral momentum and strong support holding at $3.27 amid overall bullish trend signals.
SUI Price Surges 8.9% as Institutional Investment Offsets Token Unlock Impact
SUI trades at $3.79 with 8.88% daily gains as institutional adoption accelerates despite recent token unlock pressures creating mixed signals for traders.
SUI Price Eyes $7 Breakout Despite Token Unlock Pressure - Technical Analysis Points Higher
SUI trades at $3.46 (+3.65%) as analysts predict bullish triangle breakout to $7, though recent 44M token unlock creates near-term volatility concerns for traders.
** SUI Price Drops 23% After $210M Token Unlock Despite Strong Institutional Interest
** SUI trades at $3.46 with mixed signals as massive token unlock pressures price, but $500M institutional investment and ETF filing signal long-term bullish potential.
SUI Price Drops 23% Following $210M Token Unlock – Technical Recovery Signals Emerge
SUI trades at $3.42 after massive token unlock triggered selloff, but technical indicators suggest potential oversold bounce as ecosystem fundamentals remain strong.
** SUI Price Drops 23% as $210M Token Unlock Triggers Major Selloff
** SUI trades at $3.49 after plunging from $4.20+ highs following massive token unlock. Technical indicators show oversold conditions with potential bounce signals emerging.
SUI Price Drops 10% as $128M Token Unlock Sparks Selling Pressure
SUI trades at $3.48 (-10.18%) following yesterday's 44 million token unlock worth $128M, while technical indicators show mixed signals near key support levels.
SUI Price Breaks $4.05 Resistance With 100% Rally Target in Sight
SUI trades at $3.85 after breaking key resistance on massive volume surge. Analysts eye $8 target as ecosystem TVL hits record $2.3B and SEC reviews ETF proposal.
SUI Price Falls 5% as $450M Institutional Investment Battles Dollar Strength
SUI trades at $3.72 after a 5.07% daily decline, despite Mill City Ventures' massive $450M treasury commitment signaling strong institutional confidence in the altcoin.
SUI Price Drops 8% to $3.96 as SEC Delays ETF Decision and Dollar Strength Pressures Market
SUI trades at $3.96 after an 8.15% decline, facing pressure from SEC ETF delays and dollar strength despite record $2.28B TVL milestone.
SUI Price Drops 9.2% Despite Strong Bullish Technical Trend - Key Levels to Watch
SUI price currently trades at $3.95 after a sharp 9.24% decline, but technical indicators suggest underlying strength with bullish momentum signals emerging.
SUI Price Surges to $4.17 as ETF Hopes Drive 53% Weekly Rally
SUI trades at $4.17 (+2.81% today) after SEC reviews ETF proposal, triggering massive institutional interest and pushing token near all-time highs.
SUI Price Surges 10% to $3.98 as SEC Reviews Spot ETF Proposal
SUI trades at $3.98 (+10.09% daily) following SEC's review of Canary Capital's spot ETF proposal. Technical breakout confirms bullish momentum toward $7 target.
SUI Price Surges Toward $4 as SEC ETF Review Sparks 53% Rally
SUI trades at $3.62 after 53% surge following SEC's review of Canary Capital's spot SUI ETF proposal, with technical indicators showing mixed signals ahead of key resistance.
SUI Price Surges 4.65% to $3.85 as Technical Indicators Flash Bullish Signals
Sui (SUI) trades at $3.85 with strong momentum as RSI hits neutral zone and moving averages signal continued upward pressure for the Layer-1 blockchain token.
Sui Price Surges to $3.99 as TVL Rebounds Above $2 Billion
SUI price climbs 3.06% to $3.99 with bullish momentum as Sui network TVL recovers to $2.19 billion and daily active users surge 145%, positioning SUI near key resistance levels.
Sui (SUI) Surges Past $3.85 as TVL Hits $2.19B and Daily Users Jump 145% - Price Targets $5
Sui's impressive recovery sees TVL climb above $2B while daily active users surge 145%, driving bullish momentum toward potential $5 price target with strong technical indicators.
Sui (SUI) Eyes $4 Breakout as TVL Surges Above $2B: Technical Analysis and Q3 2025 Price Targets
Sui's TVL recovery to $2.19B and 36% weekly surge position SUI for potential $4 breakout. Analysts target $5 by Q3 2025 amid strong institutional adoption.
Sui (SUI) Gains Momentum with Record TVL but Faces Short-Term Bearish Signals
Sui (SUI) surged 35.4% this month, hitting record TVL of $2.219 billion. Despite bullish momentum, technical indicators highlight short-term bearish risks.
Sui (SUI) Surges to $4: Strong Bullish Momentum and Key Technical Insights
Sui (SUI) is trading at $4.00, gaining 0.27% in the past 24 hours. With bullish technical indicators, SUI eyes resistance at $4.11 while traders anticipate further momentum.
Sui (SUI) Price Rally: Google Cloud Partnership, $5 Price Target, and DeFi Expansion
Sui (SUI) surges on Google Cloud partnership and institutional adoption, with analysts targeting $5. DeFi TVL grows 480% as technical indicators signal bullish momentum.
Sui (SUI) Rally Gains Momentum: Price Targets $5 Amid DeFi Growth and Institutional Support
Sui (SUI) has surged 20% this week, fueled by DeFi expansion and institutional adoption. Analysts predict a $5 target by Q3 2025 as bullish momentum strengthens.
Sui (SUI) Surges on Institutional Adoption and DeFi Growth: Price Target $5 in Sight
Sui (SUI) has experienced a 20% price surge, fueled by institutional adoption, DeFi growth, and bullish technical indicators. Analysts predict a $5 target by Q3 2025.
Sui (SUI) Surges on Institutional Adoption and Bullish Momentum: Price Target $5 in Q3 2025
Sui (SUI) gains 20% this week as institutional adoption, DeFi growth, and bullish technical upgrades drive momentum. Analysts predict $5 by Q3 2025 amid robust ecosystem expansion.
Sui (SUI) Surges 20% in a Week: Adoption and Breakout Potential Drive Momentum
Sui (SUI) gained 20% this week, fueled by institutional adoption, technical upgrades, and a bullish breakout pattern. Could SUI hit $5 soon? Read the latest analysis.
SUSHI Price Posts Significant Leap Amid GoldenTree’s $5.3M Stake in Sushiswap
SUSHI’s trajectory appears promising. It is important to look at why the price is rising, unlike other crypto prices.
Technical Analysis: Jasmy Coin Price Movements Indicate Bullish Potential
Jasmy Coin has breached its descending trend line and is currently near the 99-day MA. If it sustains above these levels, it could set the stage for a bullish trend, offering lucrative returns for traders and investors.
Understanding SMA vs EMA: Essential Tools for Trend Trading
Explore the differences between Simple and Exponential Moving Averages, key indicators for traders. Learn how these tools can help identify market trends and improve trading strategies.
Mastering Volatility: How Average True Range (ATR) Guides Trading Decisions
Explore how Average True Range (ATR) can enhance your trading strategy by providing insights into market volatility, risk management, and setting profit targets.
Will Terra’s UST and LUNA Crash Cause a Shift to ‘Cryptos that have Stood the Test of Time’?
LUNA has left crypto enthusiasts' mouths agape because they could never imagine in their wildest dreams that one of the top ten cryptocurrencies could collapse to near-zero overnight.
Tether Regains $1 Peg
Tether (USDT) has regained its 1-to-1 peg with the dollar after briefly dropping to 94.55 cents, its lowest since December 2020.
Tezos Price Scoop: XTZ/BTC Bounces from Support as Indicators Show Exhausting Selling Pressure
On Tuesday, during opening trading hours, Tezos's price opened at 1898 satoshis, trading later at a gain of +3.96% at 1970 satoshis. Around 279 million worth of Tezos tokens exchanged hands of the volume during the trading session. Tezos is trading between a daily range of 1891 satoshis to 1985 satoshis.
TIA Price Finds Support at $1.07 Despite Bitcoin Volatility as Technical Indicators Signal Mixed Momentum
Celestia (TIA) trades at $1.07 with 1.52% daily gains, showing resilience amid Bitcoin's recent price swings while technical analysis reveals conflicting signals for near-term direction.
TIA Tests Key $1.00 Support as Oversold Conditions Build Amid Crypto Market Weakness
Celestia (TIA) trades at $0.99, down 1.3% as technical indicators signal oversold territory while the token approaches critical psychological support levels.
TIA Breaks Below Key Support as Celestia Tests 52-Week Lows Amid Crypto Market Weakness
Celestia (TIA) drops to $1.02, approaching its 52-week low of $0.93 as technical indicators signal continued downside pressure in the absence of major catalysts.
Breaking: Celestia Shows Divergent Signals as TIA Price Holds Above Critical Support
TIA price trades at $1.41 with mixed technical signals while displaying unique resilience compared to broader altcoin weakness in today's market session.
Celestia (TIA) Price Analysis: Testing Critical Support at $1.38 Amid Bearish Momentum
TIA price drops to $1.38 (-0.36% in 24h) as Celestia tests crucial support levels. RSI signals potential oversold conditions while technical indicators show mixed signals.
Celestia (TIA) Tests Critical Support at $1.40 as Technical Indicators Signal Bearish Momentum
TIA price drops 4.05% to $1.42, touching Bollinger Band support with RSI at 34.39. Key support at $1.40 under pressure as bearish signals intensify.
Celestia (TIA) Tests $1.42 Support as Bearish Momentum Intensifies
TIA price drops to $1.48 (-0.40% today) testing critical support levels. Celestia's RSI at 37.70 signals oversold conditions may be approaching.
Celestia (TIA) Price Drops to $1.50 as Technical Indicators Flash Mixed Signals
TIA price currently at $1.50 (-1.05% in 24h) with RSI at neutral 37.98. Celestia tests Bollinger Band support as traders watch key $1.43 level.
Celestia (TIA) Price Drops 12% as Bears Target $1.43 Support Level
TIA price falls to $1.50 amid bearish momentum, with technical indicators suggesting further downside risk as traders watch critical support at $1.43.
Celestia (TIA) Tests Critical $1.50 Support as Bears Dominate After 18% Weekly Rally
TIA price drops to $1.71 (-0.35%) as bears test key support levels. RSI at 48.85 signals neutral momentum while critical $1.50 support zone comes into focus.
Celestia (TIA) Price Struggles at $1.71 as Bears Test Support Levels
TIA price drops 4.58% to $1.71 amid neutral technical signals. RSI at 48.55 suggests consolidation phase while key support holds at $1.50.
Celestia (TIA) Consolidates After 18% Weekly Rally - Key Support Test Ahead
TIA trades at $1.78 (-1.49% today) after surging 18% this week. Technical indicators show consolidation phase with critical support at $1.50 being tested.
Celestia (TIA) Rallies 7.66% as Bulls Test Key Resistance at $1.94
TIA price surges to $1.81 with bullish momentum indicators flashing green, but faces critical resistance ahead as RSI holds neutral territory.
Celestia (TIA) Price Hovers Near $1.68 as Neutral Momentum Builds
TIA price trades at $1.68 with mixed signals as Celestia's RSI sits neutral while MACD shows bullish momentum, creating uncertainty for traders.
Celestia (TIA) Price Analysis: Technical Upgrade Sparks Recovery to $1.72
TIA trades at $1.72 (+2.81%) following V6 upgrade announcement and 16% rebound. Neutral RSI at 49.65 suggests consolidation before next move.
Celestia (TIA) Price Struggles at $1.71 as Technical Signals Show Mixed Direction
TIA price drops 4.74% to $1.71 amid neutral technical indicators. Celestia technical analysis reveals key support at $1.50 with RSI suggesting potential consolidation ahead.
Celestia (TIA) Price Drops 4.83% as Technical Indicators Signal Mixed Outlook
TIA trades at $1.79 with bearish momentum despite bullish MACD signals. Key support at $1.50 becomes critical as Celestia faces resistance near $1.94.
Celestia (TIA) Surges 5.15% as Bulls Eye $2 Resistance Level
TIA price climbs to $1.88 with strong bullish momentum as technical indicators signal potential breakout above key resistance levels.
Celestia (TIA) Tests Upper Resistance at $1.84 as Bulls Regain Control
TIA price climbs 2.68% to $1.80, approaching key resistance with RSI at 55.85 signaling potential bullish momentum in neutral territory.
Celestia (TIA) Price Consolidates Near $1.78 as Technical Indicators Flash Mixed Signals
TIA price trades at $1.78 with -0.45% daily decline. Celestia technical analysis reveals bullish MACD momentum despite neutral RSI, testing key pivot levels.
Celestia (TIA) Surges 6% as V6 Upgrade Timeline Sparks Rally
TIA price jumps to $1.82 (+6.12%) following Celestia's V6 upgrade announcement and recent core improvements, with technical indicators showing bullish momentum emerging.
TIA Price Surges 4.56% as Celestia Tests Key Resistance Near $1.70
Celestia (TIA) rallies to $1.70 with bullish momentum emerging as technical indicators signal potential breakout above immediate resistance levels.
Celestia (TIA) Rebounds 16% After Failed Breakout - Can Bulls Hold $1.66?
TIA price recovers to $1.66 (+4.53%) following this week's dramatic 16% rally, but technical indicators suggest caution as resistance levels loom ahead.
Celestia (TIA) Hovers Near $1.60 as Technical Indicators Show Mixed Signals
TIA price trades at $1.60 with slight 0.31% gains, but technical analysis reveals neutral momentum as Celestia tests critical support levels around $1.50.
Celestia (TIA) Consolidates Near $1.61 as Technical Indicators Signal Mixed Outlook
TIA price holds at $1.61 with +1.71% daily gains while technical analysis reveals neutral momentum amid bearish medium-term trend pressure from moving averages.
Celestia (TIA) Trades Near Crucial Support as Bearish Momentum Builds
TIA price drops 1% to $1.59, hovering dangerously close to key $1.50 support level. Technical indicators suggest further downside pressure ahead.
Celestia (TIA) Price Analysis: Consolidation Near Support as Bulls Await Catalyst
TIA price trades at $1.62 (+3.79% daily) in neutral territory. Celestia technical analysis reveals mixed signals with RSI at 45 and key resistance at $1.91.
Celestia (TIA) Price Hovers Near Support at $1.59 as Bears Test Key Levels
TIA trades at $1.59 with mixed signals as Celestia's RSI sits neutral while price approaches critical $1.50 support zone amid subdued momentum.
TIA Price Analysis: Celestia Faces Key Support Test at $1.55 Amid Mixed Technical Signals
Celestia (TIA) trades at $1.65 with neutral RSI at 46.06 as the token approaches critical support levels. Technical indicators show mixed signals for short-term direction.
Celestia (TIA) Tests Critical Support at $1.65 After 12% Weekly Decline
TIA price drops to $1.65 (-1.14% today) as bears challenge key support levels despite recent Lotus upgrade and Kraken staking integration.
Celestia (TIA) Tests Support at $1.63 as Bears Maintain Control
TIA price drops to $1.63 (-0.61% in 24h) as technical indicators flash neutral signals with Celestia's RSI at 44.42 and price approaching key support levels.
TIA Price Drops 5.86% as Celestia Tests Key Support at $1.59
Celestia (TIA) trades at $1.64 after a 5.86% decline, approaching critical support levels with bearish momentum building across key technical indicators.
Celestia (TIA) Price Analysis: Neutral Momentum as Token Tests Key Support Levels
TIA trades at $1.71 with modest 0.35% gains despite bearish technical signals. Key support at $1.59 crucial for preventing deeper correction toward $1.54.
Celestia (TIA) Price Analysis: Technical Indicators Signal Mixed Outlook as Bears Test Support
TIA price drops 5.48% to $1.76 amid neutral technical signals. Key support at $1.54 being tested while MACD shows early bullish divergence.
Celestia (TIA) Price Surges 5% as Technical Indicators Flash Mixed Signals
TIA price climbs to $1.86 with bullish momentum emerging, though key resistance at $2.04 poses immediate challenge for continued upside movement.
TIA Price Drops 12% Despite Recent Breakout - Celestia Faces Critical Support Test
Celestia (TIA) trades at $1.78 after an 11.97% decline, testing key support levels despite recent bullish momentum from network upgrades and technical breakouts.
Celestia (TIA) Surges 9.59% as Bulls Reclaim $1.89 Support Level
TIA price climbs to $1.89 with strong bullish momentum, breaking above key moving averages as technical indicators signal potential reversal from recent lows.
Celestia (TIA) Price Drops 6.7% as Technical Indicators Flash Mixed Signals
TIA price falls to $1.71 amid bearish momentum, but key support levels may provide buying opportunities for risk-tolerant traders.
TIA Price Recovers to $1.83 as Celestia Shows Early Bullish Momentum Despite Recent Selloff
Celestia (TIA) trades at $1.83 with 4.10% daily gains after testing $1.60 support, but faces key $2.16 resistance that triggered last week's 6.3% decline.
Celestia (TIA) Price Fights for $1.65 Support as Technical Indicators Signal Potential Reversal
TIA trades at $1.78 (-3.48% today) while battling key support levels. Recent failed breakout and tokenomics concerns weigh on sentiment despite emerging bullish signals.
Celestia (TIA) Fights for $1.82 as RSI Signals Potential Recovery From Support Test
TIA price surged 3.88% to $1.82 after defending key $1.60 support, with neutral RSI at 51.51 suggesting bulls may be regaining control following recent volatility.
Celestia (TIA) Fights to Hold $1.65 as Technical Indicators Signal Potential Reversal
TIA price currently trades at $1.65 (+2.29% today) after testing crucial $1.60 support levels, with RSI showing neutral momentum amid recent bearish pressure.
Celestia (TIA) Price Plunges to $1.62 Following Failed Resistance Break and Token Unlock Pressure
TIA price drops to $1.62 after failing to break $2.16 resistance, with 90% decline from 2024 peak due to aggressive token unlocks creating sustained selling pressure.
Celestia (TIA) Battles $1.60 Support After Failed $2.16 Breakout Triggers Selloff
TIA price trades at $1.64 (+1.48%) as technical indicators show mixed signals following last week's failed resistance break that led to a 6.3% decline.
Celestia (TIA) Struggles at $1.62 After Failed $2.16 Breakout Triggers Sharp Selloff
TIA price drops to $1.62 following failed resistance break, with bearish technical signals emerging despite Celestia Foundation's $62.5M token acquisition.
Celestia (TIA) Drops to $1.62 After Failed $2.16 Breakout Triggers Selling Wave
TIA trades at $1.62 (-2.35% daily) following failed resistance breakout, despite Foundation's $62.5M token purchase and upcoming Lotus upgrade reducing inflation by 33%.
Celestia (TIA) Tests Support at $1.63 as Technical Indicators Flash Mixed Signals
TIA trades at $1.63 after a 7.55% daily decline, testing key support levels as RSI holds neutral ground despite recent Bithumb suspension concerns.
Celestia (TIA) Price Analysis: Testing Critical Support Levels as Bearish Momentum Builds
TIA price trades at $1.83, up 0.49% but facing bearish MACD signals and key resistance at $2.29. Technical analysis reveals mixed signals with RSI neutral.
Celestia (TIA) Plunges 12.6% as Bears Target $1.73 Support Level
TIA price drops to $1.75 amid bearish momentum, with technical indicators suggesting further downside risks as the token approaches critical support zones.
Celestia (TIA) Technical Analysis Shows Neutral Momentum Despite Foundation's $62.5M Token Acquisition
TIA price trades at $2.00 (-3.72% in 24h) as Celestia Foundation's Polychain acquisition and staking rewards revamp fail to spark immediate bullish momentum.
Celestia (TIA) Price Surges 3.10% to $1.99 Despite Mixed Technical Signals
TIA price climbs to $1.99 with 3.10% daily gains as momentum indicators show conflicting signals near critical resistance at $2.29
Celestia (TIA) Surges 6.16% Amid Mixed Market Signals - Technical Breakout vs Foundation Sell-off
TIA trades at $1.93 (+6.16% daily) as bullish technical momentum conflicts with Polychain Capital's $62.5M token sale to Celestia Foundation.
Celestia (TIA) Shows Mixed Signals at $1.82 - Key Support Test Looms
TIA price holds at $1.82 with neutral RSI, but MACD signals potential weakness. Critical support at $1.47 faces test as bears eye deeper correction.
Celestia (TIA) Pulls Back to $1.88 After Integration News Boost - Critical Support Test Ahead
TIA price drops 4.32% to $1.88 despite major Ethereum rollup integration, testing key $1.87 pivot level with neutral RSI signaling potential reversal zone.
Celestia (TIA) Breaks Above $2.20 as Bullish Momentum Builds
TIA price surges 3.35% to $2.22, testing key resistance at $2.29 with RSI at 67.55 and strong MACD signals indicating potential breakout ahead.
Celestia Price Surges 7.59% as TIA Breaks Above Key Technical Resistance
TIA price jumps to $2.18 with bullish momentum emerging. Technical indicators signal potential continuation as Celestia tests upper Bollinger Band resistance.
TON Price Prediction: $2.05-$2.15 Target by January 2026 as Technical Indicators Signal Recovery
Toncoin shows bullish momentum with MACD histogram turning positive and RSI in neutral zone, targeting $2.05-$2.15 recovery within 30 days based on technical analysis.
TON Price Prediction: Targeting $2.15 Recovery Within 7 Days on Bullish MACD Signal
Toncoin shows bullish momentum with MACD histogram turning positive. Technical analysis suggests TON could reach $2.15 short-term target as RSI exits oversold zone.
TON Price Prediction: $2.05 Target Within 5 Days as Technical Momentum Builds
Toncoin shows bullish momentum signals with MACD histogram turning positive, targeting $2.05 (+26.5%) short-term despite current consolidation at $1.62.
TON Price Prediction: Targeting $2.28 Recovery Within 5 Days as Technical Indicators Signal Oversold Bounce
Toncoin technical analysis reveals bullish MACD momentum targeting $2.28 (+39%) within 5 days, with analysts projecting $2.04-$2.51 range for December recovery rally.
TON Price Prediction: Toncoin Targets $2.04-$2.51 by Mid-December 2025
Toncoin technical analysis suggests 29-59% upside potential to $2.04-$2.51 price targets within the next 1-2 weeks, supported by bullish MACD momentum and analyst consensus.
TON Price Prediction: Bullish Recovery to $2.28 Target by Year-End 2025
Technical analysis suggests TON could rally 40% to $2.28 by December 2025, with MACD momentum turning bullish despite neutral RSI at 42.91.
TON Price Prediction: $2.28 Target Within 30 Days as Technical Indicators Signal Recovery
TON price prediction shows bullish momentum building toward $2.28 medium-term target as oversold conditions and positive MACD histogram suggest potential 43% rally from current $1.60 level.
TON Price Prediction: Toncoin Targets $2.05-$2.28 Recovery Within 4-6 Weeks
TON price prediction points to 37-53% upside potential as oversold conditions and bullish MACD divergence signal Toncoin recovery toward $2.05-$2.28 range by January 2026.
TON Price Prediction: Targeting $2.70 by December 2025 Despite Current Weakness
Toncoin shows bullish signals at $1.50 despite recent decline, with analysts targeting $2.70 within a month as key resistance at $2.09 becomes crucial for the next rally phase.
TON Price Prediction: Toncoin Eyes $2.28 Recovery Target Within 30 Days as Technical Indicators Signal Bullish Reversal
TON price prediction points to $2.28 medium-term target as oversold conditions and bullish MACD momentum suggest potential 38% rally from current $1.65 levels.
TON Price Prediction: Toncoin Targets $2.28 by December 2025 as Technical Indicators Signal Bullish Reversal
Toncoin shows bullish momentum with MACD histogram turning positive and oversold RSI at 36.88. Analysts predict TON could reach $2.28 within 30 days, with immediate resistance at $1.95.
TON Price Prediction: Recovery to $2.28 Expected by December 2025
Technical indicators suggest TON could reach $2.28 within 30 days, with immediate resistance at $1.95. Current oversold conditions support bullish reversal.
TON Price Prediction: Oversold Bounce to $2.10 Target by December 2025
TON price prediction shows potential 39% rally from current oversold levels to $2.10, with critical $1.79 support holding and RSI at extreme 24.23 reading.
TON Price Prediction: Recovery to $2.05-$2.28 Expected by December 2025
Toncoin forecast suggests 37-52% upside potential as TON bounces from oversold RSI levels, targeting $2.05-$2.28 range within 4-6 weeks based on technical analysis.
TON Price Prediction: Target $2.50-$2.70 as Oversold Conditions Signal Potential 48-60% Rally
Toncoin oversold at $1.69 with RSI at 29.73 suggests potential bounce to $2.50-$2.70 medium-term targets, but must hold $1.65 support for bullish reversal.
TON Price Prediction: Recovery Rally to $2.50-$2.70 Expected by December 2025
Toncoin technical analysis suggests potential 39-50% upside to $2.50-$2.70 range despite current bearish momentum, with critical support holding at $1.75-$1.79.
TON Price Prediction: Targeting $2.50-$2.70 Recovery by December 2025 Despite Current Weakness
TON price prediction suggests potential 37-48% upside to $2.50-$2.70 by December 2025, despite current bearish momentum. Critical support at $1.75 must hold for bullish continuation.
TON Price Prediction: Target $2.70 by December 2025 Despite Current Consolidation
Toncoin forecast shows potential 46% rally to $2.70 target despite bearish momentum, with critical $1.79 support level determining near-term direction for TON price prediction.
TON Price Prediction: $2.50 Target by December 2025 as Technical Indicators Signal Recovery
TON price prediction shows potential 27% upside to $2.50 by December 2025, with technical analysis revealing bullish MACD divergence despite current weakness at $1.96.
TON Price Prediction: Targeting $2.50-$3.50 Recovery by December Amid Technical Consolidation
Toncoin shows early bullish momentum with MACD histogram turning positive. Technical analysis suggests TON could reach $2.50-$3.50 in the next 4-6 weeks if it breaks key resistance.
TON Price Prediction: $2.50 Target in Focus as Analysts Eye 25% Upside by December
TON price prediction shows potential 25% rally to $2.50-$2.66 range within 30 days, with long-term Toncoin forecast targeting $8.00 amid improving technical momentum signals.
TON Price Prediction: Targeting $2.57 Short-Term Despite Mixed Analyst Sentiment
TON price prediction shows potential 22% upside to $2.57 within 5 days, while Toncoin forecast suggests $8.00 long-term target if key resistance breaks.
TON Price Tests Technical Support at $2.24 as Bearish Momentum Builds Following Weekend Volatility
Toncoin trades at $2.24, down 0.5% as RSI drops to 37, signaling potential further weakness after weekend's volatile session between $2.18-$2.29 amid broader crypto market uncertainty.
TON Price Tests Key Support at $2.15 as Crypto Market Correlation Weakens
Toncoin trades at $2.15 following broader crypto weakness, with technical indicators showing oversold conditions as TON price decouples from Bitcoin's recent performance patterns.
TON Tests Key Support at $2.14 as Inflation Fears Weigh on Risk Assets
Toncoin trades at $2.14 after declining 0.9% amid broader crypto selloff triggered by higher-than-expected US inflation data, with technical indicators pointing to oversold conditions.
TON Trading Update: Toncoin Tests Oversold Territory While Major Altcoins Rally
TON price sits at $2.71 (+0.78%) as Toncoin technical analysis reveals oversold RSI conditions near critical support levels, creating potential reversal opportunity.
TON Price Drops to $2.69 as Toncoin Tests Critical Support Levels
Toncoin trades at $2.69 (-1.14% in 24h) with TON RSI at oversold 27.92, approaching key $2.58 support amid bearish momentum signals.
TON Price Plunges Below $2.80 as Toncoin Shows Oversold Signals
Toncoin trades at $2.79 (-1.03%) with RSI hitting oversold levels at 26.23, suggesting potential bounce from current support zone.
Toncoin (TON) Hits Oversold Territory at $2.83 - Bullish Reversal Signals Emerge
TON price trades at $2.83 with RSI at 29.07 indicating oversold conditions. Technical analysis suggests potential bounce from key support levels.
TON Price Drops to $2.81 as Toncoin RSI Hits Oversold Territory
Toncoin trades at $2.81 (-0.21% daily) with TON RSI at 26.64 signaling oversold conditions. Technical indicators suggest potential bounce from current support levels.
Toncoin (TON) Plunges to Oversold Territory as Bears Take Control
TON price crashes 8.24% to $2.82, hitting oversold RSI levels while testing critical support at $2.58 amid broader crypto market weakness.
Toncoin (TON) Faces Bearish Pressure as RSI Signals Neutral Territory at $3.08
TON trades at $3.08 (-0.71% in 24h) with RSI at 41.55 showing neutral momentum. Technical indicators suggest mixed signals ahead of key support test.
TON Price Struggles at $3.10 as Technical Indicators Signal Mixed Momentum
Toncoin trades at $3.10 with a 1.90% decline, showing weak bullish signals despite neutral RSI at 42.69 and emerging MACD divergence patterns.
TON Price Analysis: Toncoin Shows Weak Bullish Momentum at $3.15 Despite Neutral Market Signals
Toncoin trades at $3.15 with modest 0.35% gains, displaying weak bullish momentum as TON RSI remains neutral while MACD signals potential upside reversal.
TON Price Holds Steady at $3.15 Amid Mixed Technical Signals
Toncoin trades at $3.15 with modest 0.48% daily gains as TON RSI sits in neutral territory while MACD shows early bullish momentum signs.
TON Price Slips to $3.11 as Technical Indicators Signal Mixed Outlook for Toncoin
TON price drops 1.77% to $3.11 amid neutral RSI readings, while MACD shows early bullish momentum despite overall weak market sentiment for Toncoin traders.
TON Price Holds Above Key Support as Technical Indicators Signal Potential Reversal
Toncoin trades at $3.18 with +1.31% daily gains as TON RSI shows neutral momentum and MACD histogram turns bullish, suggesting consolidation near critical support levels.
Toncoin (TON) Consolidates at $3.16 as Technical Indicators Signal Mixed Momentum
TON price holds at $3.16 despite 1.8% daily decline, with RSI at 47.42 suggesting neutral territory while MACD histogram shows emerging bullish momentum for traders.
TON Price Holds Above $3.20 as Toncoin Shows Mixed Technical Signals
Toncoin trades at $3.21 (-1.26% today) with RSI neutral at 51.90. Technical indicators suggest bullish momentum despite recent consolidation.
TON Price Analysis: Toncoin Shows Bullish Momentum Above Key Moving Averages
TON trades at $3.25 (+1.82% daily) with technical indicators signaling potential upside as Toncoin breaks above critical resistance levels.
TON Price Analysis: Toncoin Shows Bullish Momentum Above $3.20 Support
Toncoin (TON) trades at $3.20 with 0.91% daily gains. Technical indicators suggest bullish momentum as TON RSI holds neutral territory while MACD shows positive divergence.
TON Price Holds $3.12 Support as Coinbase Ventures Investment Sparks Institutional Interest
Toncoin trades at $3.12 (+1.23%) following Coinbase Ventures' investment, while technical indicators show neutral momentum with key support at $3.00 level.
Toncoin (TON) Trades at $3.12 as Technical Indicators Signal Mixed Momentum
TON price holds at $3.12 with neutral RSI at 45.11 despite recent Telegram AI integration volatility. Technical analysis reveals key resistance at $3.44.
TON Price Struggles at $3.08 as Technical Indicators Flash Mixed Signals
Toncoin trades at $3.08 with bearish momentum indicators despite RSI showing neutral territory. Key support at $3.00 becomes critical for TON bulls.
TON Price Holds $3.00 Support Amid Mixed Technical Signals - Toncoin Analysis
Toncoin trades at $3.09 (+1.48%) testing critical support levels. TON RSI at 42 suggests potential bounce while MACD shows bearish momentum continues.
TON Price Drops 3.5% to $3.01 as Toncoin Tests Critical Support Levels
Toncoin (TON) trades at $3.01 after a 3.49% daily decline, with technical indicators showing bearish momentum as the token approaches key support zones.
TON Price Drops 1.36% as Toncoin Shows Mixed Signals at $3.12
Toncoin trades at $3.12 with bearish momentum emerging despite neutral RSI readings. Key support at $3.02 becomes critical for TON bulls.
TON Price Analysis: Toncoin Holds $3.17 Support Amid Neutral RSI Signals
TON price trades at $3.17 with 1.05% daily gains as Toncoin technical analysis reveals neutral momentum despite bearish MACD signals pointing to potential consolidation.
TON Price Holds Above $3 as Technical Indicators Signal Mixed Momentum
Toncoin trades at $3.15 with 1.09% daily gains, but technical analysis reveals conflicting signals as TON tests key support levels around $3.02.
TON Price Analysis: Toncoin Tests Support at $3.10 Amid Bearish Momentum
Toncoin trades at $3.10 down 0.83% as TON RSI hits 41.93 in neutral territory while MACD signals bearish momentum ahead of key support test.
TON Price Holds Above $3 as Technical Indicators Signal Neutral Territory
Toncoin trades at $3.17 with modest 1.12% gains while RSI remains neutral at 44.73, setting up potential breakout above key resistance levels.
TON Price Struggles Below Key Moving Averages as Bearish Momentum Builds
Toncoin trades at $3.13 with weak bullish trend signals, while TON RSI sits neutral at 42.70 amid declining momentum indicators pointing to potential downside.
Toncoin (TON) Consolidates Near $3.00 Support as Technical Indicators Flash Mixed Signals
TON price trades at $3.08 with minimal 24h movement while RSI sits at 39.76 in neutral territory. Bollinger Bands suggest potential support test ahead.
TON Price Drops 3.78% as Toncoin Tests Lower Bollinger Band Support at $3.08
TON price falls to $3.08 amid bearish momentum, with Toncoin's RSI at 39.54 signaling potential oversold conditions as it approaches critical support levels.
TON Price Drops 15% Testing Critical Support at $3.09 - Recovery Rally Possible
Toncoin trades at $3.17 after a volatile week that saw a 15% decline followed by an 8.15% recovery. Technical indicators suggest mixed signals as TON tests key support levels.
TON Price Holds Above $3.30 as Technical Indicators Signal Mixed Momentum
Toncoin (TON) trades at $3.37 after a 3.30% daily decline, with RSI neutral at 50.57 and key support at $3.14 coming into focus for traders.
TON Price Breaks Above $3.49 as $558M Institutional Buy Program Fuels Bullish Momentum
Toncoin trades at $3.49 (+0.09%) approaching key $3.55 resistance as massive institutional investment drives 20% monthly gains and technical indicators flash bullish signals.
Toncoin (TON) Price Consolidates at $3.43 Despite Recent Ecosystem Wins
TON trades at $3.43 (-3.11% daily) as profit-taking follows major Binance listing and Telegram integration news, but technical analysis suggests bullish momentum remains intact.
Toncoin (TON) Surges 4.2% as Price Tests Key Resistance at $3.75
TON trades at $3.58 with bullish momentum intact. Technical indicators suggest potential breakout above $3.75 resistance as Telegram integration drives adoption.
TON Price Holds $3.39 Despite Market Pullback as Telegram Integration Sparks Bullish Outlook
Toncoin trades at $3.39 with -1.22% daily decline, but strong technical foundation and Telegram's deeper blockchain integration plans support bullish momentum ahead.
Toncoin (TON) Eyes $4 Breakthrough as VERB's $558M Investment Fuels Bullish Momentum
TON trades at $3.40 (+0.68%) as institutional investment and Binance listing drive strong bullish sentiment toward key resistance at $3.75.
TON Price Surges 0.87% as Telegram Integration Plans Fuel Bullish Momentum
Toncoin trades at $3.38 with 0.87% daily gains as Telegram's blockchain integration confirms strong technical signals pointing to further upside potential.
Toncoin (TON) Consolidates at $3.35 as Telegram Integration Drives Adoption
TON price holds steady at $3.35 despite 0.74% daily decline. Telegram's deeper blockchain integration plans fuel long-term bullish outlook for Toncoin.
Toncoin (TON) Rebounds to $3.38 as Telegram Integration Projects Fuel Bullish Momentum
TON trades at $3.38 with 1.84% daily gains, showing strong bullish signals after ecosystem funding boost drives 38% weekly surge amid growing Telegram adoption.
Toncoin (TON) Shows Bullish Momentum as Price Climbs 4.48% to $3.29
TON price surges 4.48% to $3.29 with neutral RSI and bullish overall trend, presenting key trading opportunities at current support levels.
Toncoin (TON) Consolidates Near $3.58 as Bulls Eye $4 Breakout Target
TON trades at $3.58 (-1.13% daily) with strong bullish momentum intact despite minor pullback. Technical indicators suggest potential push toward $4 resistance.
TON Price Surges Above $3.60 as Technical Indicators Flash Strong Bullish Signals
Toncoin trades at $3.62 (+0.33% in 24h) with TON RSI at 69.23 and price action testing upper Bollinger Band resistance, signaling potential continuation of bullish momentum.
TON Price Surges 6.15% as Toncoin Tests Key Resistance at $3.72
Toncoin trades at $3.61 after a 6.15% daily gain, with TON RSI approaching overbought territory as bulls target the $3.72 resistance level.
TON Price Holds $3.52 Support as Technical Indicators Flash Mixed Signals
Toncoin trades at $3.52 with RSI at 66.18 showing neutral momentum, while MACD signals bullish divergence despite 0.93% daily decline.
Toncoin (TON) Surges to $3.45 as Telegram Wallet Integration Drives Price Rally
TON price climbs to $3.45 with 1.11% gains as Telegram's new crypto wallet features spark bullish momentum, while technical indicators show strong uptrend potential.
TON Price Rallies 3.63% Despite Recent Ecosystem Delays as Bulls Target $3.59 Resistance
Toncoin recovers to $3.37 with bullish momentum emerging despite ecosystem upgrade delays. TON RSI signals neutral territory as bulls eye key resistance.
TON Price Drops 4.6% as Toncoin Tests Critical Support Levels
Toncoin (TON) trades at $3.28 after a 4.6% decline, but technical indicators suggest potential bullish momentum despite bearish market conditions.
TON Price Analysis: Bullish Momentum Builds Despite 0.45% Daily Decline
Toncoin trades at $3.29 with TON RSI at 61.98 showing neutral momentum. Technical indicators suggest bullish bias despite minor daily correction.
Toncoin (TON) Surges 7% as Technical Indicators Signal Bullish Momentum
TON price jumps to $3.31 with strong volume and bullish MACD crossover, approaching key resistance at $3.59 as momentum indicators strengthen.
TON Price Hovers Near Key Support at $3.09 as Bullish Momentum Builds
Toncoin trades at $3.09 (-2.43% today) but shows bullish MACD signals. TON RSI at 51.32 suggests neutral positioning ahead of potential breakout.
TON Price Rallies 1% to $3.18 as Bullish Technical Signals Strengthen
Toncoin trades at $3.18 with 1.02% daily gains as technical indicators suggest bullish momentum building despite neutral RSI readings.
TON Price Surges to $3.34 as Toncoin Shows Strong Bullish Momentum
Toncoin (TON) trades at $3.34 with 2.99% daily gains, displaying overbought RSI conditions at 72.03 while approaching key resistance at $3.40 in today's session.
Toncoin Surges 3.44% as TON Price Tests Critical Resistance at $3.35
TON price climbs to $3.31 with bullish momentum intact, but overbought RSI signals caution as Toncoin approaches key resistance levels on strong volume.
Toncoin (TON) Technical Analysis: Price Consolidates at $3.19 Amid Bullish Momentum Signals
TON trades at $3.19 with bullish technical indicators despite recent consolidation. RSI at 64.87 and positive MACD suggest potential upward movement ahead.
Toncoin (TON) Technical Analysis: Bulls Eye $3.40 Resistance as RSI Signals Strength
TON trades at $3.19 with bullish momentum despite 2.92% daily decline. Technical indicators suggest potential breakout above $3.35 resistance with RSI at 65.12.
** Toncoin (TON) Price Analysis: Bullish Momentum as RSI Nears Overbought Levels
** Toncoin (TON) surges to $3.29, gaining 4.74% in 24 hours. With bullish momentum and strong technical indicators, here's an in-depth look at TON's price outlook.
Toncoin (TON) Surges Amid Strategic Partnerships and Regulatory Challenges
Toncoin (TON) shows resilience with recent partnerships, exchange listings, and technical upgrades driving growth. Despite regulatory setbacks, TON’s bullish trend persists.
Toncoin (TON) Gains Momentum Amid Key Partnerships and Ecosystem Growth
Toncoin (TON) surges with strategic partnerships, exchange listings, and institutional adoption, despite regulatory setbacks. Explore recent developments, technical trends, and price outlook.
Toncoin (TON) Gains Momentum Amid Exchange Listings and Institutional Adoption
Toncoin (TON) shows resilience with new exchange listings, institutional adoption via Crypto.com Custody, and technical indicators pointing to cautious bullish trends.
Toncoin (TON) Navigates Volatility Amid Institutional Adoption and Regulatory Headwinds
Toncoin (TON) faces a turbulent week with institutional adoption via Crypto.com Custody boosting confidence, while UAE regulatory backlash triggers price swings.
Toncoin (TON) Faces Mixed Sentiment Amid UAE Visa Program Controversy and Institutional Adoption
Toncoin's (TON) price faced volatility this week as Crypto.com Custody's integration boosted institutional confidence, while UAE regulators denied Golden Visa claims.
DeFi TVL Rebounds to the $54 Billion Mark, Eth-based MakerDAO Remains Dominant Lender
The total value locked (TVL) in DeFi rebonds to approximately $54 billion currently. The TVL has been down since October 12, trading between $53.7 and $53.29 billion level.
TRX Price Prediction: TRON Targets $0.30-$0.32 Within 2 Weeks Amid Mixed Technical Signals
TRX price prediction shows potential 7-14% upside to $0.30-$0.32 range based on technical analysis, despite current neutral RSI at 40.89 and bearish MACD momentum.
TRX Price Prediction: TRON Eyes $0.30-$0.32 Breakout Within 7-10 Days
TRX price prediction targets $0.30-$0.32 range as technical indicators show bullish momentum building. TRON forecast suggests 7-14% upside potential from current $0.28 level.
TRX Price Prediction: TRON Eyes $0.30 Breakout with Potential Rally to $0.315
TRX price prediction shows bullish momentum building toward $0.30 resistance. Technical indicators support short-term target of $0.315 with key support at $0.27.
TRX Price Prediction: Targeting $0.30-$0.32 Breakout Within 7-10 Days
TRX price prediction points to $0.30-$0.32 targets as technical indicators show bullish MACD divergence and strong network activity supporting TRON forecast.
TRX Price Prediction: TRON Eyes $0.30 Breakout as Technical Momentum Builds - December 2025 Forecast
TRX price prediction targets $0.30-$0.32 breakout within 7-10 days as bullish MACD divergence and Bollinger Band position signal upward momentum continuation.
TRX Price Prediction: TRON Eyes $0.33 Breakout by January 2025 Amid Bullish Momentum Shift
TRON technical analysis reveals bullish MACD divergence targeting $0.33 resistance. TRX price prediction shows 17% upside potential with key support at $0.27.
TRX Price Prediction: TRON Eyes $0.33 Target Within 30 Days Despite Technical Headwinds
TRX trades at $0.28 with mixed signals pointing to potential $0.33 breakout in January 2025, though downside risks remain near $0.27 support levels.
TRX Price Prediction: TRON Eyes $0.32 Break Above Key Resistance by Year-End 2025
TRON technical analysis reveals potential rally to $0.32 resistance level with bullish MACD momentum, though $0.27 support remains critical for upside continuation.
TRX Price Prediction: $0.30 Target Within 10 Days as Technical Indicators Signal Recovery
TRX price prediction analysis reveals $0.30 as the immediate target with bullish MACD momentum supporting potential 7% gains from current $0.28 levels.
TRX Price Prediction: TRON Eyes $0.33 Short-Term Target Amid Mixed Technical Signals
TRX price prediction shows potential 18% upside to $0.33 within one week, though medium-term TRON forecast remains divided between $0.28-$1.09 range.
TRX Price Prediction: $0.30-$0.35 Target Within 2 Weeks as Oversold Bounce Expected
TRON shows oversold RSI at 36.04 with analysts targeting $0.30-$0.60. TRX price prediction suggests recovery to $0.35 resistance level within two weeks.
TRX Price Prediction: Recovery to $0.33 Expected as Oversold Conditions Signal Bounce
TRON shows oversold RSI at 29.71 with analysts targeting $0.30-$0.35 recovery. TRX price prediction suggests 22% upside potential if key resistance breaks.
TRX Price Prediction: Targeting $0.33 Recovery by December 2025 Amid Oversold Bounce
TRX technical analysis reveals oversold RSI at 28.28, setting up potential bounce to $0.33 target. Critical $0.27 support holds as analysts eye short-term recovery.
TRX Price Prediction: TRON Eyes $0.33 Recovery Despite Oversold Conditions - November 2025 Forecast
TRX technical analysis reveals oversold RSI at 29.82 setting stage for potential bounce to $0.33 target, though bears defend $0.30 resistance with $0.27 critical support.
TRX Price Prediction: $0.33 Target Within 30 Days as Technical Indicators Signal Bullish Reversal
TRON technical analysis reveals TRX price prediction targeting $0.33 resistance break within 4 weeks, with current oversold conditions supporting near-term recovery from $0.28 support.
TRX Price Prediction: TRON Targets $0.34 Despite Market Fear as Technical Indicators Signal Recovery
TRX price prediction shows potential 17% upside to $0.34 within 2 weeks as bullish MACD momentum emerges despite current market fear at extreme levels.
TRX Price Prediction: TRON Targets $0.313-$0.33 as Technical Momentum Shifts Bullish
TRX price prediction suggests upside to $0.313-$0.33 over the next 4-6 weeks as MACD histogram turns positive and key resistance at $0.30 comes into focus for TRON.
TRX Price Prediction: TRON Eyes $0.33 Target as Technical Momentum Builds Despite Mixed Signals
TRX price prediction shows potential 14% upside to $0.33 within 4-6 weeks as MACD histogram turns bullish, though immediate resistance at $0.30 must break first.
TRX Price Prediction: TRON Eyes $0.33 Target by December 2025 Amid Bullish Technical Setup
TRX price prediction points to $0.33 target within 4-6 weeks as TRON forecast shows bullish momentum building with MACD turning positive and key resistance at $0.30 in focus.
TRX Price Prediction: TRON Eyes $0.33 Target by December 2025 as Technical Indicators Turn Bullish
TRX price prediction shows potential rally to $0.33 in 4-6 weeks based on bullish MACD momentum and analyst targets. Current $0.30 level offers strategic entry.
TRX Price Prediction: TRON Targets $0.33-$0.35 Recovery Within 3-4 Weeks
TRX price prediction shows bullish momentum building as MACD turns positive. TRON forecast targets $0.33-$0.35 range with key resistance break needed at $0.33.
TRX Price Prediction: TRON Eyes $0.33-$0.35 Breakout Within 2 Weeks Amid Technical Recovery
TRX price prediction shows potential rally to $0.33-$0.35 range within two weeks as TRON holds crucial $0.28 support with bullish MACD momentum emerging.
TRX Price Prediction: TRON Eyes $0.35 Breakout with 20% Upside Potential by December 2025
TRX price prediction shows potential rally to $0.35 within 4 weeks as technical indicators signal bullish momentum, though $0.28 support remains critical for uptrend.
TRX Price Prediction: TRON Eyes $0.33 Breakout Despite Bearish Momentum - November 2025 Forecast
TRX price prediction shows potential rally to $0.33-$0.35 range within 2 weeks, but bearish MACD signals risk of drop to $0.25 support if current consolidation fails.
TRX Price Prediction: TRON Eyes $0.33-$0.35 Recovery After Testing Critical $0.29 Support
TRX price prediction shows potential 17-25% upside to $0.33-$0.35 within 2-4 weeks as TRON bounces from oversold conditions and critical support levels.
TRX Price Prediction: TRON Eyes $0.32-$0.35 Breakout Despite Bearish Momentum
TRX price prediction indicates potential rebound to $0.32-$0.35 range within 2-4 weeks as TRON tests critical $0.29 support with oversold RSI conditions.
TRX Price Prediction: Testing $0.29 Support Before Potential Rally to $0.33 Target
TRX faces critical $0.29 support test with analyst targets around $0.295. Technical indicators suggest consolidation before potential breakout to $0.33 resistance.
TRX Price Prediction: TRON Eyes $0.33-$0.35 Recovery After Testing Support at $0.29
TRX price prediction targets $0.33-$0.35 range within 2-4 weeks as TRON finds support at current levels. Technical analysis shows oversold conditions creating potential buying opportunity.
TRX Price Prediction: TRON Eyes $0.366 by 2027 Despite Near-Term Consolidation Around $0.30
TRX price prediction shows consolidation near $0.30 with medium-term target of $0.29-$0.304 range, while long-term TRON forecast points to $0.366 by December 2027.
TRX Price Prediction: TRON Targets $0.35-$0.62 Despite Current Oversold Conditions
TRX price prediction shows potential for 16-106% gains with immediate resistance at $0.35 and long-term targets reaching $0.62 by 2027, despite current bearish momentum.
TRX Price Prediction: Target $0.35 Resistance Break Could Push TRON to $0.40 by November 2025
TRON's bullish momentum signals potential breakout above $0.35 resistance, with technical analysis pointing to $0.40 target within 4 weeks if key levels hold.
TRX Price Prediction: TRON Eyes $0.35 Breakout with 15% Upside Potential in November 2025
TRX price prediction targets $0.35-$0.37 range by November 2025 as technical indicators show bullish momentum building with MACD turning positive and neutral RSI.
TRON Developer Activity Surge Fails to Lift TRX as Bitcoin Selling Pressure Weighs on Market
TRX holds $0.32 despite positive developer metrics as Bitcoin whale selling creates broader crypto headwinds, testing key technical support levels.
TRX Tests Key Support at $0.31 as Technical Indicators Signal Consolidation Phase
TRON trades at $0.31 with modest 0.5% gains amid neutral technical setup, as traders await catalyst to break current range between $0.30-$0.35 resistance levels.
TRX Tests Lower Bollinger Band Support as Bitcoin Decline Triggers Broader Crypto Sell-Off
TRON (TRX) trades at $0.31 after declining 2.4% in 24 hours, testing critical support levels as Bitcoin's recent 7.29% drop continues to pressure altcoin markets across the sector.
TRX Tests Lower Bollinger Band Support at $0.31 as Bitcoin's 6.5% Drop Weighs on Broader Crypto Market
TRON trades at $0.31 near critical technical support as Bitcoin's decline from $115,734 to $108,186 pressures altcoins, with TRX showing resilience despite 2.87% daily drop.
TRX Technical Setup Shows Consolidation Above 200-Day Moving Average Despite Short-Term Bearish Signals
TRX trades at $0.34 with a 1.03% decline as the token consolidates above its 200-day moving average while shorter timeframes signal potential weakness ahead.
TRX Consolidates Near Key Technical Levels as RSI Holds Neutral Territory
TRON trades at $0.34 with modest 0.74% daily gains as technical indicators signal consolidation phase near critical support and resistance zones.
TRON Testing Key Support at $0.33 as RSI Shows Neutral Territory
TRX trades at $0.34 after a 2% decline, approaching critical support levels with RSI at 46.8 suggesting potential reversal opportunity for swing traders.
TRX Shows Resilience as TRON Network Processes 80 Billion in Stablecoins While Company Doubles Treasury Holdings
TRX trades at $0.34 with modest gains following TRON's stablecoin milestone and Tron Inc.'s strategic treasury expansion to $220 million, signaling institutional confidence.
Breaking: TRON Treasury Doubles to $220M as TRX Technical Analysis Reveals Critical Support Test
** TRX price trades at $0.33 amid fresh $110M treasury injection by Tron Inc. Technical indicators show mixed signals as TRON tests lower Bollinger Band support.
TRON (TRX) Tests Key Support at $0.34 as Treasury Boost Meets Technical Headwinds
TRX trades at $0.34 (-0.41% 24h) following major treasury expansion, but neutral RSI and bearish MACD suggest consolidation ahead.
TRON (TRX) Holds Steady at $0.34 as Bulls Fight to Maintain Momentum
TRX price sits at $0.34 with neutral RSI at 46, while bulls battle bearish MACD signals in consolidation zone between key support and resistance levels.
TRON (TRX) Consolidates Around $0.34 as RSI Shows Neutral Momentum
TRX price holds steady at $0.34 with minimal 24h movement, while technical indicators suggest consolidation phase with bullish undertones for potential breakout.
TRON (TRX) Faces Bearish Pressure as Price Drops 3.12% to $0.33
TRX price slides to $0.33 amid neutral RSI signals and bearish MACD momentum, testing key support levels as traders eye potential reversal opportunities.
TRON (TRX) Tests Support as Bearish Sentiment Grips Crypto Markets
TRX price hovers at $0.35 amid neutral technical signals, with strong resistance at $0.37 keeping bulls in check as momentum indicators show mixed signals.
TRON (TRX) Eyes $0.37 Resistance as Technical Analysis Reveals Strong Bullish Momentum
TRX price holds steady at $0.35 with bullish MACD signals and strong momentum indicators pointing toward a potential breakout above key resistance levels.
TRON (TRX) Shows Strong Bullish Momentum Above $0.35 Support
TRX price holds steady at $0.35 with bullish MACD signals and RSI in neutral territory, setting up potential breakout toward $0.37 resistance level.
TRON (TRX) Surges 1.44% to $0.35 as Bullish Momentum Builds
TRX price reaches $0.35 with strong technical indicators showing very bullish trend. MACD signals positive momentum while RSI stays neutral at 53.82.
TRON (TRX) Consolidates at $0.34 as Bulls Prepare for Breakout Above Key Resistance
TRX price holds steady at $0.34 with bullish MACD momentum emerging despite recent 0.96% decline. Technical indicators suggest potential upside targeting $0.37 resistance.
TRON (TRX) Price Analysis: Bullish Momentum Builds Despite 0.73% Daily Decline
TRX trades at $0.34 with mixed signals as MACD shows bullish momentum while price faces resistance at $0.35 in neutral RSI territory.
TRON (TRX) Holds $0.35 Support as Bulls Eye Breakout Above Key Resistance
TRX price trades at $0.35 with neutral RSI and bullish MACD signaling potential upside momentum toward strong resistance at $0.37.
TRON (TRX) Price Struggles as Technical Indicators Signal Mixed Momentum
TRX price holds at $0.35 despite 0.77% daily decline. MACD shows bullish divergence while RSI remains neutral, creating uncertainty for traders.
TRON (TRX) Surges Near Upper Bollinger Band as Bulls Target $0.37 Resistance
TRX price climbs to $0.35 with 1.32% daily gains, approaching key resistance as technical indicators flash mixed signals for TRON traders.
TRON (TRX) Surges to $0.35 as Technical Indicators Flash Bullish Signals
TRX price reaches $0.35 with bullish momentum emerging across multiple technical indicators, presenting fresh trading opportunities for crypto investors.
TRON (TRX) Breaks Above Key Resistance as Bulls Target $0.37
TRX price rallies to $0.34 with 0.74% daily gains, showing very strong bullish momentum as technical indicators signal potential breakout above critical resistance levels.
TRON (TRX) Price Consolidates at $0.34 as Network Fundamentals Strengthen
TRX trades at $0.34 (+1.62% in 24h) while TRON reclaims top USDT platform status and attracts $110M treasury investment, but technical indicators show mixed signals ahead.
TRON (TRX) Holds $0.33 Despite Bearish Momentum as $110M Treasury Investment Fails to Spark Rally
TRX price maintains $0.33 stability with 0.76% daily gains, but bearish MACD signals suggest caution despite recent $110 million treasury expansion from major shareholder.
TRON (TRX) Shows Mixed Signals as Treasury Expansion Fails to Boost Price
TRX trades at $0.33 (-1.18%) despite $110M treasury investment. Technical analysis reveals bearish momentum with key support at $0.30 as institutional confidence grows.
TRON (TRX) Price Faces Pressure Despite $110M Investment Boost - Key Support at $0.33
TRX trades at $0.33 (-2.39% daily) as technical indicators signal oversold conditions despite recent $110 million treasury expansion from major shareholder.
TRON (TRX) Tests Key Support at $0.34 Despite $110M Treasury Investment
TRX trades at $0.34 (-0.24% today) as momentum indicators flash bearish signals despite major institutional backing from largest shareholder investment.
TRON (TRX) Tests Critical Support at $0.34 Amid Mixed Technical Signals
TRX price holds $0.34 support despite bearish MACD signals, as $110M institutional investment provides bullish backdrop for potential reversal
TRON (TRX) Faces Mixed Signals at $0.34 Despite $110M Treasury Investment
TRX price holds steady at $0.34 with neutral RSI, as TRON's recent $110M treasury expansion shows institutional confidence amid technical consolidation signals.
TRON (TRX) Tests Key Support at $0.34 as Bearish Momentum Builds Despite $1B Volume Surge
TRX trades at $0.34 (-0.15% daily) near Bollinger Band support despite recent $1B volume milestone, with technical indicators suggesting potential correction ahead.
TRON (TRX) Holds $0.34 Support Despite Bearish Momentum Signals
TRX price trades at $0.34 with mixed technical signals as TRON RSI remains neutral while MACD shows bearish divergence in current market conditions.
TRON (TRX) Shows Mixed Signals as Price Consolidates Near $0.34 Support
TRX price holds at $0.34 with neutral RSI and bearish MACD divergence, creating key decision point for traders as token tests critical support levels.
TRON (TRX) Consolidates Near Support as Technical Indicators Signal Mixed Outlook
TRX price holds steady at $0.34 with neutral RSI at 46.91, while Bollinger Bands suggest potential breakout from current consolidation pattern.
TRON (TRX) Tests Lower Support at $0.34 as Bears Take Control
TRX price drops 2.86% to $0.34 as technical indicators signal weakening momentum despite maintaining bullish long-term trend above key moving averages.
TRON (TRX) Consolidates at $0.34 as Bulls and Bears Battle for Control
TRX price trades at $0.34 with neutral RSI signaling potential breakout. TRON support levels hold firm despite 1.83% daily decline as volume reaches $135M.
** TRON (TRX) Price Analysis: Testing $0.37 Resistance After 26% Rally and $1B Buyback
** TRX trades at $0.35 with bullish momentum from Binance-T3 partnership and record buyback program, though facing key resistance levels ahead.
TRON (TRX) Eyes $0.37 Resistance After $1 Billion Buyback Fuels Rally
TRX price consolidates at $0.35 following impressive weekly gains. TRON technical analysis reveals strong bullish momentum as network sees record stablecoin flows.
TRON (TRX) Hits $0.36 as RSI Signals Overbought Conditions Amid Billion-Dollar Buyback Rally
TRX trades at $0.36 with RSI at 74, showing overbought conditions after 172% yearly gains driven by $1B buyback program and record Q2 financial results.
TRON (TRX) Hits 52-Week High at $0.36 as RSI Signals Overbought Territory
TRX price reaches $0.36 with 2.65% daily gains, but technical indicators warn of potential pullback as network activity surges 67% year-over-year.
TRON (TRX) Tests $0.35 Resistance as RSI Hits Overbought Territory
TRX price holds steady at $0.35 with 75+ RSI levels, while $1B buyback program and record Q2 earnings fuel bullish momentum despite recent profit-taking signals.
TRON (TRX) Surges to $0.35 as Network Activity Soars and Quarterly Earnings Impress
TRX trades at $0.35 (+2.09% in 24h) after hitting 52-week highs, driven by record Q2 earnings and network surpassing 5 billion transactions with overbought RSI signaling caution.
TRON (TRX) Faces Critical Resistance at $0.35 Despite $1B Buyback Rally
TRX trades at $0.34 with RSI at 68.5 as bulls test key resistance after recent 26% rally. Buyback program provides fundamental support but technical correction signals emerge.
TRON (TRX) Consolidates at $0.34 Resistance After $1 Billion Buyback Rally
TRX trades at $0.34 after hitting key resistance following TRON's $1 billion buyback announcement, with $2.95M outflows signaling potential profit-taking phase.
TRON (TRX) Tests $0.34 Resistance as $1 Billion Buyback Program Drives Bullish Momentum
TRX trades at $0.34 near resistance after a massive $1B buyback announcement fueled an 8% surge, with RSI at 67 showing continued bullish momentum despite minor daily pullback.
TRON (TRX) Hits $0.34 as $1 Billion Buyback Program Drives Massive Rally
TRX trades at $0.34 following TRON's landmark $1 billion buyback announcement, with technical indicators showing strong bullish momentum as RSI approaches overbought territory.
** TRX Price Surges to $0.34 as TRON's $1 Billion Buyback Program Fuels Bullish Momentum
** TRX trades at $0.34 (+2.29%) following TRON's massive $1 billion buyback announcement. Technical indicators show strong bullish momentum with RSI at 69.62.
TRON (TRX) Surges 8% as $1 Billion Buyback Program Fuels Rally Above $0.33
TRX trades at $0.33 (+1.82%) with strong momentum following TRON's $1B buyback announcement and record revenue, while technical indicators show bullish structure.
TRX Price Holds $0.32 After Tron Inc.'s $1B Capital Raise Announcement
TRX trades at $0.32 with bullish technical setup despite minor daily decline, as Tron Inc.'s billion-dollar funding plan supports long-term outlook.
TRON (TRX) Breaks Above Key Resistance as Nasdaq Listing Drives Bullish Momentum
TRX trades at $0.33 (+0.12% in 24h) following TRON Inc.'s Nasdaq debut and $1B capital raise plan, with technical indicators showing very strong bullish signals.
TRON (TRX) Price Analysis: $0.33 Holds Key Support After Nasdaq Listing Surge
TRX trades at $0.33 with bullish momentum intact despite minor pullback. Nasdaq listing drives institutional interest while technical indicators signal potential breakout.
TRON (TRX) Holds $0.33 Despite Correction as Nasdaq Listing Momentum Builds
TRX trades at $0.33 with bullish technical structure intact following Tron Inc.'s Nasdaq debut and $1B capital raise plans, presenting mixed signals for traders.
TRON (TRX) Shows Mixed Signals as Price Retreats to $0.34 Despite Nasdaq Listing Momentum
TRX trades at $0.34 after a 3.31% daily decline, with overbought RSI conditions suggesting potential consolidation despite bullish news catalysts from Nasdaq listing.
TRON (TRX) Surges to $0.33 After Historic Nasdaq Listing as Technical Indicators Flash Overbought
TRX trades at $0.33 (+2.02%) following Tron Inc.'s groundbreaking Nasdaq debut, while RSI at 72.24 signals caution for traders as momentum remains strong.
TRON (TRX) Surges to $0.32 After Nasdaq Listing Milestone
TRX trades at $0.32 with 68.90 RSI as TRON Inc. rings Nasdaq opening bell following $100M reverse merger, pushing market cap past Cardano to 9th place globally.
TRON (TRX) Surges Past $0.32 as Nasdaq Listing Fuels Bullish Momentum
TRX trades at $0.32 with strong bullish signals after Tron Inc.'s Nasdaq debut. Technical indicators show momentum building with RSI at 68.49 and price near resistance levels.
TRON (TRX) Breaks $0.32 as Nasdaq Listing Sparks 30% Volume Surge
TRX price reaches $0.32 (+1.57%) following Tron Inc.'s $100M Nasdaq reverse merger, with trading volume spiking 30% to $1.64B despite network TVL declining $136M.
TRON (TRX) Rallies 0.42% as Nasdaq Debut Overshadows TVL Decline
TRX trades at $0.31 with 0.42% gains following Tron Inc.'s Nasdaq debut through $100M reverse merger, though $136M TVL decline signals underlying shifts.
TRON (TRX) Holds Above $0.31 as Nasdaq Bell Ceremony Boosts Institutional Confidence
TRX trades at $0.31 with 62.63 RSI after Tron Inc.'s historic Nasdaq Opening Bell ceremony, signaling strong institutional backing and bullish momentum ahead.
TRX Surges as Tron Inc. Goes Public on Nasdaq - Technical Analysis Shows $0.33 Resistance Test
** TRX price holds at $0.31 after corporate rebranding catalyst. Network hits 9M daily transactions while TRX RSI signals continued bullish momentum ahead.
TRON Price Shows Resilience Above $0.31 Despite Market Pullback Following Nasdaq Debut
TRX trades at $0.31 with strong institutional backing from Tron Inc.'s Nasdaq listing, while technical indicators suggest bullish momentum continues.
TRON (TRX) Surges on Nasdaq Listing News: $0.32 Price Analysis and Strong Bullish Momentum
TRON hits $0.32 with 72 RSI as SRM Entertainment rebrands to Tron Inc., lists on Nasdaq. Trump token expands to TRON blockchain, driving institutional adoption.
TRON (TRX) Surges Past $0.32 as Daily Transactions Hit 9 Million and Trump Token Adoption Drives Momentum
TRON trades at $0.32 with strong bullish signals as daily transactions exceed 9M, SRM rebrands to Tron Inc., and Trump's official token expands to TRON blockchain.
TRON (TRX) Surges Amid Institutional Adoption: Key Analysis and Market Outlook
TRON (TRX) gains momentum as SRM Entertainment rebrands to Tron Inc., becoming the largest corporate holder of TRX. Explore market trends, technical analysis, and price predictions.
TRON (TRX) Surges Amid Institutional Adoption, Rebranding, and Record USDT Transfers
TRON (TRX) sees bullish momentum with institutional investments, a corporate rebrand, and record USDT transfers. Despite a $27M exchange hack, TRX remains resilient.
TRON (TRX) Surges Amid Record USDT Transfers, Institutional Adoption, and Bullish Momentum
TRON (TRX) gains traction with record $1.93T USDT transfers, institutional adoption, and strategic partnerships. Bullish technicals signal potential price growth.
TRON (TRX) Analysis: Bullish Momentum Builds Amid Strong Technicals
TRON (TRX) maintains bullish momentum with strong technical indicators, hitting $0.30 amid a very strong uptrend. Discover key trading signals and price outlook.
TRON (TRX) Surges Amid Institutional Adoption, SkyLink Launch, and Bullish Momentum
TRON (TRX) rises to $0.31, driven by soaring adoption, record-breaking network activity, and strategic partnerships. Discover key insights and price predictions.
TRON (TRX) Surges to $0.31: Institutional Adoption, SkyLink Launch, and Bullish Momentum
TRON (TRX) reaches $0.31, fueled by record-breaking transactions, institutional adoption, and bullish technical indicators. Could regulatory risks impact its rally?
TRON (TRX) Surges Amid Bullish Momentum, Institutional Adoption, and Regulatory Challenges
TRON (TRX) climbs to $0.31, fueled by record-breaking transactions, strategic partnerships, and bullish technicals. However, regulatory scrutiny poses risks.
TRON (TRX) Price Analysis: Strong Bullish Momentum Points to Further Gains in 2025
TRON (TRX) is trading at $0.29 amid strong bullish momentum, up 1.22% in 24 hours. With bullish technical indicators, here’s our analysis and trading strategy.
UNI Price Prediction: $8.50 Target by February 2025 as Technical Recovery Signals Emerge
UNI price prediction points to $8.50-$10.66 recovery potential over 4-6 weeks as oversold conditions and whale accumulation suggest bullish reversal from current $5.43 levels.
UNI Price Prediction: $6.50 Target by Year-End 2025 as Uniswap Tests Critical Support
UNI price prediction suggests a potential 18% rally to $6.50 by December 31st, 2025, as technical indicators show oversold conditions near the $5.37 support level.
UNI Price Prediction: Targeting $7.85 Recovery Within 4 Weeks Despite Near-Term Headwinds
UNI price prediction points to $7.85 target by mid-January 2026, but must first overcome $6.88 resistance. Current oversold conditions favor recovery from $5.72 levels.
UNI Price Prediction: Critical Support Test at $5.37 - Next Target $7.88 by January 2025
UNI price prediction shows critical support test at $5.37 with potential rebound to $7.88 target. Technical analysis reveals oversold conditions setting up recovery.
UNI Price Prediction: $8.16 Target by End December 2025 Amid Mixed Technical Signals
UNI price prediction shows potential 34% upside to $8.16 resistance level within 4 weeks, but bearish MACD signals caution for Uniswap investors.
UNI Price Prediction: $7.39 Short-Term Target as DeFi Recovery Gains Momentum
Uniswap shows bullish signals with 11.75% daily gains. UNI price prediction targets $7.39 near-term, with medium-term Uniswap forecast ranging $8.60-$10.66.
UNI Price Prediction: $8.75 Target in Q1 2025 as DeFi Recovery Takes Hold
Analysts predict UNI could reach $8.75 by Q1 2025, representing 59% upside potential from current levels, despite bearish momentum indicators in the near term.
UNI Price Prediction: $6.50-$8.75 Target as Uniswap Tests Critical Support at $5.47
UNI price prediction suggests potential 18-59% upside to $6.50-$8.75 range over next 4-8 weeks, contingent on holding current support levels and DeFi sector recovery.
UNI Price Consolidates Below Key Moving Averages as DeFi Token Tests $6 Support Zone
Uniswap trades at $6.16 with modest 0.7% daily gains as the decentralized exchange token maintains position near critical support levels amid broader crypto market stability.
UNI Price Prediction: Targeting $8.75 in December 2025 Amid DeFi Recovery
UNI price prediction shows potential upside to $8.75-$10.65 range by year-end, with analysts forecasting 41% gains driven by DeFi adoption and technical breakout signals.
UNI Price Prediction: $7.73 Target by December with Mixed Near-Term Signals
UNI price prediction shows potential for 25% upside to $7.73 by December despite current bearish momentum, with critical support at $5.79 and resistance at $10.30.
UNI Consolidates Near $6.20 as Governance Proposal Impact Fades Amid Broader Market Uncertainty
Uniswap's UNI token trades at $6.20 following last week's governance-driven rally, as traders assess technical levels while broader crypto markets show mixed signals.
UNI Consolidates Near $6 as Bitcoin's Seven-Month Low Pressures DeFi Tokens
Uniswap trades at $6.06 amid broader crypto weakness as Bitcoin's drop to seven-month lows creates headwinds for DeFi protocols despite UNI's modest 1.9% daily gain.
UNI Price Prediction: $7.50 Target by December 2025 as DeFi Recovery Accelerates
UNI price prediction points to $7.50 by December 2025, with analysts forecasting $7.89-$8.75 targets amid DeFi recovery and technical oversold conditions.
UNI Whale Liquidation Triggers 2.2% Drop Despite Recent Fee Burn Rally
Uniswap trades at $6.48 following whale's $11.7M loss liquidation, testing technical support after 35% surge from fee burn proposal momentum fades.
UNI Price Prediction: $8.50 Target Within 2 Weeks Amid Oversold Conditions
UNI price prediction shows potential rally to $8.50 in the next 1-2 weeks as oversold conditions and governance developments create bullish setup.
UNI Price Consolidates Above $7 as Uniswap Tests Mid-Range Support in Quiet Market
Uniswap trades at $7.20 down 0.4% as UNI price finds support above key technical levels amid subdued trading activity and broader crypto market consolidation.
UNI Price Prediction: $8.50 Target Within 2 Weeks as Bullish Momentum Builds
UNI price prediction shows potential for $8.50 in the short term as technical indicators signal bullish momentum, with medium-term Uniswap forecast targeting $10.
UNI Defies Crypto Selloff with 35% Weekly Surge on Fee Burn Proposal
Uniswap's UNI token trades at $7.71, up 6.6% today, as governance proposal to burn 100 million tokens drives strong performance despite broader market weakness.
UNI Price Prediction: Targeting $8.50 by December 2025 Amid Bullish Technical Setup
UNI price prediction points to $8.50 target within 4-6 weeks as technical indicators show bullish momentum despite recent 6.31% decline to $7.33.
UNI Surges 5.2% as 'UNIfication' Governance Proposal Sparks Fee Revenue Optimism
Uniswap (UNI) trades at $7.81 following a 5.2% daily gain as the protocol's ambitious governance overhaul proposal drives institutional interest and record trading volumes signal growing adoption.
UNI Price Prediction: Targeting $10.66 by December 2025 as Technical Momentum Builds
UNI price prediction shows bullish momentum with MACD divergence signaling potential move to $10.66 medium-term target as Uniswap breaks above key resistance levels.
UNI Price Surges Past $7.40 as 'UNIfication' Proposal Promises $500M Annual Token Burns
Uniswap (UNI) trades at $7.44 following the groundbreaking 'UNIfication' governance proposal that could burn $500 million worth of tokens annually, fueling deflationary hopes.
UNI Price Prediction: $7.85-$8.50 Target by December 2025 Following Technical Breakout
UNI price prediction indicates a move to $7.85-$8.50 range within 30 days, supported by bullish MACD momentum and descending wedge breakout potential.
UNI Price Prediction: $10-14 Target by December 2025 as Technical Breakout Looms
UNI price prediction points to $10-14 targets within 4-6 weeks as descending wedge formation signals potential breakout from current $7.53 level.
UNI Price Tests Key $7.00 Support After Technical Reversal From $10 Resistance Zone
Uniswap trades at $7.59 following a technical reversal from resistance, with the token now approaching critical support levels as broader crypto markets show mixed signals.
UNI Price Prediction: Targeting $10.30 Resistance With 20% Upside Potential by December 2025
UNI price prediction shows bullish momentum targeting $10.30 resistance level, with technical indicators supporting 20% upside potential in the next 4-6 weeks despite recent consolidation.
UNI Rallies 15% on Fee Sharing Activation Talks as Technical Breakout Gains Momentum
Uniswap's UNI token surges to $6.98 amid discussions about implementing fee switch revenue sharing, building on recent breakout from six-month correction pattern.
UNI Rebounds 11.7% to $6.70 as Traders Defend Support Despite SEC Warning Clouds
Uniswap's UNI token surges to $6.70 following yesterday's sharp selloff, as buyers step in at key technical levels despite ongoing regulatory concerns from SEC warning.
UNI Price Prediction: Targeting $6.50-$7.20 Recovery Over Next 30 Days
UNI price prediction suggests recovery to $6.50 short-term and $7.20 medium-term based on oversold conditions and emerging bullish MACD momentum signals.
UNI Price Prediction: $6.50-$7.20 Target Within 4 Weeks as Technical Recovery Emerges
UNI price prediction shows bullish momentum building with analysts targeting $6.50-$7.20 recovery. Current oversold conditions and improving MACD signal potential 26% upside.
UNI Price Tests Lower Bollinger Band Support as DeFi Token Faces Technical Pressure
Uniswap trades at $5.20 amid broader crypto weakness, with technical indicators pointing to oversold conditions as UNI price approaches key support levels.
UNI Price Prediction: $6.50 Target as Uniswap Tests Oversold Levels - November 2025 Forecast
UNI price prediction targets $6.50 short-term recovery as technical indicators show oversold conditions. Uniswap forecast suggests 25% upside potential from current $5.19 levels.
UNI Price Prediction: Targeting $8.50 Recovery Within 30 Days Despite Current Weakness
UNI price prediction shows potential 62% upside to $8.50 target despite current weakness at $5.24, with oversold RSI suggesting reversal opportunity.
UNI Plunges to Lower Bollinger Band After Security Exploit Sparks $15M Trading Volume Surge
Uniswap drops 4.1% to $5.60 following security exploit concerns affecting V3 functions, testing critical support as Bitcoin correlation intensifies market selloff.
UNI Price Surges on 250% Volume Spike as Regulatory Crackdown Benefits Uniswap
UNI trading at $5.85 following massive volume surge to $2.1B as regulatory actions against competitors drive traders to Uniswap, while Bitcoin's rally above $110K provides additional momentum.
UNI Price Prediction: $8.50 Target Within 4 Weeks as Technical Reset Nears Completion
UNI price prediction targets $8.50 by December 2025 as oversold conditions and bullish MACD divergence signal potential reversal from current $5.75 levels.
UNI Open Interest Plunges 50% as Uniswap Consolidates Below Key Moving Averages
Uniswap trades at $5.71 amid reduced speculative activity as open interest dropped from $300M to $140M, signaling cautious market sentiment despite broader crypto stability.
UNI Price Prediction: Targeting $6.50-$7.20 by November 2025 Despite Current Weakness
UNI price prediction shows potential recovery to $6.50-$7.20 range within 4 weeks as technical indicators suggest oversold bounce from current $5.66 levels.
UNI Price Prediction: Targeting $6.20-$6.80 Range Through November 2025
Latest UNI price prediction suggests consolidation between $6.20-$6.80 over the next 4 weeks, with analysts targeting $6.64 short-term despite bearish moving averages.
UNI Price Prediction: Targeting $7.06-$8.60 as Technical Indicators Signal Potential 15-40% Upside
UNI price prediction shows bullish momentum building with MACD histogram turning positive. Analysts forecast $6.43 short-term, $7.06 medium-term targets as Uniswap breaks key resistance.
UNI Price Prediction: $7.50 Target by November 2025 as Technical Momentum Builds
UNI price prediction shows bullish momentum with $7.50 medium-term target. Current technical setup suggests 20% upside potential over next 4-6 weeks.
UNI Tests Key Support Near $6 as DeFi Tokens Consolidate Below Moving Averages
Uniswap trades at $6.19 with modest 0.9% gains as technical indicators suggest consolidation phase continues below critical resistance levels in absence of major catalysts.
UNI Price Prediction: $8.60 Target Within 2 Weeks as Bullish Momentum Builds
UNI price prediction shows potential 30% upside to $8.60 resistance level within two weeks, supported by bullish MACD histogram and oversold conditions from 52-week highs.
UNI Price Tests Lower Bollinger Band as DeFi Tokens Face Broad Selling Pressure
Uniswap trades at $6.28, down 2.5% in 24 hours, as the token approaches key technical support levels amid subdued trading volume and broader crypto market weakness.
UNI Tests Lower Bollinger Band Support as DeFi Token Consolidates Below Key Moving Averages
Uniswap (UNI) trades at $6.02 after a 2.15% decline, finding support near the lower Bollinger Band as technical indicators suggest oversold conditions amid broader crypto market weakness.
[UNI] Unichain Launch Fails to Sustain Rally as Broader Crypto Weakness Drags Price Below $6.50
Uniswap trades at $6.20 after Unichain L2 announcement briefly lifted prices, but Bitcoin's 5% decline and inflation concerns weigh on DeFi tokens across the board.
Uniswap Tests Critical Support as UNI Price Hovers Near $7.57 Amid Bearish Technical Signals
UNI trades at $7.57 with bearish momentum as price sits below key moving averages, testing critical support levels that could determine next directional move.
UNI Tests Critical Support as Trading Volume Remains Subdued Despite Cross-Chain Innovation
UNI trades at $7.63 following a 0.29% decline, hovering near key $7.27 support despite Uniswap Labs launching The Compact v1 for enhanced cross-chain functionality.
Breaking: Uniswap Surpasses $1 Trillion Volume Milestone While UNI Price Faces Governance Pressure
UNI price trades at $7.66 despite platform achieving record $1 trillion annual volume, as governance debates intensify over token utility and fee-sharing mechanisms.
UNI Price Drops to $7.50 as Governance Debate Overshadows Trading Milestone
UNI trades at $7.50 (-0.40% in 24h) with RSI at 28.13 showing oversold conditions, while governance debates weigh on sentiment despite $1T trading volume milestone.
UNI Price Crashes 4.15% as Oversold RSI Signals Potential Reversal
Uniswap (UNI) trades at $7.77 after a sharp 4.15% decline, with UNI RSI hitting oversold levels at 28.18, suggesting a possible bounce from current support zones.
UNI Price Tests Lower Support as Bearish Momentum Builds at $8.13
Uniswap (UNI) trades at $8.13 with bearish technical signals emerging as the token approaches critical support levels amid declining momentum indicators.
UNI Price Drops 6.64% as Uniswap Tests Critical Support at $7.50
UNI price falls to $8.11 with bearish momentum building. Uniswap technical analysis shows oversold conditions near key support levels.
UNI Price Drops 10.6% as Bears Target Key Support at $7.50
UNI price falls to $8.21 amid bearish momentum, but oversold conditions and strong support levels suggest potential reversal opportunity for traders.
UNI Price Faces Bearish Pressure After Flash Crash - Critical Support at $9.00
UNI trades at $9.19 after a devastating 10% flash crash to $9.54 last week. Technical indicators show bearish momentum with immediate support at $9.00 under pressure.
UNI Price Analysis: Uniswap Tests Critical $9.00 Support Amid Technical Divergence
UNI price trades at $9.24 (-1.25% daily) as Uniswap faces key support test while RSI signals potential oversold bounce near critical levels.
UNI Price Struggles at $9.38 as Bearish Pressure Intensifies
Uniswap (UNI) trades at $9.38, down 1.14% in 24h, testing critical support levels amid continued selling pressure and mixed technical signals.
UNI Price Shows Bullish Momentum Despite Mixed Technical Signals at $9.51
Uniswap (UNI) trades at $9.51 with +2.88% daily gains, showing bullish MACD divergence while RSI remains neutral at 46.34, suggesting consolidation phase.
UNI Price Consolidates at $9.21 as Uniswap Tests Critical Support Levels
UNI trades at $9.21 with neutral momentum as technical indicators suggest consolidation near key support around $9.00 amid mixed signals.
UNI Price Recovers to $9.22 After Flash Crash Shakes Uniswap Markets
UNI price rebounds to $9.22 with 1.40% gains following a brutal 10% flash crash, but technical indicators suggest caution as bears maintain control.
UNI Price Drops 5.47% as Uniswap Tests Critical Support Levels
UNI price currently trades at $9.15 after a sharp 5.47% decline, with technical indicators showing mixed signals as Uniswap approaches key support zones.
UNI Price Drops 6% as Uniswap Tests Critical $9 Support Zone
UNI price falls to $9.68 amid market-wide selling pressure, testing key support levels while technical indicators suggest potential reversal brewing.
UNI Price Breaks Above $10 as Bullish Momentum Builds
Uniswap (UNI) trades at $10.26 with 2.13% gains as technical indicators signal strengthening bullish momentum despite lack of recent catalysts.
UNI Price Breaks Above Key Moving Averages as Bullish Momentum Builds
Uniswap (UNI) trades at $9.97 with +1.32% daily gains, showing bullish MACD signals and breaking above short-term moving averages on strong volume.
UNI Price Surges 2.3% as Uniswap Records Highest DEX Trading Volume Since January
UNI trades at $9.78 (+2.31%) following Uniswap's record $143B August volume, though technical indicators show mixed signals ahead of key resistance at $11.63.
UNI Price Holds Above $9.80 as Uniswap Technical Indicators Signal Mixed Momentum
UNI trades at $9.82 with modest 1.89% daily gains while technical analysis reveals neutral RSI and bearish MACD divergence creating uncertainty for traders.
UNI Price Faces Resistance at $9.44 as Technical Indicators Signal Mixed Outlook
Uniswap (UNI) trades at $9.44 with modest 0.80% daily gains, but technical analysis reveals bearish momentum divergence despite overall bullish trend classification.
UNI Price Analysis: Uniswap Shows Mixed Signals as Token Consolidates Below $10
UNI price trades at $9.39 with modest 0.97% daily gains, but technical indicators reveal conflicting signals as Uniswap faces key resistance levels ahead.
UNI Price Faces Pressure Despite Record DEX Volume - Technical Analysis Shows Mixed Signals
UNI trading at $9.31 (-3.15% today) as technical indicators show neutral momentum despite Uniswap's dominance in record August DEX volumes of $143 billion.
UNI Price Holds Above Key Support as Uniswap Shows Mixed Technical Signals
UNI trades at $9.51 with +0.68% daily gains, sitting below major moving averages while RSI remains neutral. Key support at $9.11 becomes critical for bulls.
UNI Price Analysis: Uniswap Trades Below Key Moving Averages as Bears Take Control
UNI price drops to $9.44 amid weakening technical signals. Uniswap's RSI at 43.13 suggests neutral momentum while trading below critical support levels.
UNI Price Analysis: Uniswap Tests Critical Support at $9.53 Amid Mixed Technical Signals
UNI price sits at $9.53 with bearish momentum indicators, while Uniswap remains above key 200-day moving average at $7.57, creating mixed signals for traders.
UNI Price Tests Lower Bollinger Band Support at $9.50 Amid Bearish Momentum
Uniswap (UNI) trades at $9.50 with bearish technical signals emerging as price approaches critical support levels near $9.11.
UNI Price Drops 3.4% as Uniswap Tests Critical Support at $9.33
UNI price currently trades at $9.46, down 3.43% in 24 hours, as Uniswap approaches key support levels amid bearish momentum signals across technical indicators.
UNI Price Consolidates Near $9.80 as Uniswap Shows Mixed Technical Signals
UNI trades at $9.80 with modest 0.25% daily gains. Technical indicators suggest consolidation phase with key resistance at $12.30 and support at $9.37.
UNI Price Analysis: Uniswap Shows Mixed Signals as Token Trades Near $9.78
UNI price currently sits at $9.78 with a 2.16% daily gain, but technical indicators reveal conflicting signals as Uniswap approaches key support levels.
UNI Price Drops 4.6% as Uniswap Tests Critical Support at $9.37
UNI price currently trades at $9.56 after a 4.58% decline, with technical indicators suggesting oversold conditions near Bollinger Band support levels.
Uniswap (UNI) Tests Critical Support at $9.90 Amid Market Weakness
UNI price drops to $9.90 (-2.07% in 24h) as bears test key support levels. Technical indicators show neutral RSI but bearish momentum building.
UNI Price Retreats to $10.33 After Hitting 8-Month High: Whale Activity Continues
Uniswap (UNI) trades at $10.33 after a 7.79% daily decline, pulling back from its recent $13.77 peak amid continued whale accumulation and strong institutional interest.
Uniswap (UNI) Surges Above $11 as Whale Accumulation Powers 8-Month High Rally
UNI trades at $11.10 (+1.19%) after hitting an 8-month high of $13.77, driven by massive whale accumulation and broader crypto market recovery momentum.
UNI Price Drops 1.29% as Uniswap Tests Critical Support at $10.86
Uniswap trades at $10.86 after declining 1.29% in 24 hours, though technical indicators suggest bullish momentum may be building despite the recent pullback.
Uniswap (UNI) Faces 9.4% Drop as DeFi Markets Turn Bearish
UNI price drops to $10.89 amid broader market selloff, testing critical support levels despite maintaining bullish technical structure above key moving averages.
UNI Price Surges 6.3% to $12.11 as Whale Activity Drives Bullish Momentum
Uniswap's UNI token climbs to $12.11 with strong whale activity and technical indicators pointing toward the crucial $14 resistance level.
UNI Price Surges to $11.42 as Whale Activity Drives Uniswap Rally
UNI trading at $11.42 (+2.40% in 24h) as whale movements and technical breakout above key resistance levels signal potential continued upside for Uniswap token.
UNI Price Surges 1.44% to $11.20 as Whale Activity Drives Uniswap Rally
UNI trades at $11.20 with bullish momentum following whale activity and strong technical indicators. RSI at 65 suggests continued upside potential for Uniswap.
Uniswap (UNI) Surges 4.69% to $11.09 as Bulls Target $14 Resistance Breakout
UNI rallies to $11.09 with strong momentum indicators signaling potential breakout above $12 resistance as Uniswap technical analysis reveals bullish divergence.
Uniswap (UNI) Faces Bearish Pressure Despite Whale Activity - Technical Analysis Shows Mixed Signals
UNI price currently trades at $10.69 after a 4.19% decline, testing key support levels despite recent whale accumulation driving earlier gains.
UNI Price Surges 6.5% to $11.14 as Uniswap Technical Indicators Flash Bullish Signals
UNI price hits $11.14 with strong bullish momentum as technical indicators align for potential breakout above key resistance levels.
UNI Price Surges 8.59% as Uniswap Shows Very Strong Bullish Technical Signals
UNI price reaches $10.50 with strong momentum as Uniswap technical analysis reveals bullish trend across multiple timeframes despite slight MACD divergence.
UNI Price Surges 2.43% as Uniswap Shows Very Strong Bullish Momentum
UNI trades at $9.68 with strong bullish signals emerging. Technical analysis reveals key resistance at $11.69 while Uniswap maintains upward trajectory above critical support levels.
UNI Price Faces Critical Support Test at $9.24 as Uniswap Bulls Fight Back
UNI rebounds to $9.24 (+3.14%) after testing $8.35 support, but bearish MACD signals suggest caution ahead despite Uniswap v4's $1B TVL milestone.
UNI Price Drops 3.77% as Uniswap Tests Lower Bollinger Band Support
UNI price fell to $8.92 (-3.77%) as Uniswap approaches oversold territory with RSI at 44.27. Technical indicators suggest potential bounce from $8.48 support level.
UNI Price Drops 9.3% Despite Recent Rally - Critical Support at $8.35 Tested
Uniswap (UNI) trades at $9.07 after a 9.3% decline, testing key support levels following last week's massive 276% surge from governance upgrades.
UNI Price Shows Mixed Signals as Uniswap Tests $10 Support Zone
UNI price trades at $10.17 (-0.81% daily) with bullish long-term trend intact despite bearish MACD momentum. Key resistance at $11.69 awaits breakout.
Uniswap (UNI) Retreats to $10.17 After Massive Funding Approval Drives Weekly Rally
UNI trades at $10.17 (-2.58% today) after $165.5M governance funding sparked 15% weekly gains, with technical analysis showing mixed signals ahead.
UNI Price Drops 6% Despite Strong Bullish Trend - Key Levels to Watch
Uniswap (UNI) trades at $10.36 after a 6.15% daily decline, but technical indicators suggest the broader bullish trend remains intact with RSI holding neutral territory.
Uniswap (UNI) Consolidates Above $10 Despite Minor Pullback as Whale Activity Drives Bullish Outlook
UNI trades at $10.45 (-3.09% daily) but maintains strong bullish momentum above key support levels following massive whale accumulation and 77% rally predictions.
Uniswap (UNI) Holds Above $10 as Whale Accumulation Fuels Bullish Momentum
UNI trades at $10.58 with strong technical indicators pointing to potential breakout toward $13 following massive whale withdrawals from exchanges.
UNI Price Surges 4.3% as Uniswap Shows Very Strong Bullish Momentum
UNI trades at $10.44 after a 4.3% daily gain, with technical indicators pointing to continued upside potential as Uniswap breaks above key moving averages.
Uniswap (UNI) Breaks $10 Barrier as Whale Accumulation Drives Multi-Month Rally
UNI trading at $10.03 after reaching multi-month highs above $10.34, driven by massive whale accumulation and technical breakout signals targeting $13.00.
Uniswap (UNI) Surges to $10.33 as Whale Accumulation Fuels Rally Above Key Resistance
UNI trades at $10.33 (+2.92% in 24h) after whale-driven rally pushes token above $10 resistance. Technical indicators show bullish momentum with potential for further gains.
Uniswap (UNI) Surges to $10.75 as Whale Accumulation Fuels 15% Weekly Rally
UNI price climbs to $10.75 with strong bullish momentum driven by massive whale accumulation and 72.95B dormant tokens awakening, signaling renewed institutional interest.
Uniswap Breaks $10 as Whale Accumulation Drives 15% Rally to Multi-Month Highs
UNI price surges to $10.34 following massive whale accumulation and 72.95B dormant token movement, with technical indicators pointing to potential $11+ breakout.
Uniswap (UNI) Surges to $10.38 After Record 72.95B Dormant Token Movement and Technical Breakout
UNI rallies 3.38% to $10.38 following massive dormant token awakening and bullish technical breakout above key resistance levels in July 2025.
Uniswap (UNI) Surges 15% to $10.25 as Whale Accumulation Drives Bullish Momentum in July 2025
UNI breaks 160-day barrier with 15% surge driven by massive whale buying and dormant token activation, signaling potential $16 rally ahead.
Uniswap (UNI) Surges Amid v4 Launch, Key Partnerships, and Regulatory Clarity
Uniswap (UNI) is making waves with v4 adoption, strategic partnerships, and regulatory clarity. Despite challenges like a security breach, bullish momentum drives optimism.
Uniswap (UNI) Price Surges Amid v4 Adoption and Key Partnerships: Weekly Analysis
Uniswap (UNI) rallies to $9.48, driven by v4 adoption and a Sei partnership but faces regulatory challenges and security concerns. Explore market trends, analysis, and future outlook.
Uniswap (UNI) Price Rallies on v4 Adoption Amid Mixed Market Sentiment
Uniswap (UNI) experiences volatile price action as v4 adoption drives bullish momentum, offset by regulatory challenges and a security breach. What's next for UNI?
Uniswap (UNI) Surges Amid v4 Adoption, Dormant Token Awakening, and Bullish Market Sentiment
Uniswap (UNI) rallies to $9.23, fueled by v4 adoption, dormant token movements, and partnerships like Sei integration. Explore the bullish outlook and key risks ahead.
Uniswap (UNI) Surges Amid Dormant Token Awakening and v4 Adoption: Price Outlook for 2025
Uniswap (UNI) has seen significant price action this week, driven by dormant token movements, v4 adoption, and partnerships. Explore technical signals and trading insights.
Uniswap (UNI) Price Surges Amid Dormant Token Awakening and Positive Technical Momentum
Uniswap (UNI) shows renewed bullish momentum with a price rally reaching $8.82, driven by record dormant token movement, increased user activity, and positive technical signals.
Uniswap (UNI) Price Rallies 6.53% – Is Now the Time to Buy? Comprehensive Analysis & Trading Insights
Uniswap (UNI) surges 6.53% in 24 hours, breaking above key resistance levels. Explore recent news, technical analysis, and actionable trading recommendations here.
Uniswap (UNI) Price Analysis: Bullish Momentum Continues as UNI Eyes Key Resistance Levels
** Uniswap (UNI) surges 6.46% in 24 hours, trading at $8.29. With bullish signals across indicators, UNI eyes resistance at $8.68. Read for detailed analysis & trading tips.
VeChain Consolidates Near $0.02 as Neutral RSI Signals Range-Bound Trading Ahead
VET price holds steady at $0.02 despite 0.47% daily decline, with technical indicators suggesting continued sideways movement as traders await catalyst for directional breakout.
VeChain Tests Key Support at $0.02 as Fed Rate Cut Optimism Fades
VET price consolidates at $0.02 following last week's 9% surge, with technical indicators showing mixed signals as traders await next catalyst for VeChain's momentum.
VeChain Price Action: VET Consolidates at $0.02 Amid Neutral Market Sentiment
VeChain trades at $0.02 with 2.51% daily gains as VET technical analysis reveals consolidation near Bollinger Band support with RSI showing neutral momentum.
VeChain (VET) Price Holds Support at $0.02 as Technical Indicators Flash Mixed Signals
VET price trades at $0.02 with bearish momentum but RSI suggests oversold relief rally potential as token tests critical support levels.
VeChain (VET) Price Hovers Near Lower Support as Bearish Momentum Builds
VET price trades at $0.02 with -3.72% daily decline as technical indicators signal neutral to bearish sentiment, testing key support levels on low trading volume.
VeChain (VET) Price Holds Steady at $0.02 as Technical Indicators Signal Neutral Territory
VET price maintains $0.02 level with 0.61% daily gain. VeChain's RSI at 41.75 suggests neutral momentum while traders eye key resistance at $0.03.
VeChain (VET) Consolidates at $0.02 as RSI Shows Neutral Territory
VET price holds steady at $0.02 with minor -0.09% decline. Technical indicators suggest consolidation phase with RSI at 40.96 signaling potential oversold bounce opportunity.
VeChain (VET) Price Holds $0.02 Support as Neutral Momentum Builds
VET price trades at $0.02 amid neutral RSI conditions and compressed volatility, with key resistance at $0.03 presenting next major test for bulls.
VeChain (VET) Holds Critical $0.02 Support as Technical Indicators Show Mixed Signals
VET price trades at $0.02 after 4.41% decline, with bullish MACD divergence conflicting with neutral RSI readings as traders watch key support levels.
VeChain (VET) Price Soars 2.50% as Technical Indicators Flash Bullish Signals
VET price hits $0.03 with bullish momentum building. Technical analysis reveals VeChain approaching key resistance levels with strong volume support.
VeChain (VET) Surges 6.62% as Technical Indicators Flash Bullish Momentum
VET price climbs to $0.03 with strong bullish signals emerging from technical analysis. Key resistance at $0.03 while momentum indicators suggest continued upside potential.
VeChain (VET) Holds $0.02 Despite Major VTHO Rewards Launch and Wanchain Partnership
VET price remains stable at $0.02 following 5.4B VTHO rewards program announcement and strategic Wanchain partnership, with neutral RSI suggesting sideways movement ahead.
VeChain Price Analysis: VET Shows Neutral Momentum at $0.02 Support Level
VET price holds steady at $0.02 with 1.92% daily gains while technical indicators signal neutral momentum and potential consolidation phase ahead.
VeChain (VET) Price Holds Steady at $0.02 Despite Market Uncertainty
VET price maintains $0.02 level with neutral momentum signals, though technical indicators suggest potential for movement as RSI sits at 47.85 in neutral territory.
VeChain VET Price Analysis: Bulls and Bears Battle at $0.02 Support Amid VTHO Rewards Launch
VET price trades at $0.02 despite 3.96% daily decline. New 5.48B VTHO rewards program supports bullish momentum while technical indicators show mixed signals for traders.
VeChain (VET) Surges 4.96% as $5.4B VTHO Rewards Program Launches
VET price climbs to $0.03 with bullish momentum as VeChain announces massive VTHO staking rewards ahead of Hayabusa upgrade, RSI approaching overbought territory.
VeChain (VET) Shows Bullish Momentum at $0.02 - Technical Breakout Signals Emerge
VET price holds steady at $0.02 with +1.02% gains as technical indicators flash mixed signals. MACD histogram turns bullish while RSI remains neutral at 52.93.
VeChain (VET) Shows Resilience at $0.02 as VTHO Rewards Program Launches
VET price holds steady at $0.02 with 1.28% gains despite market headwinds. New 5.4B VTHO staking rewards and neutral RSI suggest potential upside ahead.
VeChain (VET) Consolidates at $0.02 Despite Major VTHO Rewards Program Launch
VET price holds steady at $0.02 with neutral RSI at 48.13 as traders evaluate new 5.4B VTHO staking rewards against broader market headwinds.
VeChain (VET) Consolidates at $0.02 as VTHO Rewards Program Launches Ahead of Hayabusa Upgrade
VET price holds steady at $0.02 with 3.23% daily gains despite weekly decline, as 5.4B VTHO rewards program launches before major Hayabusa upgrade.
VeChain (VET) Consolidates at $0.02 as 5.4B VTHO Rewards Program Launches
VET price holds steady at $0.02 (+0.77% daily) despite major VTHO staking rewards launch. Technical indicators show neutral momentum as Hayabusa upgrade approaches.
VeChain (VET) Price Stagnates at $0.02 as Technical Indicators Show Mixed Signals
VET price remains flat at $0.02 with RSI at 44.03, suggesting neutral momentum while key resistance at $0.03 continues to hold traders back.
VeChain (VET) Price Holds $0.02 Support as Technical Indicators Signal Neutral Territory
VET price maintains $0.02 level with 1.54% daily gain, while RSI at 46.66 suggests neutral momentum amid sideways consolidation pattern for VeChain traders.
VeChain (VET) Tests Critical Support at $0.02 Despite Bullish Institutional Adoption
VET price consolidates at $0.02 with bearish momentum signals despite recent Franklin Templeton partnership and upcoming Hayabusa upgrade targeting 400% gains.
VeChain (VET) Holds Steady at $0.02 as Neutral Signals Dominate Market
VET price remains flat at $0.02 with minimal volatility. Technical indicators show neutral momentum as VeChain consolidates near key support levels.
VeChain (VET) Price Consolidates at $0.02 as Technical Indicators Show Mixed Signals
VET price holds steady at $0.02 despite slight 24h decline of 0.29%. VeChain technical analysis reveals neutral momentum with VET RSI at 45.82, suggesting potential for directional move.
VeChain (VET) Retreats 1.29% Despite Weekly Gains - Technical Analysis Shows Mixed Signals
VET price drops to $0.02 with bearish momentum emerging, though weekly gains of 8.2% suggest underlying strength remains intact for VeChain investors.
VeChain (VET) Price Analysis: 400% Upside Potential Despite Neutral Momentum
VET price holds steady at $0.02 with neutral RSI at 50.20 as analysts predict 400% potential gains targeting $0.0825 driven by institutional adoption.
VeChain (VET) Consolidates at $0.02 as Technical Indicators Signal Neutral Momentum
VET price holds steady at $0.02 with 0.66% daily gains as technical analysis reveals mixed signals and neutral RSI conditions for VeChain traders.
VeChain (VET) Price Drops 6% as Technical Indicators Signal Neutral Territory
VET price currently at $0.02 after a 5.97% decline, with RSI at 48 suggesting sideways consolidation ahead for VeChain traders.
VeChain (VET) Holds $0.03 as Technical Indicators Flash Mixed Signals
VET price trades at $0.03 with neutral RSI at 52.56, while MACD signals show potential bullish momentum despite recent 0.32% decline in trading activity.
VeChain (VET) Shows Weak Bullish Momentum as VET Price Holds Above $0.03
VET price trades at $0.03 with +2.94% daily gains. Technical indicators suggest neutral momentum while VeChain faces key resistance at current levels.
VeChain (VET) Price Faces Resistance at $0.03 Despite Bullish MACD Signals
VET price drops 6.86% to $0.02 as VeChain struggles below key resistance. Technical indicators show mixed signals with neutral RSI but positive MACD momentum.
VeChain (VET) Technical Analysis: Neutral RSI Signals Mixed Outlook Amid $0.02 Trading Range
VET price currently trades at $0.02 after a 2.70% decline, with VeChain's RSI at 48.68 suggesting neutral momentum as traders watch key support and resistance levels.
VeChain (VET) Price Holds $0.02 Support as OrionOne Partnership Drives Logistics Integration
VET trades at $0.02 (-1.29% in 24h) with neutral RSI signals while fresh OrionOne partnership strengthens blockchain logistics adoption prospects.
VeChain (VET) Price Holds $0.02 Support as Bullish Fractal Pattern Emerges
VET trades at $0.02 (-2.17% daily) while technical analysis reveals bullish fractal structure and new OrionOne partnership strengthens logistics adoption.
VeChain (VET) Holds $0.03 Amid Mixed Technical Signals - Neutral RSI Suggests Consolidation
VET price trades at $0.03 with 2.23% daily gains. Technical indicators show mixed signals as VeChain's RSI sits neutral at 54.88, suggesting potential consolidation phase.
VeChain (VET) Price Holds $0.02 as RSI Shows Neutral Territory Amid StarGate Staking Framework
VET price maintains $0.02 with 2.58% daily gains as technical indicators signal neutral momentum following VeChain's StarGate staking framework announcement.
VeChain (VET) Consolidates Near Support as Technical Indicators Show Mixed Signals
VET price holds steady at $0.02 despite 0.13% daily decline, with RSI at 44.33 suggesting potential for either direction as traders await catalyst.
VeChain (VET) Shows Mixed Signals as Price Holds $0.02 Support Level
VET price maintains $0.02 with 2.38% daily gains, but technical indicators suggest cautious optimism as VeChain faces key resistance at $0.03 levels.
VeChain (VET) Price Analysis: Technical Indicators Signal Caution Despite Franklin Templeton Integration
VET price trades at $0.02 with neutral momentum as VeChain RSI sits at 41.31. Recent Franklin Templeton adoption provides bullish catalyst despite mixed technical signals.
VeChain (VET) Price Analysis: Neutral Zone Trading at $0.02 with Key Support Levels in Focus
VET price holds steady at $0.02 despite slight 24h decline, with technical indicators showing neutral momentum and critical support levels being tested.
VeChain (VET) Trades at $0.02 Despite Franklin Templeton Integration Boost
VET price holds $0.02 after Franklin Templeton fund integration. Technical indicators show neutral RSI at 43.43 with bearish MACD momentum suggesting consolidation ahead.
VeChain (VET) Consolidates at $0.02 as Bulls and Bears Battle Key Support Levels
VET price trades at $0.02 with neutral momentum signals, while VeChain technical analysis reveals critical support test ahead for traders.
VeChain (VET) Price Struggles at $0.02 as Bears Test Key Support Levels
VET price trades at $0.02 after a 4.84% decline, testing critical support while technical indicators show mixed signals ahead of the PoA2.0 upgrade.
VeChain (VET) Struggles at $0.03 as Bears Take Control Despite Neutral RSI
VET price drops 3.78% to $0.03 with bearish MACD signals emerging, though RSI remains neutral at 52.32 suggesting potential consolidation ahead.
VeChain (VET) Struggles Despite Franklin Templeton Integration - Technical Analysis Points to Key Support Test
VET price dropped 6.96% to $0.02 despite major institutional adoption news. Technical indicators suggest bearish momentum as VeChain tests critical support levels.
VeChain (VET) Price Holds Steady at $0.03 Despite Renaissance Upgrade Launch
VET price maintains $0.03 support level with neutral RSI at 55.4 following successful Renaissance upgrade deployment and OrionOne partnership announcement.
VeChain (VET) Rallies 4.43% as Renaissance Upgrade Drives Bullish Momentum
VET price surges to $0.03 with positive technical signals emerging as VeChain's Renaissance upgrade enhances staking rewards and burns transaction fees.
VeChain (VET) Eyes $0.12 Breakout as Price Rebounds 6% From Support
VET price trades at $0.03 with bullish momentum emerging after strong support bounce. Technical analysis suggests potential rally to $0.12 target level.
VeChain (VET) Shows Mixed Signals at $0.03 as Bulls Fight Key Resistance
VET trades at $0.03 (-3.98% today) with RSI at 67.39 showing neutral momentum while technical indicators flash conflicting signals near critical resistance levels.
VeChain Price Surges to $0.03 as VET RSI Signals Overbought Territory
VET price climbs 2.54% to $0.03 with RSI hitting 76.19, indicating potential consolidation ahead as momentum indicators show mixed signals for traders.
Understanding VWAP: A Crucial Tool for Crypto Traders
Explore how VWAP, a vital trading indicator, helps traders discern market trends and make informed decisions through its volume-weighted price analysis.
WIF Price Prediction: dogwifhat Targets $0.42 Resistance Break for 25% Rally to $0.48
WIF price prediction shows potential rally to $0.42-$0.48 range as technical indicators signal bullish momentum building. Critical resistance test ahead for dogwifhat.
WIF Price Prediction: Targeting $0.54 Rally by December 31st as Technical Indicators Turn Bullish
WIF price prediction shows potential 32% upside to $0.54 target by year-end, with MACD histogram turning positive and RSI neutral at 50.58 supporting near-term bullish momentum.
WIF Price Prediction: Targeting $0.48 Resistance Break Within 2 Weeks
dogwifhat (WIF) shows bullish momentum signals despite recent consolidation. Technical analysis suggests a potential move to $0.48 resistance with upside to $0.58 if momentum sustains.
WIF Price Prediction: Targeting $0.54 Short-Term Before Year-End Rally to $0.84
WIF price prediction indicates a potential 35% rally to $0.54 within one week, with year-end targets reaching $0.84 based on technical momentum and analyst forecasts.
WIF Price Prediction: Dogwifhat Eyes $0.50 Recovery Target Within 4 Weeks Despite Short-Term Headwinds
WIF price prediction points to potential $0.50 recovery by January 2025, though immediate downside risk to $0.30 remains as technical indicators show mixed signals.
WIF Price Prediction: Dogwifhat Eyes $0.50 Breakout by Year-End 2024 Despite Mixed Signals
WIF price prediction shows potential recovery to $0.50 within 4 weeks, though bearish risks remain below $0.31 support level amid neutral RSI conditions.
WIF Price Prediction: Targeting $0.47-$0.61 by January 2026 Despite Near-Term Weakness
dogwifhat technical analysis reveals mixed signals with bearish momentum dominating short-term outlook, but medium-term WIF price prediction targets $0.47-$0.61 range.
WIF Price Prediction: Targeting $0.45-0.50 Recovery Within 2 Weeks as Technical Indicators Show Early Reversal Signs
WIF price prediction suggests potential recovery to $0.45-0.50 range over next 2 weeks as MACD histogram turns positive and oversold conditions create bounce opportunity from current $0.34 level.
WIF Price Prediction: Targeting $0.45 Within 10 Days as MACD Signals Bullish Reversal
WIF price prediction shows bullish momentum building with MACD histogram turning positive. Technical analysis targets $0.45 resistance if $0.39 pivot holds.
WIF Price Prediction: Targeting $0.45 Within 10 Days as Technical Momentum Builds
WIF price prediction shows bullish momentum emerging with MACD histogram turning positive. Targeting $0.45 resistance within 10 days if $0.39 pivot holds.
WIF Price Prediction: Targeting $0.40 Breakout Within 2 Weeks as Technical Recovery Signals Emerge
dogwifhat shows early bullish momentum with WIF price prediction targeting $0.40 resistance break in coming weeks, though $0.31 support remains critical for upside continuation.
WIF Price Prediction: dogwifhat Targets $0.38 Rally Before Testing $0.26 Support Through December 2025
WIF price prediction shows mixed signals with short-term potential to $0.38, but bearish momentum suggests dogwifhat could test $0.26 support if $0.31 breaks.
WIF Price Prediction: Dogwifhat Eyes Recovery to $0.58 by December 2025 Despite Current Weakness
WIF price prediction targets $0.58-$0.65 recovery by December 2025, but immediate support at $0.32 must hold for bullish dogwifhat forecast to materialize.
WIF Price Prediction: dogwifhat Eyes $0.55 Recovery Despite Current Bearish Momentum - Key $0.37 Support Holds
WIF price prediction shows potential recovery to $0.55 within 2 weeks if critical $0.37 support holds, while bearish scenario targets $0.32 retest.
WIF Price Prediction: Targeting $0.48 Recovery Within Two Weeks Amid Oversold Conditions
dogwifhat shows oversold RSI at 38.08 with MACD improving. WIF price prediction targets $0.48 (+20%) short-term recovery if $0.37 support holds firm.
WIF Price Prediction: Targeting $0.48 Breakout Within 2 Weeks as Technical Indicators Signal Recovery
WIF price prediction indicates a potential 17% rally to $0.48 resistance level within two weeks, supported by improving MACD momentum despite oversold RSI conditions at $0.41.
WIF Price Prediction: dogwifhat Eyes $0.58 Breakout With 35% Upside Potential by December 2025
WIF price prediction targets $0.58 resistance break for bullish continuation. Technical analysis suggests dogwifhat could reach $0.65-$0.70 range within 4-6 weeks if momentum builds.
WIF Price Prediction: Targeting $0.58 Recovery Within 7 Days After 66% Drop
dogwifhat (WIF) shows bullish MACD divergence at $0.43, targeting $0.58 resistance for 35% upside potential in the next week despite recent 7.58% decline.
WIF Price Prediction: dogwifhat Targeting $0.58 Breakout Within 7 Days
WIF price prediction shows potential 21% upside to $0.58 resistance level, with dogwifhat forecast supported by bullish MACD divergence and oversold conditions near key support.
WIF Price Prediction: Targeting $0.58-$0.65 Range by December 2025 Amid Technical Recovery
dogwifhat (WIF) shows early bullish momentum signals with MACD histogram turning positive. WIF price prediction suggests $0.58-$0.65 target within 4-6 weeks if key resistance breaks.
WIF Price Prediction: Targeting $1.15-$1.24 by December 2025 Despite Current Weakness
WIF price prediction suggests recovery to $1.15-$1.24 range within 4-6 weeks as technical indicators show early bullish momentum despite trading 63% below 52-week high.
WIF Tests $0.55 Support as Meme Coin Consolidates Below Key Moving Averages
Dogwifhat trades at $0.55 after a 1.26% decline, testing critical support levels as technical indicators signal potential consolidation phase ahead.
WIF Price Rallies 7.6% as Technical Indicators Signal Potential Recovery from Oversold Levels
Dogwifhat (WIF) climbs to $0.55 amid improving momentum indicators, though key resistance levels ahead could determine whether this bounce has staying power in current market conditions.
WIF Tests Key Support at $0.51 as Meme Coin Sector Faces Broader Crypto Market Headwinds
dogwifhat (WIF) trades at $0.51 after a modest 0.19% decline, testing critical support levels as technical indicators signal potential consolidation ahead of next directional move.
WIF Trades Near Bollinger Band Support as Bitcoin Decline Pressures Meme Tokens
Dogwifhat (WIF) holds $0.51 amid broader crypto weakness, testing critical Bollinger Band support as technical indicators signal oversold conditions in meme token sector.
WIF Technical Breakdown: How dogwifhat Diverges from Broader Crypto Market Trends
WIF price sits at $0.72 amid bearish momentum, with technical indicators revealing divergent patterns from major cryptocurrencies in current market conditions.
WIF Price Struggles Near Support as dogwifhat Tests Critical $0.72 Level
WIF trades at $0.72 (-2.56%) with technical indicators flashing mixed signals as dogwifhat approaches key support levels amid weak bullish momentum.
dogwifhat (WIF) Price Tests Critical Support at $0.76 Amid Bearish Momentum
WIF price drops 4.76% to $0.76, approaching key support levels as technical indicators signal continued downward pressure for the Solana-based memecoin.
WIF Price Drops to $0.80 as dogwifhat Tests Critical Support Levels
dogwifhat (WIF) trades at $0.80 with bearish momentum building as WIF RSI hits 40.87 and price approaches key support at $0.76
WIF Price Struggles Below Key Moving Averages as dogwifhat Shows Bearish MACD Signals
dogwifhat (WIF) trades at $0.80 with bearish momentum emerging. Technical indicators suggest potential downside as WIF price remains below critical resistance levels.
dogwifhat (WIF) Plunges 10.5% as Bears Test Critical Support at $0.77
WIF price drops to $0.79 amid heavy selling pressure, with technical indicators showing bearish momentum as the meme coin approaches key support levels.
WIF Price Holds Above Key Support as dogwifhat Shows Neutral Technical Signals
dogwifhat (WIF) trades at $0.90 with modest 0.22% daily gains. Technical indicators suggest consolidation phase with WIF RSI at neutral 50.16 levels.
WIF Price Analysis: dogwifhat Shows Mixed Signals at $0.89 Despite Overall Bullish Trend
dogwifhat (WIF) trades at $0.89 after a 5.60% daily decline, but technical indicators suggest potential recovery as WIF RSI remains neutral at 49.96.
WIF Price Holds Above Key Support as dogwifhat Shows Mixed Technical Signals
dogwifhat (WIF) trades at $0.94, down 0.63% today. Technical indicators suggest consolidation phase with bullish MACD but neutral RSI levels.
WIF Price Surges 4.17% to $0.95 as dogwifhat Shows Strong Bullish Momentum
WIF price climbs to $0.95 with bullish MACD signals and strong momentum indicators suggesting potential breakout above key resistance levels.
WIF Price Surges Above $0.90 as dogwifhat Shows Strong Bullish Momentum
dogwifhat (WIF) trades at $0.91 with bullish MACD signals and strong momentum indicators pointing to potential breakout above key resistance levels.
WIF Price Surges 6.15% as dogwifhat Shows Strong Bullish Momentum
dogwifhat (WIF) trades at $0.92, up 6.15% in 24 hours, with technical indicators signaling continued bullish momentum as the token breaks above key moving averages.
WIF Price Analysis: dogwifhat Tests $0.88 Support as Mixed Signals Emerge
dogwifhat (WIF) trades at $0.88 with -6.17% daily decline, showing bullish MACD divergence despite neutral RSI and approaching key support levels.
WIF Price Holds Above Key Support Despite 3.7% Daily Drop - Technical Analysis Shows Mixed Signals
dogwifhat (WIF) trades at $0.94 after a 3.68% decline, but bullish momentum indicators suggest potential reversal from current support levels.
dogwifhat (WIF) Surges 7.64% as Technical Indicators Flash Bullish Signals Above $0.97
WIF price climbs to $0.97 with strong bullish momentum as MACD histogram turns positive and RSI holds neutral territory, suggesting further upside potential.
WIF Price Surges 1.7% as dogwifhat Technical Analysis Shows Bullish Momentum Building
dogwifhat (WIF) trades at $0.90 with bullish MACD histogram signaling potential breakout above $0.93 resistance as momentum indicators turn favorable.
WIF Price Breaks Above Key Moving Averages as Bullish Momentum Builds
dogwifhat (WIF) trades at $0.89, up 3.63% in 24h, showing bullish signals as price breaks above multiple SMAs with RSI in neutral territory at 53.92.
WIF Price Rallies 3% as dogwifhat Shows Bullish Technical Signals
dogwifhat (WIF) trades at $0.88, up 3.04% in 24 hours, with technical indicators suggesting potential upward momentum as WIF price approaches key resistance levels.
WIF Price Surges 3.16% as dogwifhat Shows Mixed Technical Signals
WIF trades at $0.85 with bullish MACD momentum despite neutral RSI readings. Key resistance at $0.94 could determine next move for dogwifhat traders.
WIF Price Rallies 3.86% as dogwifhat Technical Indicators Turn Bullish
WIF trades at $0.83 with 3.86% daily gains as technical analysis reveals emerging bullish momentum despite mixed moving average signals across key timeframes.
WIF Price Shows Mixed Signals as dogwifhat Struggles Near $0.81 Support
dogwifhat (WIF) trades at $0.81 with modest 1.12% gains, but technical indicators reveal conflicting signals as the meme coin battles key support levels.
dogwifhat (WIF) Price Analysis: Neutral RSI and Bullish MACD Signal Mixed Signals at $0.81
WIF price trades at $0.81 with a modest 0.37% daily gain, as dogwifhat technical analysis reveals conflicting momentum signals between neutral RSI and emerging bullish MACD crossover.
WIF Price Holds Steady at $0.81 Despite Market Volatility
Dogwifhat trades at $0.81 with bullish MACD signals emerging while testing key support levels in sideways action.
WIF Price Tests Critical Support at $0.80 as Technical Indicators Show Mixed Signals
dogwifhat (WIF) trades at $0.80 with 3.09% daily gains, but technical analysis reveals bearish MACD divergence challenging the bullish trend classification.
WIF Price Rallies 2.83% as dogwifhat Tests Critical Support Levels
dogwifhat (WIF) trades at $0.80 with 2.83% daily gains, but technical indicators suggest caution as WIF approaches key resistance zones.
dogwifhat (WIF) Slides to $0.80 as Technical Indicators Flash Mixed Signals
WIF price drops 1.85% to $0.80 amid neutral RSI and bearish MACD signals. Key support at $0.75 holds while traders eye resistance at $1.07.
WIF Price Holds $0.81 Support as Technical Indicators Flash Mixed Signals
dogwifhat (WIF) trades at $0.81 with neutral RSI at 43.54, showing consolidation between key support at $0.76 and resistance at $1.07 amid low volatility.
dogwifhat (WIF) Tests Key Support at $0.76 as Bears Eye Further Downside
WIF price holds at $0.81 (+0.62% daily) near critical support levels. Technical indicators show mixed signals as dogwifhat approaches key decision point.
WIF Price Drops 4% as dogwifhat Tests Critical Support at $0.76
dogwifhat (WIF) trades at $0.80 after a 4.07% decline, approaching key support levels with bearish momentum signals emerging across multiple timeframes.
WIF Price Analysis: dogwifhat Shows Mixed Signals as RSI Stays Neutral at $0.83
WIF trades at $0.83 with modest 0.61% gains, but technical indicators reveal conflicting signals as dogwifhat faces key resistance ahead.
WIF Price Drops 3.3% as dogwifhat Tests Critical Support at $0.88
dogwifhat (WIF) trades at $0.88 after a 3.3% daily decline, approaching key support levels with RSI signaling potential oversold conditions ahead.
WIF Price Drops to $0.90 Despite 19% Weekly Gains - Technical Analysis Shows Mixed Signals
dogwifhat (WIF) trades at $0.90 with 2.28% daily gains but faces technical headwinds as momentum indicators signal potential weakness ahead.
dogwifhat (WIF) Drops 12% Despite Strong Weekly Performance - Key Support Tests Ahead
WIF price falls to $0.93 after 12% daily decline, testing critical support levels despite posting 19% weekly gains. Technical indicators signal mixed momentum.
WIF Price Surges 4.32% as dogwifhat Technical Analysis Shows Bullish Momentum
WIF trades at $1.06 with strong bullish signals emerging. Technical indicators suggest continued upside potential as dogwifhat breaks above key moving averages.
Dogwifhat (WIF) Surges 9.66% as Bulls Target $1.18 Resistance Level
WIF price climbs to $1.01 with strong momentum indicators signaling potential breakout above key resistance levels after recent 21% rally.
WIF Price Drops 8% as dogwifhat Tests Critical Support at $0.90
dogwifhat (WIF) trades at $0.90 after an 8.22% decline, with technical indicators showing mixed signals as the meme coin approaches key support levels.
Dogwifhat (WIF) Price Analysis: Technical Consolidation After 60% Weekly Surge
WIF trades at $0.98 with neutral momentum as technical indicators suggest consolidation following last week's dramatic 60% rally driven by hat auction hype.
WIF Price Retreats 3.25% After 21% Surge as dogwifhat Tests Key Support
WIF currently trades at $0.98, down 3.25% in 24 hours, as traders take profits following this week's dramatic 21% surge triggered by the iconic hat auction.
Dogwifhat (WIF) Price Analysis: Mixed Signals as Community Momentum Meets Technical Resistance
WIF trades at $0.98 (+3.25% today) amid community enthusiasm following $800K hat auction, but technical indicators suggest caution at current levels.
WIF Price Breaks Above $0.89 as dogwifhat Shows Mixed Technical Signals
dogwifhat (WIF) trades at $0.89 with 3.72% daily gains, but technical indicators suggest caution as the token remains below key moving averages.
dogwifhat (WIF) Rallies 5.57% Despite Technical Headwinds - Key Levels to Watch
WIF price surges to $0.93 with 5.57% daily gains, but technical indicators suggest mixed signals as the memecoin tests critical resistance levels.
WIF Price Holds Above $0.88 Despite Bearish Momentum Signals
dogwifhat (WIF) trades at $0.88 with neutral RSI at 41.52, but bearish MACD signals and proximity to lower Bollinger Band support suggest caution ahead.
WIF Price Faces Pressure at $0.88 Despite Recent 32% Weekly Surge
dogwifhat (WIF) trades at $0.88 amid pullback, testing critical support after impressive weekly gains as technical indicators show mixed signals.
Dogwifhat (WIF) Battles for Recovery Above $0.99 as Support Levels Face Pressure
WIF price trades at $0.99 (+0.92%) as bulls attempt recovery, but recent correction tests key support at $0.91 following last week's 24% surge.
Dogwifhat (WIF) Faces Correction After 24% Rally - Key Support at $0.91 Under Pressure
WIF price drops 9.41% to $0.94 as profit-taking pressures emerge following recent cup-and-handle pattern formation, with critical support levels now being tested.
WIF Price Drops 8.4% Despite Bullish Chart Patterns as dogwifhat Tests Key Support
WIF trades at $1.06 after an 8.4% decline, testing crucial support levels while technical analysis reveals mixed signals amid recent whale accumulation activity.
Dogwifhat (WIF) Battles at $1.04 as Bears Test Key Support Despite Whale Accumulation
WIF price trades at $1.04 after a 6.36% decline, testing crucial support levels while technical indicators show mixed signals amid recent whale buying activity.
WIF Price Holds Above $1.10 as dogwifhat Shows Mixed Technical Signals
dogwifhat (WIF) trades at $1.10 with modest 1.39% gains, while technical indicators present conflicting signals for traders in the near term.
Dogwifhat (WIF) Surges 6.14% as Bulls Fight Back Despite Recent Trendline Test
WIF price recovers to $1.07 with 6.14% gains after retesting key support at $1.20, showing bullish momentum as technical indicators signal potential breakout above resistance.
dogwifhat (WIF) Price Drops 7.25% as Technical Indicators Signal Mixed Momentum
WIF price falls to $1.01 amid bearish short-term signals, though longer-term bullish trend remains intact with key support at $0.82 holding firm.
Dogwifhat (WIF) Pulls Back to $1.09 After Testing $1.30 - Bulls Fight to Hold Key Support
WIF price retreats 7.26% to $1.09 after hitting $1.30, but technical indicators suggest bullish momentum remains intact with strong whale accumulation continuing.
Dogwifhat (WIF) Surges 10% to $1.30 as Whale Accumulation Fuels Breakout Momentum
WIF price hits $1.30 with 9.76% daily gains as $39M whale buying spree signals strong institutional confidence, though overbought RSI warns of potential pullback risks.
Dogwifhat Soars 13.8% as Whale Accumulation Drives WIF Toward $1.30 Breakout
WIF price hits $1.24 with massive whale buying driving 13.8% gains. Technical indicators show bullish momentum as dogwifhat approaches key resistance levels.
WLD Price Prediction: Worldcoin Eyes $0.67 Target Despite Mixed Signals - December 2025 Forecast
WLD price prediction shows potential rally to $0.67 resistance within 2 weeks, though bearish risks remain at $0.55 support. Technical indicators present conflicting signals.
WLD Price Prediction: Worldcoin Targets $0.67 Breakout After Recent 3.29% Rally
WLD price prediction shows potential move to $0.67 resistance within 2 weeks, with technical indicators turning bullish despite bearish analyst consensus targeting $0.55.
WLD Price Prediction: Worldcoin Eyes $0.48-$0.55 Range as Bears Target Critical Support
WLD price prediction suggests downside to $0.48-$0.55 in coming weeks as technical indicators turn bearish despite recent 2.69% bounce from key support levels.
WLD Price Prediction: Targeting $0.73 Breakout Within 4 Weeks Despite Current Consolidation
WLD price prediction shows potential rally to $0.73 resistance level over next month, with current $0.58 support holding. Technical indicators suggest bullish momentum building.
WLD Price Prediction: $0.48-$0.82 Range with Critical Support Test at $0.58
Worldcoin faces bearish pressure with analysts targeting $0.48 short-term decline, while long-term forecasts suggest $0.82 by 2030. Critical support at $0.58 determines direction.
WLD Price Prediction: Targeting $0.48-$0.82 Range with Mixed Short-Term Signals
WLD price prediction shows bearish short-term outlook toward $0.48, but Worldcoin forecast suggests potential recovery to $0.82 long-term based on technical analysis.
WLD Price Prediction: Targeting $0.68-$0.75 Range by End December 2025
Worldcoin forecast points to potential 8-19% upside as WLD shows bullish MACD momentum despite mixed analyst predictions targeting $0.68-$0.75 resistance zone.
WLD Price Prediction: Worldcoin Eyes $0.73 Recovery by January 2025 Despite Current Oversold Conditions
WLD price prediction points to potential 28% rally to $0.73 within 4-6 weeks as bullish MACD divergence emerges, though immediate support at $0.57 remains critical for the forecast.
WLD Price Prediction: Worldcoin Eyes $0.73 Recovery by Year-End Despite Current Weakness
WLD price prediction targets $0.73 recovery within 4 weeks as bullish MACD divergence emerges, though immediate support at $0.57 remains critical for Worldcoin forecast.
WLD Price Prediction: Worldcoin Eyes $0.58-$0.65 Range as Technical Indicators Signal Mixed Outlook Through December 2025
WLD price prediction shows potential decline to $0.58 support with bearish analyst consensus, though bullish MACD divergence suggests possible recovery to $0.73 by year-end.
WLD Price Prediction: Targeting $0.75 Recovery Within 4 Weeks Amid Technical Consolidation
Worldcoin shows bullish momentum signals with MACD histogram turning positive, targeting $0.75 medium-term as analysts forecast recovery from current $0.66 levels.
WLD Price Prediction: Worldcoin Eyes $0.75 Recovery by December 2025 Despite Bearish Headwinds
WLD price prediction suggests potential rally to $0.75 within 4 weeks as technical indicators show early bullish momentum, though $0.54 risk remains if support fails.
WLD Price Prediction: Targeting $0.62 Resistance Test Before Potential $0.54 Decline
Worldcoin faces critical $0.57 support test with analyst targets ranging $0.54-$0.62. Technical indicators suggest bearish momentum may drive WLD toward $0.54 by early December.
WLD Price Prediction: Worldcoin Eyes $0.68 Recovery Before Potential $13.83 Long-Term Surge
WLD price prediction suggests near-term bounce to $0.68 despite current oversold conditions, while bold 2026 forecast targets $13.83 amid institutional accumulation signals.
WLD Price Prediction: Targeting $0.54 by November 20 as Bearish Momentum Intensifies
WLD price prediction shows continued downside with CoinCodex forecasting $0.538398 by November 20. Technical indicators signal bearish momentum as Worldcoin trades near critical support.
WLD Price Prediction: Targeting $0.75-$0.85 by December 2025 Despite Near-Term Headwinds
WLD price prediction shows mixed signals with analysts targeting $0.66-$0.79 short-term, while technical analysis suggests potential recovery to $0.75-$0.85 range within 4-6 weeks if key support ho...
WLD Price Prediction: Worldcoin Eyes $0.84 Recovery Target Amid Technical Oversold Conditions
WLD price prediction suggests potential rebound to $0.84 within 2 weeks as Worldcoin tests key support at $0.65, with RSI at oversold levels signaling possible reversal.
WLD Price Prediction: Targeting $0.84-$0.90 Recovery Within 4-6 Weeks Despite Near-Term Volatility
WLD price prediction suggests recovery to $0.84-$0.90 range over next month as bullish MACD divergence and oversold conditions signal potential reversal from current $0.70 level.
WLD Price Prediction: Targeting $0.84-$0.90 Range as Technical Setup Suggests 15-20% Upside
WLD price prediction points to $0.84-$0.90 targets within 2-3 weeks as MACD turns bullish and whale accumulation builds momentum above $0.82 resistance.
WLD Price Prediction: Targeting $0.84-$0.90 Range Within Two Weeks as Technical Momentum Builds
WLD price prediction shows bullish momentum developing with MACD histogram turning positive. Worldcoin forecast targets $0.84-$0.90 range over next 14 days if key resistance breaks.
WLD Price Prediction: Worldcoin Eyes $0.65 Retest Before Potential Recovery to $0.97 by December 2025
WLD price prediction shows mixed signals with bearish analyst targets of $0.564-$0.805 for November 10th, while technical analysis suggests critical support test at $0.65 ahead.
WLD Price Prediction: Worldcoin Eyes $0.90-$0.95 Target as Technical Indicators Signal Bullish Momentum
WLD price prediction points to $0.90-$0.95 target within 2 weeks as MACD histogram turns positive and RSI shows room for upside despite recent consolidation.
WLD Price Tests Critical $0.90 Support as Technical Indicators Flash Mixed Signals
Worldcoin trades at $0.90 following a 4.4% decline, with RSI neutral at 36.67 while price action tests key pivot levels amid broader crypto market weakness.
WLD Tests Key Support at $0.88 Amid Broad Crypto Weakness as RSI Signals Oversold Conditions
Worldcoin trades at $0.88 following a 0.6% decline as the token approaches critical support levels while technical indicators suggest potential oversold bounce opportunity.
WLD Tests Lower Bollinger Band Support at $0.88 as Bearish Momentum Intensifies
Worldcoin slides 2% to $0.88, approaching critical lower band support with RSI at 34 signaling potential oversold conditions amid broader crypto weakness.
Breaking: Worldcoin Technical Indicators Signal Mixed Momentum Despite 5% Daily Gains
WLD price surges 5.06% to $1.31 but technical indicators reveal conflicting signals with RSI neutral and MACD showing bearish momentum divergence.
WLD Price Drops 4.65% to $1.25 as Worldcoin Tests Critical Support Levels
Worldcoin (WLD) trades at $1.25 after a 4.65% decline, approaching key support at $1.22 with bearish momentum signals emerging from technical indicators.
WLD Price Analysis: Worldcoin Shows Mixed Signals as RSI Holds Neutral Territory
WLD trades at $1.29 (-2.27% daily) with neutral RSI at 46.49, testing critical support levels while maintaining bullish long-term trend despite recent weakness.
Worldcoin (WLD) Trades at $1.34 Amid Mixed Technical Signals and Neutral RSI
WLD price holds at $1.34 with +1.13% daily gains despite bearish MACD divergence. Worldcoin technical analysis reveals neutral momentum as token trades below key moving averages.
Worldcoin (WLD) Faces Technical Pressure Despite Recent 42% Surge - Key Levels to Watch
WLD price trades at $1.34 with mixed signals as momentum indicators show bearish divergence following last week's impressive rally to become top crypto gainer.
WLD Price Drops 10.6% as Worldcoin Tests Critical Support at $1.34
Worldcoin (WLD) trades at $1.34 after a sharp 10.6% decline, with technical indicators showing mixed signals as the token approaches key support levels.
Worldcoin (WLD) Tests Pivot Point at $1.51 as Bullish Momentum Shows Mixed Signals
WLD price trades at $1.51 with 1.27% daily gains, showing strong bullish trend despite recent MACD bearish divergence and neutral RSI conditions.
WLD Price Faces Bearish Pressure Despite Strong Bullish Trend - Worldcoin Technical Analysis
Worldcoin (WLD) trades at $1.50 after a 3.59% daily decline, but maintains position above key moving averages with neutral RSI signaling potential consolidation ahead.
WLD Price Analysis: Worldcoin Shows Bullish Momentum Despite Market Uncertainty
Worldcoin (WLD) trades at $1.56 with strong technical indicators suggesting continued upward momentum despite recent 0.76% decline in volatile crypto markets.
Worldcoin (WLD) Surges 4.13% as Bullish Technical Signals Strengthen
WLD price climbs to $1.56 with strong momentum indicators showing continued bullish potential despite trading below key moving averages.
Worldcoin (WLD) Surges Above $1.50 Despite Minor Daily Decline - Bulls Eye $2.21 Resistance
WLD price holds steady at $1.50 with strong bullish momentum intact. Technical indicators suggest upside potential as Worldcoin tests key resistance levels.
WLD Price Surges Above $1.50 as Worldcoin Shows Very Strong Bullish Momentum
Worldcoin (WLD) trades at $1.51 with +1.82% daily gains, displaying very strong bullish signals across multiple timeframes with RSI at 60.61 in neutral territory.
Worldcoin (WLD) Price Retreats 5.4% Despite Strong Bullish Momentum and $250M Investment
WLD trades at $1.58 after a 5.44% daily decline, but technical indicators show strong bullish trend following recent $250M institutional investment.
Worldcoin (WLD) Holds Above $1.67 After 42% Surge - Bulls Target $1.40 Breakout
WLD price trades at $1.67 with 3.15% daily gains, maintaining bullish momentum after last week's 42% surge. Technical indicators suggest potential continuation toward $1.40 target.
Worldcoin (WLD) Tests Key Resistance After 42% Surge - Technical Analysis and Price Outlook
WLD price trades at $1.61 (-1.52% today) after massive 42% surge earned 'Coin of the Day' status. Technical indicators show bullish momentum with RSI at 66.13.
Worldcoin (WLD) Consolidates Near $1.63 After 42% Weekly Surge - Key Resistance at $1.84
WLD trades at $1.63 (-2.22% today) following massive 42% surge earlier this week. Technical indicators show bullish momentum with potential breakout above $1.84 resistance.
Worldcoin (WLD) Surges 25% as $250M Treasury Deal Signals Institutional Adoption
WLD trades at $1.87 (+3.72%) following Eightco Holdings' massive $250M investment announcement, pushing RSI into overbought territory at 80.41.
Worldcoin (WLD) Surges 47% to $1.89 Despite Token Unlock Concerns
WLD price exploded 47% to $1.89 with RSI hitting overbought at 83.94. Strong adoption metrics drive rally despite $230M September token unlocks threatening momentum.
WLD Price Surges 14.5% to $1.04 as Worldcoin Breaks Key Resistance
Worldcoin (WLD) rallies to $1.04 with strong bullish momentum as technical indicators signal potential continuation above $1.06 resistance level.
Worldcoin (WLD) Shows Mixed Signals at $0.91 as Technical Indicators Point to Potential Breakout
WLD price hovers at $0.91 with neutral RSI at 46.40, while MACD histogram turns bullish amid consolidation between key support and resistance levels.
WLD Price Analysis: Worldcoin Shows Weak Bullish Momentum at $0.89 Despite Mixed Signals
Worldcoin trades at $0.89 with +1.02% daily gains, but WLD technical analysis reveals bearish MACD divergence while RSI remains neutral at 44.79 in oversold territory.
Worldcoin (WLD) Tests Critical Support at $0.88 as Bears Take Control
WLD price drops to $0.88 (-0.11% in 24h) as technical indicators signal weakening momentum below key moving averages with RSI at 42.85 in neutral territory.
WLD Price Struggles Below $0.90 as Bearish Momentum Builds
Worldcoin trades at $0.89 (+1.60% daily) but faces resistance at $1.04 with weak bullish trend showing signs of potential reversal as momentum indicators turn bearish.
Worldcoin (WLD) Tests Critical Support at $0.83 as Bears Take Control
WLD price drops 2.27% to $0.86, approaching key support levels with RSI at 40.18 suggesting potential oversold bounce ahead for Worldcoin traders.
Worldcoin (WLD) Tests Critical Support at $0.86 as Bears Take Control
WLD price drops to $0.89 amid bearish momentum, with technical indicators pointing to potential breakdown below key $0.86 support level.
Worldcoin (WLD) Tests Critical Support at $0.90 as Bears Maintain Control
WLD price drops 1.85% to $0.90, testing key pivot levels with RSI at 43.22 signaling potential oversold conditions ahead.
Worldcoin (WLD) Price Falls to $0.90 as Technical Indicators Flash Mixed Signals
WLD price drops 2.27% to $0.90 amid bearish momentum, with Worldcoin's RSI at 43.45 suggesting potential oversold conditions ahead as support levels come into focus.
Worldcoin (WLD) Price Drops 2.2% as Bears Target $0.86 Support
WLD price trades at $0.93 after declining 2.21% in 24 hours. Technical indicators show neutral RSI at 44.96 while critical support awaits at $0.86.
WLD Price Dips to $0.94 as Worldcoin Tests Critical Support Levels
Worldcoin (WLD) trades at $0.94 after a 0.53% decline, with technical indicators showing mixed signals as the token approaches key support at $0.86.
WLD Price Falls 5.7% Despite $135M Token Sale - Technical Analysis Shows Mixed Signals
Worldcoin (WLD) trades at $0.95 after declining 5.7% in 24 hours, presenting conflicting signals as positive funding news battles bearish market sentiment.
Worldcoin (WLD) Price Consolidates at $1.01 as Technical Indicators Show Mixed Signals
WLD price trades at $1.01 with +2.44% daily gains amid neutral RSI and bearish MACD signals, testing key pivot point around dollar level.
Worldcoin (WLD) Price Drops 9.6% Despite $135M Funding Round
WLD trades at $1.01 after a 9.6% decline, facing mixed signals from $135M token sale and China's regulatory warning amid neutral technical indicators.
Worldcoin (WLD) Surges 20% After $135M Token Sale - Technical Analysis Points to $1.40 Target
WLD price climbs to $1.13 (+5.42% daily) following major funding round. Bullish momentum indicators and strong institutional backing suggest continued upside potential.
Worldcoin (WLD) Shows Bullish Momentum with 4.81% Daily Gains
WLD price rallies to $1.05 with strong volume as technical indicators suggest potential breakout above key resistance levels.
Worldcoin (WLD) Struggles Below $1 Despite Binance.US Listing as China Raises Data Concerns
WLD price drops 7.89% to $0.99 despite Binance.US listing as China's biometric data warnings overshadow exchange expansion news.
Worldcoin (WLD) Breaks Above Key Resistance as Bulls Target $1.40
WLD price surges 2.57% to $1.08, breaking above critical moving averages with bullish MACD momentum signaling potential rally toward $1.40 resistance.
Worldcoin (WLD) Holds Above $1 Despite Mixed Signals and Regulatory Headwinds
WLD price trades at $1.05 (-1.31%) as Binance.US listing boosts accessibility while China's biometric data warnings create regulatory uncertainty for traders.
Worldcoin (WLD) Breaks Above $1 with 6.65% Rally - Technical Analysis Points to Further Upside
WLD price surges to $1.07 with strong volume, breaking key resistance levels as Worldcoin technical analysis reveals bullish momentum building across multiple timeframes.
WLD Price Rebounds 4.55% After Binance.US Listing Despite China Warning
Worldcoin (WLD) trades at $1.01 with mixed signals as Binance.US listing boosts accessibility while China's biometric data concerns create regulatory headwinds.
WLD Price Surges 4.57% After Binance.US Listing - Worldcoin Technical Analysis
Worldcoin (WLD) trades at $0.96, up 4.57% following Binance.US listing. Mixed technical signals show neutral RSI at 42.62 but bearish MACD momentum.
** WLD Price Drops 4.35% as Worldcoin Tests Critical Support Near $0.91
** Worldcoin (WLD) trades at $0.92 after declining 4.35% in 24 hours, with technical indicators showing bearish momentum as the token approaches key support levels.
Worldcoin (WLD) Tests Lower Support at $0.98 Amid Weak Bullish Momentum
WLD price trades at $0.98 with 1.97% daily gains, but technical indicators show bearish momentum as Worldcoin approaches critical support levels.
Worldcoin (WLD) Faces Bearish Pressure as WLD Price Tests Lower Bollinger Band Support
WLD price trades at $0.96 (+0.52% daily) but technical indicators show bearish momentum with Worldcoin testing critical support levels near $0.91.
Worldcoin (WLD) Tests Critical Support at $0.93 as Bearish Momentum Builds
WLD price drops 1.74% to $0.96, approaching crucial support at $0.93. Technical indicators signal potential breakdown risk with RSI at 40.39 and bearish MACD momentum.
Worldcoin (WLD) Holds Above $1 as Mixed Signals Cloud Short-Term Outlook
WLD price trades at $1.08 with neutral momentum despite recent 25% weekly surge. Technical indicators show conflicting signals as regulatory concerns persist.
WLD Price Drops 6% as Technical Indicators Flash Mixed Signals
Worldcoin trades at $1.03 after a 5.91% decline, with WLD RSI at 45.34 suggesting potential oversold bounce while MACD shows bearish momentum continues.
Worldcoin (WLD) Price Retreats to $1.12 After 25% Weekly Rally Faces Profit-Taking
WLD price drops 9.18% to $1.12 after hitting $1.24 weekly high, as neutral RSI signals potential consolidation amid German regulatory concerns.
Worldcoin (WLD) Price Retreats to $1.12 Despite 25% Weekly Surge - Technical Analysis
WLD price pulls back 6.42% to $1.12 after hitting $1.24 weekly high, while RSI neutral signals potential consolidation ahead amid German regulatory concerns.
Worldcoin (WLD) Price Drops to $1.16 as Kenyan Court Orders Data Deletion
WLD price retreats to $1.16 (-0.09% daily) after Kenyan court ruling demands biometric data deletion, offsetting gains from Razer and Match Group partnerships.
Worldcoin (WLD) Rallies 5.64% as Partnerships Counter Regulatory Headwinds
WLD price surges to $1.16 following major partnerships with Razer and Match Group, though German regulatory scrutiny creates mixed sentiment for traders.
Worldcoin (WLD) Price Drops 6.7% as Bulls Face $1.21 Resistance Test
WLD trading at $1.10 after 6.7% daily decline despite recent 25% weekly surge driven by major partnerships with Razer and Match Group.
Worldcoin (WLD) Surges Despite Token Unlock Concerns - Technical Analysis Shows Bullish Momentum
WLD trades at $1.18 amid daily 2M token unlocks, showing resilience with bullish MACD signals and strong support at $0.85 despite regulatory headwinds.
Worldcoin (WLD) Breaks $1.24 After 25% Weekly Surge Despite German Regulatory Scrutiny
WLD price hits $1.24 with 2.74% daily gains as technical breakout overcomes German GDPR investigation concerns, RSI signals overbought conditions ahead
Worldcoin Price Surges 6.2% Despite German Regulatory Setback - WLD Eyes $1.28 Resistance
WLD price jumps to $1.23 (+6.2%) as bulls push against overbought RSI conditions, but German regulatory investigation creates headwinds for Worldcoin's biometric expansion.
Worldcoin (WLD) Price Analysis: Strategic Partnerships Drive Growth Despite Regulatory Headwinds in July 2025
Worldcoin gains 3.77% amid Razer and Match Group partnerships, but faces German regulatory scrutiny and planned token sales. Current price: $1.16 with bullish momentum.
Worldcoin (WLD) Price Analysis: Technical Breakout Meets Regulatory Headwinds in July 2025
Worldcoin breaks falling wedge pattern while facing German regulatory scrutiny. Current price $1.16 shows bullish momentum despite 24h decline. Key partnerships drive adoption.
Worldcoin (WLD) Surges 25% Amid Key Partnerships: Bullish Momentum vs. Regulatory Risks
Worldcoin (WLD) surged 25% this week, fueled by partnerships with Razer and Match Group. Despite a bullish trend, regulatory scrutiny in Europe tempers market optimism.
Worldcoin (WLD) Surges 25% Amid Key Partnerships and Regulatory Hurdles
Worldcoin (WLD) saw a 25% weekly price surge, reaching $1.12, fueled by major partnerships with Razer, Match Group, and Story Protocol. However, regulatory scrutiny in Europe tempers bullish momentum.
Worldcoin (WLD) Surges on Key Partnerships Despite Regulatory Challenges
Worldcoin (WLD) climbs 25% weekly, driven by major partnerships with Razer and Match Group, while halting iris scans in Germany sparks regulatory concerns.
Worldcoin (WLD) Surges Amid Partnerships and Regulatory Scrutiny: Market Outlook for July 2025
Worldcoin (WLD) saw significant price action this week, fueled by new partnerships and technical upgrades. However, regulatory challenges and privacy concerns remain key risks.
Worldcoin ($WLD) Price Surges Amid Key Partnerships and Regulatory Challenges
Worldcoin ($WLD) gains 16.7% following major partnerships with Razer, Tinder, and Story Protocol. Regulatory hurdles in Germany and Europe, however, cloud its bullish momentum.
World Liberty Financial (WLFI) Faces Potential Drop Below $0.1 Amid Investor Concerns
World Liberty Financial's WLFI token experiences a 30% decline in two weeks, sparking concerns of further drops below $0.1. Investors express dissatisfaction with the project's progress.
XLM Price Prediction: Stellar Eyes $0.31-$0.47 Recovery as Technical Indicators Signal Potential Breakout
XLM price prediction suggests targets of $0.31-$0.47 over the next 4-6 weeks as bullish MACD momentum and record on-chain activity support Stellar's recovery from key $0.25 support.
XLM Price Prediction: Targeting $0.31 by January 2026 as Technical Indicators Signal Recovery
Stellar (XLM) shows bullish MACD momentum with analysts forecasting $0.31 medium-term target. Current $0.25 support holds as technical setup improves for Q1 2026.
XLM Price Prediction: Stellar Targeting $0.31 Breakout by Year-End 2025
XLM price prediction shows potential 29% upside to $0.31 resistance level within 3 weeks, supported by bullish MACD momentum and oversold conditions from 52-week high decline.
XLM Price Prediction: Stellar Eyes $0.39 Target by January 2026 Despite Current Consolidation
XLM price prediction shows potential 62% upside to $0.39 within month as technical indicators signal bullish momentum despite trading 51% below 52-week highs.
XLM Price Prediction: Stellar Eyes $0.27-$0.31 Rally as Technical Momentum Builds
XLM price prediction targets $0.27-$0.31 range within 2-4 weeks as MACD shows bullish momentum despite recent 5.22% decline. Critical $0.25 level holds.
XLM Price Prediction: $0.27 Target Within Two Weeks as Stellar Tests Key Resistance
XLM price prediction shows potential rally to $0.27 resistance within 14 days, though bears defend $0.25 pivot with downside risk to $0.22 support zone.
XLM Price Prediction: Targeting $0.31-$0.34 Range as Technical Recovery Signals December Breakout
XLM price prediction shows bullish momentum building with MACD divergence supporting a move to $0.31-$0.34 range over the next 3-4 weeks as Stellar breaks key resistance.
XLM Price Prediction: Stellar Eyes $0.31 Recovery as Technical Indicators Signal Bullish Reversal by Year-End 2025
XLM price prediction shows potential 35% upside to $0.31 target by December 2025, supported by bullish MACD divergence and oversold RSI conditions near critical support.
XLM Price Prediction: Stellar Eyes $0.31 Recovery Target by Year-End 2025
XLM price prediction points to $0.31 target as Stellar shows bullish MACD divergence from oversold levels, with critical $0.22 support holding firm.
XLM Price Prediction: Targeting $0.31-$0.34 in December 2025 Amid Technical Recovery
Our XLM price prediction targets $0.31-$0.34 by December 2025, supported by bullish MACD divergence and oversold conditions near critical $0.26 support levels.
XLM Price Prediction: Stellar Targets $0.30-0.31 by December 2025 Despite Neutral Momentum
XLM price prediction shows potential for 20% upside to $0.30-0.31 range within 4 weeks, supported by bullish MACD divergence and analyst forecasts targeting similar levels.
XLM Price Prediction: Targeting $0.31-$0.34 by December 2025 as Stellar Shows Early Bullish Momentum
XLM price prediction indicates potential 24-40% upside to $0.31-$0.34 range within 2-4 weeks, supported by bullish MACD divergence and oversold conditions near key support.
XLM Price Prediction: Stellar Targets $0.32 Recovery Within 30 Days Despite Oversold Conditions
XLM price prediction shows potential 39% upside to $0.32 target as oversold RSI at 29.30 and analyst consensus support medium-term recovery despite current bearish momentum.
XLM Price Prediction: Stellar Targets $0.32 Recovery Within 30 Days from Oversold Conditions
XLM price prediction shows potential 39% upside to $0.32 resistance as oversold RSI at 28.48 suggests imminent bounce from $0.23 support level.
XLM Price Prediction: Targeting $0.35 by December 2025 as Stellar Tests Critical Support
XLM price prediction suggests a recovery to $0.35 within 4-6 weeks as Stellar bounces from oversold conditions at $0.24 support, with key resistance at $0.31.
XLM Price Prediction: Stellar Eyes $0.32 Recovery Target Within 30 Days Amid Technical Oversold Conditions
XLM price prediction suggests a potential 28% rally to $0.32 resistance as oversold RSI conditions and analyst forecasts converge on near-term recovery prospects for Stellar.
XLM Price Prediction: Stellar Eyes $0.31-$0.35 Recovery Within 4 Weeks Despite Current Weakness
XLM price prediction suggests recovery to $0.31-$0.35 range within four weeks, with short-term target of $0.28. Current technical setup shows oversold conditions.
XLM Price Prediction: Stellar Eyes $0.31-$0.35 Recovery Within 4 Weeks Despite Current Weakness
XLM price prediction suggests recovery to $0.31-$0.35 range over the next month, though bears must defend $0.25 support to avoid deeper decline to $0.22.
XLM Price Prediction: Stellar Eyes $0.40 Recovery by December Amid Technical Consolidation
XLM price prediction shows potential recovery to $0.35-$0.40 range within 4 weeks as technical indicators signal oversold bounce from current $0.27 support level.
XLM Price Prediction: Stellar Eyes $0.35 Recovery Before Year-End 2025
XLM technical analysis points to $0.35 target within 4 weeks, with potential breakout to $0.62 if resistance holds. Critical $0.22 support remains key.
XLM Price Prediction: Stellar Eyes $0.32 Recovery Despite Bearish Momentum - December Target $0.3357
XLM price prediction points to short-term recovery toward $0.32 resistance, with Stellar forecast suggesting potential 19% gain to $0.3357 by December 2025.
XLM Price Prediction: Stellar Eyes $0.34 Recovery After Testing $0.27 Support - November 2025 Forecast
XLM price prediction suggests a bounce to $0.34 resistance after finding support at $0.27. Technical analysis reveals neutral RSI and oversold conditions favoring short-term recovery.
XLM Tests 200-Day Moving Average as Bearish Momentum Builds Despite Overall Bullish Trend
Stellar (XLM) trades at $0.32, down 2.7% as bears pressure the 200-day MA while RSI signals potential oversold bounce opportunity in absence of major catalysts.
XLM Gains Ground Despite Bitcoin Decline as Stellar Protocol 23 Upgrade Drives Enterprise Interest
Stellar (XLM) shows resilience at $0.31 amid broader crypto weakness, buoyed by recent Protocol 23 upgrade introducing 5,000 TPS capacity and Archax's $460M tokenization partnership.
XLM Tests Key $0.30 Support as Bitcoin Crash Triggers $1B Liquidations Despite Stellar's Protocol 23 Upgrade
Stellar trades at $0.31 after Bitcoin's plunge below $105k sparked market-wide selling, overshadowing positive news from Protocol 23 upgrade and $460M Archax partnership.
XLM Tests Lower Bollinger Band at $0.31 as Broader Crypto Selloff Continues
Stellar (XLM) trades at $0.31 after a 1.45% decline, testing critical support near the lower Bollinger Band as technical indicators signal oversold conditions amid broader market weakness.
XLM Technical Setup Shows Neutral Momentum as Price Consolidates Near Key Moving Averages
Stellar trades at $0.37 with minimal 24-hour movement as XLM price action remains caught between short-term resistance and long-term support levels.
Breaking: Stellar Shows Mixed Signals as XLM Price Tests Critical $0.37 Resistance Level
XLM price climbs 2.99% to $0.37 amid conflicting technical signals. Key resistance at $0.41 could determine Stellar's next major move for October trading.
Stellar (XLM) Price Tests Lower Support at $0.36 Amid Bearish Momentum
XLM price drops 1.05% to $0.36, testing critical support levels with RSI at 41.58 signaling potential oversold conditions ahead.
XLM Price Tests Lower Support at $0.36 as Stellar Shows Mixed Technical Signals
XLM price drops 1.93% to $0.36, testing key support levels while technical indicators show neutral RSI and bearish momentum despite overall bullish trend.
XLM Price Analysis: Stellar Shows Mixed Signals as Technical Indicators Diverge
XLM price holds steady at $0.37 with neutral momentum, but technical analysis reveals conflicting signals as traders await direction from key support levels.
Stellar (XLM) Price Tests Support at $0.37 as Neutral Signals Dominate
XLM trades at $0.37 with mixed technical signals. Stellar's RSI at 43.60 shows neutral momentum while MACD indicates potential bearish pressure ahead.
XLM Price Drops 8% as Stellar Tests Critical Support at $0.34
Stellar (XLM) trades at $0.36 after an 8% decline, with RSI at 39 signaling oversold conditions while testing key support levels around $0.34.
XLM Price Faces Pressure at $0.39 Despite Stellar's New Corporate Partnerships
XLM trades at $0.39 with mixed signals as institutional selling pressure counters positive corporate partnership announcements from Stellar's Meridian conference.
Stellar (XLM) Holds $0.39 as Bulls Build Momentum Amid Neutral RSI
XLM price maintains $0.39 level with bullish MACD signals emerging. Technical analysis reveals key resistance at $0.41 as momentum indicators suggest potential upside.
XLM Price Analysis: Stellar Shows Mixed Signals at $0.39 as Bulls and Bears Battle
Stellar (XLM) trades at $0.39 with neutral RSI at 52.49, while MACD histogram suggests emerging bullish momentum despite 24-hour decline of 1.06%.
Stellar (XLM) Surges 3.18% as Bulls Target $0.47 Resistance Level
XLM price climbs to $0.40 with bullish momentum building as technical indicators signal potential breakout above key resistance levels in coming sessions.
Stellar (XLM) Tests $0.39 as Bulls Eye Breakout Above Key Resistance
XLM price holds steady at $0.39 with bullish momentum building as technical indicators suggest potential upside toward $0.41 resistance level.
Stellar (XLM) Price Breaks Above Key Moving Averages as Bullish Momentum Builds
XLM trades at $0.39 with +2.35% daily gains as technical indicators signal potential breakout above resistance levels with RSI in neutral territory.
XLM Price Analysis: Stellar Shows Mixed Signals at $0.38 Support Level
Stellar (XLM) trades at $0.38 after a 5% daily decline, with technical indicators showing bullish momentum despite neutral RSI readings and key support tests.
XLM Price Holds Above Key Support as Stellar Shows Mixed Technical Signals
Stellar (XLM) trades at $0.40 despite 3.86% daily decline, with technical indicators suggesting potential bullish momentum amid neutral RSI conditions.
Stellar (XLM) Surges 4.86% to $0.41 as Bullish Momentum Builds
Stellar's XLM price hits $0.41 with strong bullish signals emerging across multiple technical indicators, suggesting potential continuation higher.
Stellar (XLM) Breaks Through $0.39 as Government Adoption Fuels Bullish Momentum
XLM trades at $0.39 (+0.03% daily) with technical indicators showing bullish momentum following U.S. Department of Commerce blockchain adoption news.
Stellar XLM Eyes $0.43 Resistance After Protocol 23 Upgrade Sparks Bullish Momentum
XLM trades at $0.38 (+2.46%) following the successful Protocol 23 'Whisk' upgrade and U.S. government adoption, with technical indicators showing mixed signals ahead of key resistance.
** Stellar (XLM) Holds $0.38 Support Despite Post-Upgrade Volatility
** XLM trades at $0.38 (+1.87%) after Protocol 23 launch, showing neutral RSI at 49.92 as institutional interest grows following U.S. government adoption.
XLM Price Holds $0.36 Support as Stellar Protocol 23 Upgrade Shows Institutional Momentum
XLM trades at $0.36 with 2.04% daily gains, showing resilience despite recent volatility as Protocol 23 upgrade and U.S. government adoption signal bullish fundamentals.
Stellar (XLM) Hovers at $0.36 as Protocol 23 Upgrade Meets Mixed Technical Signals
XLM trades at $0.36 with neutral RSI and bearish MACD despite Protocol 23 smart contract upgrade driving institutional adoption surge of 39% in Q2 2025.
Stellar (XLM) Price Tests Support at $0.36 Despite Major Protocol Upgrade
XLM trades at $0.36 (-2.80% daily) as technical indicators show mixed signals despite Protocol 23 upgrade and record $152M TVL milestone.
Stellar (XLM) Holds $0.36 Despite Record TVL Growth and Government Adoption
XLM trades at $0.36 with oversold RSI signaling potential rally to $0.64. U.S. Department of Commerce adopts Stellar network as TVL hits $152M all-time high.
Stellar (XLM) Price Drops 1% as Technical Indicators Flash Mixed Signals
XLM trades at $0.36 with bearish momentum despite strong bullish trend. RSI neutral at 39.82 suggests potential buying opportunity for contrarian traders.
Stellar (XLM) Eyes September Recovery as Institutional Adoption Drives Momentum
XLM trades at $0.36 with modest 0.58% gains as September recovery trends and U.S. Commerce Department adoption signal potential bullish reversal ahead.
Stellar (XLM) Eyes September Recovery After Testing Lower Support at $0.36
XLM trades at $0.36 with oversold conditions and institutional adoption growth signaling potential September rebound toward $0.64 target.
XLM Price Analysis: Stellar Eyes $0.50 Recovery as September Bullish Trend Emerges
Stellar (XLM) trades at $0.35 amid oversold conditions. Technical indicators and historical September trends suggest potential rally to $0.50 despite recent bearish momentum.
Stellar (XLM) Tests Critical Support at $0.35 Amid Record DeFi Growth
XLM trades at $0.36 (-0.22%) as technical indicators flash mixed signals while Stellar's DeFi ecosystem hits record $152M TVL despite rising exchange reserves.
XLM Price Holds $0.36 Support as Stellar Gains Institutional Backing
XLM trades at $0.36 despite 1.9% daily decline as U.S. Department of Commerce adoption boosts long-term outlook while technical indicators show mixed signals.
XLM Price Drops 5.8% as Stellar Tests Critical Support at $0.36
Stellar (XLM) trades at $0.36 after a sharp decline, testing lower Bollinger Band support while XLM RSI signals potential oversold conditions ahead.
Stellar (XLM) Faces Bearish Pressure Despite Network Growth as Exchange Supply Hits Record High
XLM trades at $0.38 (-2.28%) amid conflicting signals: record TVL and accounts growth versus concerning exchange supply surge raising sell-off risks.
Stellar (XLM) Retreats 6.4% Despite Protocol 23 Upgrade and $445M Tokenization Milestone
XLM trades at $0.40 after a 6.4% daily decline, showing mixed signals as recent protocol upgrades clash with short-term bearish momentum in the crypto market.
Stellar (XLM) Holds $0.43 Despite Bullish Protocol Upgrade and Rising TVL
XLM trades at $0.43 with minimal volatility as Stellar's Protocol 23 upgrade and record $152M TVL fail to spark immediate price action despite strong fundamentals.
XLM Price Rallies 12% Despite Pullback as Stellar Protocol 23 Upgrade Approaches
Stellar (XLM) trades at $0.43 after a sharp pullback, but bullish fundamentals including the upcoming Protocol 23 upgrade and record TVL keep long-term outlook positive.
Stellar (XLM) Breaks Above $0.47 as Protocol 23 Upgrade and PayPal Integration Drive Bullish Momentum
XLM surges 4.33% to $0.47 amid Protocol 23 upgrade launch and PayPal stablecoin integration, with technical indicators showing strong bullish signals.
Stellar (XLM) Consolidates at $0.44 Despite Recent Surge - Technical Analysis Shows Mixed Signals
XLM trades at $0.44 after last week's impressive 15% rally, with technical indicators showing consolidation phase as traders assess next directional move.
Stellar (XLM) Soars 3.79% to $0.46 as Bullish Momentum Builds
Stellar trades at $0.46 with strong technical indicators showing bullish momentum. XLM RSI at 62.37 signals continued upside potential despite approaching resistance.
Stellar (XLM) Consolidates Near $0.44 Despite Recent Rally - Key Resistance Ahead
XLM trades at $0.44 after pulling back 3.42% from recent highs, but technical indicators suggest bullish momentum remains intact above key support levels.
Stellar (XLM) Price Holds $0.46 Despite Mixed Signals as Protocol 23 Vote Approaches
XLM trades at $0.46 with RSI at 62.40 showing neutral momentum. Recent regulatory clarity from Ripple's SEC settlement and Visa integration offset earlier decline concerns.
XLM Price Surges 15.59% as Stellar Shows Very Strong Bullish Momentum
Stellar (XLM) trades at $0.46 with 15.59% daily gains, technical indicators signal continued bullish momentum despite some bearish MACD divergence warning traders.
Stellar (XLM) Breaks Above $0.40 Following Visa Partnership Despite Recent Volatility
XLM trades at $0.40 with 2.6% daily gains as Visa partnership drives bullish momentum, though mixed technical signals suggest caution for traders.
Stellar (XLM) Battles Key Support at $0.39 Despite Visa Partnership Boost
XLM trades at $0.39 (-4.48% today) testing critical support levels as bulls defend against bearish momentum despite recent Visa collaboration news.
Stellar (XLM) Surges 9.57% as Bulls Eye $0.52 Resistance
XLM price climbs to $0.41 with strong bullish momentum intact, but MACD signals potential short-term pullback as traders watch key resistance levels.
Stellar (XLM) Price Consolidates at $0.38 Following July's Explosive 75% Rally
XLM trades at $0.38 with mixed signals as profit-taking follows July's surge ahead of Protocol 23 upgrade anticipation continuing to support underlying sentiment.
Stellar (XLM) Tests Critical Support at $0.38 Amid Mixed Technical Signals
XLM price drops 2.47% to $0.38, testing lower Bollinger Band support while maintaining bullish long-term trend despite bearish momentum indicators.
Stellar (XLM) Tests Support at $0.39 After Sharp 6.9% Daily Decline
XLM trades at $0.39 following a -6.90% drop as bulls defend key support levels after July's explosive 75% rally. Technical indicators show mixed signals.
Stellar (XLM) Consolidates at $0.43 as Bulls Defend Support After 75% July Rally
XLM trades at $0.43 (+1.79% daily) as technical indicators show mixed signals following July's explosive rally, with Protocol 23 upgrade providing support.
Stellar (XLM) Faces Consolidation at $0.41 After 75% July Rally
XLM trades at $0.41 (-2.76% daily) as profit-taking emerges following July's massive surge, while Protocol 23 upgrade anticipation provides fundamental support.
Stellar (XLM) Retreats to $0.42 After Impressive 75% July Rally Faces Technical Consolidation
XLM trading at $0.43 (-5.30% today) enters consolidation phase after explosive July gains. Technical indicators show mixed signals as bulls and bears battle.
Stellar XLM Faces Pullback to $0.42 Despite 75% July Rally - Critical Support Test Ahead
XLM trades at $0.42 (-5.07% daily) after explosive July gains, with technical indicators showing mixed signals as bulls defend key support levels.
Stellar (XLM) Bulls Fight Back After 75% July Rally Despite Weekly Correction
XLM trades at $0.44 (-0.27%) as technical indicators show mixed signals following a spectacular 75% surge in July 2025 ahead of Protocol 23 upgrade.
Stellar (XLM) Rallies to $0.44 as 100% July Surge Continues Despite Weekly Pullback
XLM trades at $0.44 (+4.27% daily) following explosive 75-120% July gains, with technical indicators showing bullish momentum despite recent consolidation.
Stellar (XLM) Price Retreats After 120% July Rally - Bulls Face Critical $0.42 Test
XLM trades at $0.42 after -2.85% daily decline, testing key support despite Protocol 23 upgrade momentum and major partnerships driving July's explosive growth.
Stellar (XLM) Price Analysis: Bulls Test Key Resistance at $0.43 Despite Bearish MACD Signal
XLM price holds at $0.43 with bullish trend intact, but MACD histogram shows bearish momentum building. Technical indicators suggest critical test ahead.
Stellar (XLM) Surges Past $0.47 as Protocol 23 Upgrade Fuels Bullish Momentum
XLM trades at $0.47 with overbought RSI at 74.96 as Protocol 23 upgrade and major partnerships drive continued bullish momentum despite technical warning signs.
Stellar (XLM) Surges to $0.48 as Protocol 23 Upgrade Fuels 100% Weekly Rally
XLM trades at $0.48 with bullish momentum from Protocol 23 upgrade and major partnerships, but RSI warns of overbought conditions ahead.
Stellar (XLM) Soars 30% to $0.46 Following PayPal Partnership and Protocol 23 Upgrade Anticipation
XLM surges to $0.46 with 30% weekly gains driven by PayPal's stablecoin launch on Stellar network and upcoming Protocol 23 upgrade, targeting $0.50 resistance.
Stellar (XLM) Hits $0.50 After 100% Rally: PayPal Integration and Core v23.0.0 Drive Massive Surge
Stellar Lumens surges 100% in seven days to $0.50, driven by PayPal USD integration and Stellar Core v23.0.0 upgrade. Technical indicators suggest continued bullish momentum.
Stellar (XLM) Surges Amid Protocol 23 Upgrade and Major Partnerships: What’s Next?
Stellar (XLM) has soared 20.8% in a week, fueled by the Protocol 23 upgrade, PayPal's PYUSD integration plans, and Franklin Templeton's $445M asset tokenization. Explore XLM's bullish potential.
Stellar (XLM) Surges Amid Bullish Momentum: Protocol 23, Record-High Open Interest, and PayPal Integration Buzz
Stellar (XLM) has soared 90% in July, fueled by Protocol 23 upgrades, record-high open interest, and PayPal integration rumors. Explore key developments, technicals, and trading strategies.
Stellar (XLM) Surges Amid PayPal Rumors and Protocol 23 Upgrade: Price Outlook and Risks
Stellar (XLM) saw a 109% surge fueled by PayPal rumors, Protocol 23 upgrades, and institutional interest. Despite bullish momentum, market corrections and whale activity pose risks.
Stellar (XLM) Soars Amid Protocol 23 Upgrade and Institutional Momentum
Stellar (XLM) surged 100% this week, driven by the Protocol 23 upgrade and institutional adoption. With bullish patterns and technical strength, XLM eyes higher resistance levels.
Stellar's Explosive Surge: XLM Hits $0.52 Amid Protocol 23 and Institutional Adoption
Stellar (XLM) has soared over 100% this week, reaching $0.52 driven by Protocol 23 upgrades, institutional adoption, and DeFi growth. Is this just the beginning?
Stellar (XLM) Soars: PayPal Partnership, DeFi Growth, and Protocol Upgrades Drive 72% Weekly Surge
Stellar Lumens (XLM) surged 72% this week, hitting $0.40 amid PayPal integration rumors, DeFi TVL growth, and Protocol 23 upgrades. Explore key drivers, technical insights, and future predictions.
Stellar (XLM) Surges 56%: Key Developments, Technical Analysis, and Price Outlook
Stellar (XLM) is dominating the crypto market with a 56% weekly surge fueled by PayPal integration rumors, tech upgrades, and whale activity. What’s next for XLM?
XRP Price Prediction: Targeting $2.25-$2.70 Recovery by January 2025 Despite Current Bearish Pressure
XRP price prediction suggests potential recovery to $2.25-$2.70 range within 4-6 weeks, though immediate downside risk to $1.97 support remains active in short-term.
XRP Price Prediction: $2.35 Target Within 4 Weeks Despite Near-Term Consolidation
XRP price prediction points to $2.35 target by January 2025, though immediate consolidation around $2.10 pivot expected before breakout above $2.29 resistance.
XRP Price Prediction: Target $2.29 Resistance Break Within 7 Days for Move to $2.70
XRP price prediction shows bullish momentum building at $2.06 current level. Ripple forecast targets $2.29 resistance break within one week for continuation to $2.70 upside target.
XRP Price Prediction: Targeting $2.31 Short-Term with $2.85 December Potential
XRP price prediction shows potential rally to $2.31 near-term, with analysts forecasting $2.85 by year-end if key $2.28 resistance breaks on bullish momentum signals.
XRP Price Prediction: $2.31 Target With Potential Rally to $2.85 by Year-End
XRP price prediction suggests a move to $2.31 in the near term, with analysts forecasting potential upside to $2.85 by December 2025 if key resistance breaks.
XRP Price Prediction: Targeting $2.35-$2.70 Recovery Within 30 Days Despite Current Consolidation
XRP price prediction suggests recovery to $2.35-$2.70 range within 30 days as bullish MACD signals emerge despite recent 4.35% decline to $2.10 support zone.
XRP Price Prediction: $2.70 Target by Year-End as Technical Setup Shows Bullish Momentum
XRP price prediction points to $2.70 target by December 31st as MACD histogram turns positive and Bollinger Band positioning suggests upside potential from current $2.17 level.
XRP Price Prediction: $2.83 Target by December 4th as Ripple Tests Critical Resistance
XRP price prediction shows bullish momentum building with $2.83 target by December 4th. Technical analysis suggests potential breakout above $2.34 resistance level.
XRP Price Prediction: Ripple Eyes $2.35 Recovery After Testing Critical $2.00 Support
XRP price prediction suggests recovery to $2.35 within 2-3 weeks as technical indicators show early bullish divergence near critical support levels.
XRP Price Prediction: Ripple Eyes $2.50-$2.70 Recovery Within 30 Days Despite Recent Pullback
XRP price prediction points to potential recovery to $2.50-$2.70 range in December 2025, with bullish MACD signals emerging despite current 7% decline from recent highs.
XRP Price Consolidates Near $2.18 as Technical Indicators Signal Neutral Momentum Amid Quiet Market
XRP trades at $2.18 with muted volatility as technical indicators show mixed signals and the broader crypto market lacks major catalysts driving directional moves.
XRP Price Prediction: Target $2.60-$2.70 by December with Potential Rally to $3.00
XRP price prediction shows bullish momentum building toward $2.60-$2.70 targets, with technical indicators suggesting a potential breakout to $3.00 if key resistance levels are cleared.
XRP Price Prediction: Targeting $2.67 Breakout Within 7 Days as Technical Setup Aligns
XRP price prediction points to $2.67 resistance test within one week, with bullish momentum building despite neutral RSI. Ripple forecast suggests $3.00 potential if key levels break.
XRP Price Recovers Above $2 After Testing November Lows as Broader Crypto Market Stabilizes
XRP trades at $2.20 following recovery from $1.83 monthly low, with technical indicators suggesting potential continuation as broader cryptocurrency market shows signs of stabilization after rec...
XRP Tests Key Support as Crypto Market Correction Deepens, Bitcoin Correlation Intensifies
XRP price trades at $2.17 amid broad crypto selloff, testing critical support levels as technical indicators flash mixed signals in absence of major catalysts.
XRP Price Prediction: Technical Analysis Points to $2.67 Target Despite Bearish Headwinds
XRP price prediction shows mixed signals with whale accumulation supporting $2.67 target while technical indicators suggest potential decline to $2.13 support level.
XRP Price Prediction: Targeting $2.44 Recovery Before December Rally to $3.80
XRP price prediction shows potential rebound to $2.44 short-term, with Ripple forecast indicating $3.80-$3.90 medium-term target by December end despite current bearish momentum.
Ripple CTO's Two-Tier Consensus Proposal Fails to Lift XRP as Tech Selloff Weighs on Crypto Markets
XRP trades at $1.95 despite Ripple's technical innovation announcements this week, as broader market volatility and Bitcoin weakness override positive fundamental developments for the digital as...
XRP Price Prediction: Targeting $2.39-$2.75 Recovery After RSI Oversold Bounce
XRP price prediction shows potential recovery to $2.39-$2.75 range as RSI hits oversold levels at 30.78, with critical $2.154 support determining next move.
XRP Tests Lower Bollinger Band Support at $2.15 as RLUSD Pilot Momentum Fades
Ripple trades at $2.15 near technical support levels as recent gains from the RLUSD stablecoin pilot launch show signs of consolidation in broader crypto market.
XRP Price Prediction: Targeting $2.70-$3.15 Recovery by Year-End Despite Current Bearish Momentum
XRP price prediction points to potential $2.70-$3.15 targets within 4-6 weeks, though current RSI at 38.42 and bearish MACD suggest near-term consolidation around $2.07-$2.19.
XRP Price Prediction: Targeting $1.85-$2.07 Support Before Potential Rally to $2.58
XRP price prediction shows bearish momentum targeting $1.85-$2.07 support zone within 1-2 weeks, with bullish reversal potential toward $2.58 resistance if support holds.
XRP Tests Lower Bollinger Band Support as Technical Indicators Signal Potential Reversal Zone
Ripple trades at $2.23 after touching its lower Bollinger Band, with RSI at 42 suggesting oversold conditions may be emerging as XRP seeks to establish a floor.
XRP Price Prediction: $2.70 Target Within 30 Days as Technical Oversold Conditions Emerge
XRP price prediction targets $2.70-$3.15 medium-term despite current bearish momentum, with RSI at 39.58 signaling oversold conditions and regulatory optimism building.
XRP Consolidates Near $2.25 as First U.S. ETF Launch Impact Fades Amid Broader Crypto Volatility
XRP price holds $2.25 support as institutional flows from the first U.S. spot XRP ETF launch stabilize, while traders assess Ripple's 2026 roadmap against weakening technical momentum.
XRP Price Prediction: Target $2.70-$3.15 by December 2025 Despite Current Consolidation
XRP price prediction shows potential upside to $2.70-$3.15 range within 4-6 weeks as technical indicators suggest oversold conditions amid regulatory optimism.
XRP Tests Critical $2.20 Support as Bearish Momentum Builds Amid Broader Crypto Weakness
XRP price slides to $2.23, down 1.17% as technical indicators signal potential breakdown below key support levels while Bitcoin correlation weighs on sentiment.
XRP Price Prediction: Targeting $2.80 Recovery Within 2 Weeks Despite Current Bearish Momentum
XRP price prediction suggests recovery to $2.80 in the next two weeks as oversold conditions and institutional backing counter current bearish signals at $2.26.
XRP Price Prediction: Targeting $2.67 by December 2025 Despite Recent Pullback
XRP price prediction shows potential for 15% upside to $2.67 within 4 weeks, with bullish MACD momentum offsetting recent 7.92% decline from current $2.31 levels.
XRP Rallies 4% to $2.50 as ETF Approval Progress Accelerates Amid Government Shutdown Resolution
XRP price surged to $2.50 following ETF filing progress and Trump's bill ending the 43-day government shutdown, with technical indicators showing bullish momentum despite trading below key movin...
XRP Price Prediction: Targeting $2.79 Short-Term with $3.10 Medium-Term Breakout Potential
XRP price prediction shows consolidation above key EMAs setting up for $2.79 short-term target, with medium-term Ripple forecast eyeing $3.10 breakout by December 2025.
XRP Breaks Above Short-Term Resistance as 10.6% Rally Tests Key Technical Levels
XRP price surges to $2.55 with 10.6% daily gains as technical momentum builds above the 20-day moving average, testing critical resistance at $2.70 amid strong trading volume.
XRP Rallies 2.9% Following Ripple's $40 Billion Valuation and Palisade Acquisition
XRP trades at $2.34 after gaining 2.9% in 24 hours as Ripple secures $500M funding round at $40B valuation and acquires crypto custody firm Palisade, boosting institutional confidence.
XRP Price Prediction: Targeting $2.75-$3.25 Recovery by December 2025
XRP price prediction shows potential recovery to $2.75-$3.25 range within 4-6 weeks as technical indicators suggest oversold bounce from current $2.29 levels.
XRP Price Prediction: Targeting $2.75 Recovery Within 30 Days Despite Technical Headwinds
XRP price prediction points to $2.75 target by month-end as oversold conditions signal potential reversal from current $2.30 level, though bearish momentum remains a concern.
XRP Price Prediction: Targeting $2.75 Recovery Within Two Weeks Despite Short-Term Consolidation
XRP price prediction shows potential recovery to $2.75 by month-end, with critical support at $2.40. Technical indicators suggest oversold conditions favor bullish reversal.
XRP Tests Lower Bollinger Band at $2.23 as Evernorth IPO Plans Counter Routine Escrow Release
XRP trades at $2.23 down 1.7% as routine billion-token escrow release meets bullish Evernorth IPO announcement, testing key technical support levels in volatile crypto market.
XRP Price Prediction: Targeting $2.75 Recovery by Mid-November Despite Current Bearish Momentum
XRP price prediction shows potential recovery to $2.75 within two weeks as technical indicators suggest oversold conditions, though immediate support at $2.07 remains critical.
XRP Price Prediction: $2.75 Target by November 5th as Ripple Eyes December Rally to $3.80
XRP price prediction points to $2.75 short-term target despite current bearish momentum, with Ripple forecast suggesting potential December surge to $3.80-$3.90 range.
XRP Tests Support at $2.46 as Technical Consolidation Continues Below Key Moving Averages
XRP price trades at $2.46 down 1.9% as Ripple technical analysis shows consolidation below the 50-day MA amid neutral RSI and modest bullish MACD divergence in quiet market conditions.
XRP Price Prediction: Targeting $3.50-$4.00 by December 2025 as Technical Breakout Looms
XRP price prediction points to $3.50-$4.00 targets within 30 days as bullish momentum builds. Current technical setup suggests breakout above $2.70 resistance could trigger rally.
Evernorth's $1B XRP Accumulation Plan Drives Price Despite Upcoming 1B Token Unlock
XRP trades at $2.50 as Ripple-backed Evernorth reveals plans to raise over $1 billion for XRP accumulation, offsetting concerns over November 1st escrow unlock of 1 billion tokens.
XRP Price Prediction: $3.20 Target Within 30 Days as Technical Momentum Builds
XRP price prediction suggests a rally to $3.20 in the next month, supported by bullish MACD divergence and analyst targets ranging from $2.49 to $5.00.
XRP Bulls Fight Back Above $2.50 as 960 Million Tokens Exit Exchanges Amid Triangle Breakout Setup
XRP trades at $2.51 with 3.1% gains as massive exchange outflows signal accumulation while technical patterns point to potential $3.13 resistance test ahead.
XRP Price Prediction: Targeting $3.20 Breakout Within 4 Weeks as Bullish Momentum Builds
XRP price prediction shows potential 26% upside to $3.20 resistance level within 4 weeks, with technical indicators suggesting bullish momentum despite neutral RSI positioning.
XRP Price Prediction: Targeting $3.00-$3.20 by November 2025 as Technical Breakout Signals Rally
XRP price prediction shows bullish momentum building toward $3.00-$3.20 targets within 3-4 weeks, with key resistance at $2.88 acting as immediate catalyst level.
XRP Price Prediction: Targeting $3.25 in November 2025 with Potential Rally to $8.84
XRP price prediction suggests a bullish move toward $3.25 within the next month, supported by technical momentum and analyst consensus targeting higher levels through 2025.
XRP Price Prediction: Targeting $3.00 by November 2025 Despite Near-Term Consolidation
XRP price prediction suggests consolidation around $2.40 before potential breakout to $3.00 target within 4 weeks, driven by reduced exchange supply and institutional adoption.
XRP Tests Key Support at $2.42 as Bearish MACD Signals Weigh on Price Action
Ripple's XRP trades at $2.42 with bearish technical momentum building as the token consolidates below key moving averages amid quiet fundamental backdrop.
XRP Stabilizes Around $2.43 After Recovering from Week's Dramatic 42% Flash Crash
XRP price holds steady at $2.43 following last week's volatile trading that saw the cryptocurrency crash 42% before recovering, as traders assess technical damage from major liquidations.
XRP Recovers Above $2.40 as Ripple Security Initiative Counters Market Volatility
XRP trades at $2.46 with 4.7% daily gains as Ripple's $200K security bounty program and African expansion offset broader crypto market concerns following last week's selloff.
XRP Recovers to $2.36 as Ripple Secures Strategic African Banking Partnership Despite Recent Selloff
XRP trades at $2.36 with 1.5% daily gains as Ripple's partnership with Absa Bank provides fundamental support following this week's 15% crypto market decline.
XRP Tests Critical $2.30 Support as Technical Indicators Signal Potential Reversal Zone
Ripple trades at $2.31 following a 1.9% decline as XRP price approaches key technical support levels amid broader crypto market weakness and oversold RSI conditions.
XRP Tests Critical $2.40 Support Level Amid Leadership Transition Uncertainty and Bitcoin Selloff
XRP trades at $2.43 following 3.5% decline as Ripple CTO transition announcement weighs on sentiment despite strong institutional ETF inflows totaling $210 million in September.
XRP Tests Critical Support at $2.81 as Technical Indicators Signal Potential Bearish Continuation
XRP trades at $2.81 with bearish momentum as the token sits below key moving averages while testing critical support levels that could determine near-term direction.
XRP Tests Key Support at $2.85 Amid Bearish Technical Signals
XRP trades at $2.85 with mild selling pressure as the cryptocurrency faces resistance near short-term moving averages while maintaining strength above its 200-day SMA.
Ripple Faces Technical Pressure as XRP Tests Key Support Near $2.70 Amid Market Weakness
XRP trades at $2.87 following a 3.97% decline, testing critical support levels while maintaining strength above its 200-day moving average at $2.58
XRP Tests Key Resistance at $3.02 as Technical Indicators Signal Continuation
XRP trades at $3.02 with modest 0.24% daily gains as bulls test critical resistance levels while maintaining position above key moving averages in consolidation phase.
Ripple Holds Above Key Moving Averages as XRP Tests 3.00 Support
XRP trades at $3.01 with modest 0.23% decline as technical indicators suggest consolidation phase above critical moving average support levels. CONTENT: Market Overview XRP is trading at $3.01, do...
XRP Consolidates Above Key Moving Averages as Momentum Builds Toward $3.14 Resistance
XRP trades at $3.02, up 1.94% in 24 hours, with technical indicators showing bullish momentum as the token maintains position above all major moving averages.
XRP Consolidates Below Key Moving Averages as Bears Test $2.70 Support
XRP trades at $2.84 after declining 1.71% in 24 hours, with technical indicators showing bearish momentum as price remains below both 20-day and 50-day moving averages.
XRP Technical Analysis Shows Neutral Setup as Price Consolidates Near Key Moving Averages
XRP trades at $2.90 with modest 1.34% daily gains as technical indicators signal consolidation phase near critical $2.95 resistance zone with bearish MACD divergence.
Ripple Analysis: XRP Price Tests Critical Support as ETF Launch Fails to Ignite Rally
XRP trades at $2.87 with 3% gains despite recent ETF launch disappointment. Technical indicators suggest potential bounce from $2.70 support level.
XRP Price Hovers Near $2.78 as Technical Indicators Signal Mixed Outlook
XRP trades at $2.78 with bearish momentum indicators, though price remains above 200-day moving average suggesting underlying bullish structure intact.
XRP Price Drops 3.6% to $2.75 as Bears Test Critical Support Levels
XRP trades at $2.75 after a 3.6% decline, with technical indicators showing oversold conditions near key Bollinger Band support at $2.75.
XRP Price Consolidates Around $2.85 as Technical Indicators Signal Mixed Momentum
XRP trades at $2.85 with bearish MACD signals and RSI at 43, while maintaining position above 200-day moving average support at $2.54.
XRP Price Holds $2.88 as Technical Indicators Signal Mixed Momentum
Ripple (XRP) trades at $2.88 with neutral RSI at 44.24, showing consolidation near key support levels as traders await directional clarity.
XRP Breaks Below $2.90 Support as $13.8M Outflows Signal Bearish Momentum
XRP trades at $2.85 (-1.92%) after breaking key support, with technical indicators and $13.8M outflows suggesting further downside ahead for Ripple.
XRP Price Holds Strong Above $3 as Technical Indicators Signal Continued Bullish Momentum
XRP trades at $3.01 with neutral RSI and bullish MACD signals, while Ripple maintains position above key support levels despite minimal recent news catalysts.
XRP Price Holds Above $3.00 Despite Minor Dip as Technical Indicators Show Mixed Signals
XRP trades at $3.00 with -1.09% daily decline. Ripple technical analysis reveals neutral RSI and bullish MACD momentum amid consolidation phase.
XRP Price Tests $3.03 as Ripple President Joins Senate Banking Committee
XRP trades at $3.03 (-1.08%) while regulatory developments and $25M RLUSD donation boost long-term sentiment despite short-term weakness.
Ripple (XRP) Surges 3.95% as Bulls Target $3.38 Resistance
XRP price climbs to $3.13 with strong bullish momentum as technical indicators signal potential breakout above key resistance levels in the coming sessions.
XRP Price Breaks Above $3 as Ripple BBVA Partnership Drives Institutional Momentum
XRP trades at $3.02 following a major banking partnership with BBVA under EU MiCA regulations, signaling growing institutional adoption despite minor 24h pullback.
XRP Price Holds Above $3 as Ripple Investment News Boosts Sentiment
XRP trades at $3.02 with bullish momentum intact. Recent $25M Ripple investment and European regulatory clarity drive institutional interest despite neutral RSI.
XRP Price Drops 3.5% Despite BBVA Partnership as Resistance at $3.19 Holds
XRP trades at $2.97 after a 3.54% decline, but bullish MACD and MiCA-compliant BBVA partnership signal potential recovery toward analyst targets of $3.20-$5.00.
XRP Price Tests $3.09 Resistance as Ripple Technical Analysis Shows Mixed Signals
XRP trades at $3.09 after 2.29% decline, with technical indicators suggesting potential consolidation near key resistance levels ahead.
XRP Price Surges Above $3.10 as Bullish Technical Signals Strengthen
XRP price climbs 2.19% to $3.13 as technical indicators flash strong bullish signals, with RSI at 60.97 and MACD showing positive momentum crossover.
XRP Price Soars to $3.04 as Bullish Momentum Builds on Strong Technical Signals
Ripple (XRP) trades at $3.04 with 0.92% daily gains, showing bullish momentum as technical indicators align for potential breakout above $3.13 resistance level.
XRP Price Surges Above $3 as Bullish Momentum Builds - Technical Analysis Points to $3.55 Target
Ripple (XRP) trades at $3.02, up 0.24% in 24h, with technical indicators suggesting continued upside momentum toward resistance at $3.55.
Ripple (XRP) Breaks $3.00 as Africa Stablecoin Launch Sparks Recovery
XRP surged 2.52% to $3.00 following Ripple's RLUSD stablecoin launch in Africa, with technical indicators showing bullish momentum despite neutral RSI signals.
XRP Price Surges 2.2% to $2.88 as Whale Accumulation Signals Potential Breakout
XRP trades at $2.88 with bullish momentum emerging despite recent institutional liquidations. Technical indicators and whale activity suggest upside potential.
XRP Price Holds Above $2.80 Support Despite Bearish September Start
XRP trades at $2.83 (+0.76%) as bears test key support levels. Ripple technical analysis reveals mixed signals with oversold conditions hinting at potential recovery.
XRP Price Drops to $2.80 as Institutional Liquidations Offset Whale Accumulation
XRP trades at $2.80 after a 4% weekly decline driven by $1.9B institutional liquidations, while whale accumulation of 340M tokens suggests potential recovery ahead.
XRP Price Drops to $2.81 as Bearish Momentum Builds Despite Whale Accumulation
XRP trades at $2.81 (-0.39% today) with technical indicators showing bearish momentum despite 340 million XRP accumulated by whales over two weeks.
XRP Price Tests Critical $2.80 Support as September Volatility Shakes Market
XRP trades at $2.83 amid bearish September pressure, testing key support levels while oversold signals hint at potential recovery ahead for Ripple.
XRP Price Recovery Stalls at $2.85 as Ripple Faces Technical Resistance
XRP trades at $2.85 (+1.36%) but struggles against descending resistance. Smart contract integration news clashes with institutional selling pressure.
** XRP Price Faces Critical $2.80 Support Test Amid Mixed Signals and Whale Accumulation
** XRP trades at $2.81 (+0.60% in 24h) as whales accumulate 340M tokens despite institutional liquidations. Technical indicators show bearish momentum approaching key support.
XRP Price Drops to $2.73 as Ripple Tests Critical Support Amid Market Correction
XRP trades at $2.73 (-3.63% in 24h) as broader crypto selloff pushes Ripple near key $2.70 support level, while technical indicators signal oversold conditions.
XRP Price Faces Critical Support Test at $2.84 as Market Correction Continues
XRP trades at $2.84 after dropping below $3, showing bearish momentum despite positive Ripple partnerships. Key support at $2.76 becomes crucial for bulls.
XRP Price Faces Bearish Pressure at $2.80 as SEC Appeal Withdrawal Provides Relief
XRP trades at $2.80 (-2.66% in 24h) despite positive SEC news. Technical indicators show mixed signals with RSI at 41.53 and price testing lower Bollinger Band support.
XRP Price Falls 4% as Ripple Tests Critical Support at $2.88
XRP trades at $2.88 after a 4.12% decline, testing lower Bollinger Band support despite recent partnerships with SBI Holdings and TRM Labs driving adoption.
XRP Price Retreats to $2.97 After Testing $3.10 Resistance Following Fed Chair Powell's Dovish Stance
XRP trades at $2.97 after a 9% surge tested key resistance near $3.10, as technical indicators show mixed signals despite positive Ripple partnerships.
XRP Price Drops 5% Despite Legal Settlement Progress - Ripple Technical Analysis Shows Mixed Signals
XRP trades at $2.96 after 5.12% decline, testing key support despite positive SEC settlement news. Technical indicators show conflicting signals for traders.
XRP Price Holds $3.12 as Ripple-SEC Settlement Aftermath Creates Trading Opportunities
XRP maintains $3.12 support following massive 11% surge from Ripple-SEC resolution. Technical indicators show neutral momentum with key resistance at $3.38.
XRP Price Holds $3.12 as Ripple-SEC Victory Drives Institutional Interest Despite Token Release Concerns
XRP trades at $3.12 (+0.51%) as regulatory clarity from Ripple-SEC settlement spurs institutional buying, though recent 1 billion token release adds volatility concerns.
XRP Price Drops 6% Despite Breaking Key Resistance - Technical Analysis Points to $3.38 Retest
XRP trades at $3.09 after a 6% decline, but Ripple technical analysis shows bullish momentum remains intact following the SEC settlement breakthrough.
XRP Price Surges to $3.26 Following SEC Lawsuit Resolution - Technical Analysis Shows Bullish Momentum
XRP trades at $3.26 after breaking through key resistance levels, with recent SEC lawsuit conclusion driving 3.5% daily gains despite minor profit-taking pressure.
XRP Price Drops 4% as Bears Test $3.15 Support Despite SEC Victory
XRP trades at $3.15 (-4.03% daily) as technical indicators show mixed signals following major regulatory breakthrough and Rail acquisition announcement.
XRP Price Soars to $3.27 Following SEC Settlement Victory
XRP trades at $3.27 (+0.80%) after 11% surge following SEC lawsuit resolution. Technical indicators show bullish momentum with Ripple RSI at 58.61 and price holding above key support levels.
XRP Price Holds Strong at $3.25 Despite Minor Pullback Following SEC Settlement Victory
XRP trades at $3.25 with bullish momentum intact after SEC lawsuit conclusion, though technical indicators show mixed signals as traders assess next moves.
XRP Soars Above $3 Following SEC Settlement Despite Daily Pullback
XRP trades at $3.30 after SEC lawsuit settlement, showing resilience above key $3 level while technical indicators suggest potential for $8 target amid bullish momentum.
XRP Price Surges 13% to $3.36 as Ripple Secures Major Acquisition Deal
XRP rallies 13.22% to $3.36 following Ripple's $200M acquisition of Rail stablecoin platform, with technical indicators showing bullish momentum above key resistance.
XRP Price Analysis: Ripple Shows Bullish Momentum Above $2.99 Despite Mixed Signals
XRP trades at $2.99 with 1.91% daily gains. Technical indicators reveal neutral RSI and strong bullish trend, though MACD shows bearish momentum divergence.
XRP Price Recovers 4.93% Despite Week of Heavy Institutional Selling
XRP trades at $2.97 with 4.93% daily gains, recovering from institutional selling pressure that drove nearly 9% decline earlier this week.
XRP Price Analysis - Ripple Faces Pressure at $3.12 Despite Regulatory Progress
XRP trades at $3.12 with -2% daily decline as Ripple CEO's Senate testimony creates regulatory optimism amid broader market volatility
XRP Price Faces Resistance at $3.14 as SEC Meeting Sparks ETF Speculation
XRP trades at $3.14 (-3.47% today) while maintaining bullish trend above key support. Upcoming SEC meeting fuels XRP ETF speculation despite recent Upbit sell-off volatility.
XRP Price Analysis - Ripple Tests $3.14 Support Amid Bullish Long-Term Momentum
XRP price hovers at $3.14 (-2.06%) as Ripple technical analysis reveals neutral RSI at 58.46 with key resistance at $3.66 and strong support holding at $2.30.
XRP Price Surges to $3.20 After Whale Sell-Off Recovery - Technical Analysis Shows Mixed Signals
XRP trades at $3.20 with 1.31% daily gains following recovery from whale-induced crash to $2.96. Ripple technical analysis reveals neutral RSI at 62.71 amid conflicting momentum signals.
XRP Price Shows Resilience at $3.13 Despite $140M Insider Selling and Market Volatility
XRP trades at $3.13 with bullish technicals intact as Ripple co-founder's massive sell-off creates buying opportunity amid strong fundamentals.
XRP Price Rebounds from $2.96 Low Despite 10% Drop as Ripple Fights Volatility
XRP trades at $3.11 after recovering from yesterday's $2.96 low following a 10% correction. Technical indicators show mixed signals as Ripple approaches key resistance.
XRP Price Retreats to $3.14 After Touching New All-Time High Above $3.45
XRP trades at $3.14 (-4.31%) following a pullback from its historic $3.45 peak, as technical indicators suggest potential consolidation despite bullish momentum.
XRP Surges to Near 52-Week Highs as Technical Indicators Flash Overbought Signals
XRP price hits $3.44 with 0.65% gains as Ripple technical analysis reveals RSI at 82.94, signaling potential correction ahead despite strong bullish momentum.
XRP Hits New All-Time High at $3.45 as GENIUS Act and Whale Activity Drive Historic Rally
XRP reaches unprecedented $3.45 peak amid regulatory progress and massive whale accumulation, but technical indicators suggest potential correction ahead.
Ripple (XRP) Hits All-Time High: What's Driving the Price Surge?
XRP reaches a record-breaking $3.45, fueled by ETF launches, regulatory advancements, and bullish momentum. Learn the key factors shaping Ripple's rise.
Ripple (XRP) Surges Amid Regulatory Wins and Institutional Partnerships: Price Outlook and Analysis
Ripple's (XRP) bullish momentum continues with the SEC's approval of the ProShares Ultra XRP ETF and a key partnership with BNY Mellon. Explore technical insights and trading strategies.
Ripple (XRP) Surges Amid ETF Momentum, Regulatory Developments, and Institutional Adoption
XRP has reclaimed the #3 spot by market cap, fueled by ETF news, regulatory clarity, and institutional interest. Key bullish signals and price predictions ahead.
Ripple (XRP) Soars on ETF Launch, Regulatory Milestones, and Strategic Partnerships
Ripple (XRP) surges to $2.93 amid ProShares' XRP ETF launch, U.S. banking license plans, and a BNY Mellon partnership. Explore technical analysis, trading signals, and risks.
Ripple (XRP) Surges to $2.79 Amid ETF Momentum and BNY Mellon Partnership
Ripple (XRP) is riding a bullish wave, fueled by major partnerships, regulatory milestones, and imminent ETF launches. Here's a deep dive into XRP's market outlook.
Ripple (XRP) Surges Amid BNY Mellon Partnership & Regulatory Gains: July 2025 Market Analysis
Ripple’s partnership with BNY Mellon and its banking license application have propelled XRP’s price to $2.79. Learn about recent developments, technical trends, and price forecasts.
Ripple (XRP) Surges to $2.59: Technical Analysis, Trading Insights, and Price Predictions
Ripple's XRP climbs 5.73% in 24 hours to $2.59 amid bullish momentum. Discover expert insights, technical analysis, and actionable trading strategies for July 2025.
XRP's Potential Rebound as Retail Capitulation Intensifies
XRP's price faces pressure from retail fear and whale sell-offs, but historical patterns suggest a potential rebound as market conditions evolve.
XRP (XRP) Faces Potential Downturn as Death Cross Pattern Re-emerges
XRP is on the brink of forming a 'death cross' pattern, reminiscent of its 65% crash in 2021. Experts warn of potential risks including falling burn rate and insider selling.
XRP Price Stable As Grayscale Plans to Dissolve XRP Trust Closing Investment Avenue for Institutions, But Why?
Despite the news that Grayscale’s XRP Trust is going to be dissolved and XRP may lose a significant amount of institutional investors, the XRP price has stabilized—But why?
Tezos Price Tests Lower Bollinger Band Support at $0.58 Amid Broader Crypto Selloff
XTZ trades at $0.58 with RSI at 36.88 as Tezos technical analysis shows price testing key support levels following three consecutive days of market-wide crypto declines.
Tezos (XTZ) Tests Lower Bollinger Band Support at $0.58 Amid Crypto Market Weakness
XTZ price slides 2.9% to $0.58, approaching critical Bollinger Band support as technical indicators flash bearish signals following recent market volatility.
** XTZ Technical Breakdown: Critical Support Test Reveals Trading Opportunity
** XTZ price at $0.66 shows signs of oversold recovery after recent 6.1% decline. Key support levels and RSI positioning suggest potential reversal setup for strategic traders.
XTZ Price Breaks Above SMA 200 as Tezos Shows Bullish Momentum Despite Mixed Signals
Tezos (XTZ) trades at $0.71 with +2.12% daily gains, breaking above key SMA 200 support while technical indicators show conflicting signals for traders.
Tezos (XTZ) Hovers Near Support at $0.70 as Technical Indicators Flash Mixed Signals
XTZ price trades at $0.70 with minimal 24h movement, while RSI sits at 39 suggesting potential oversold conditions ahead for Tezos traders.
Tezos (XTZ) Battles Key Support at $0.75 as Bullish Momentum Builds
XTZ price holds at $0.75 amid neutral market conditions, with technical indicators suggesting potential upside as bullish MACD momentum emerges.
Tezos (XTZ) Technical Analysis Shows Mixed Signals as Price Tests $0.75 Support
XTZ price trades at $0.75 with bearish momentum while technical indicators suggest potential reversal ahead. Key support and resistance levels to watch.
Tezos (XTZ) Shows Mixed Signals at $0.78 as Bulls Fight for Control
XTZ price trades at $0.78 with bullish MACD divergence despite 0.49% daily decline. Technical indicators suggest consolidation phase ahead.
Tezos (XTZ) Surges 4.33% as Technical Indicators Flash Strong Bullish Signals
XTZ price jumps to $0.79 with bullish MACD momentum and RSI holding neutral territory, suggesting continued upside potential for Tezos.
Tezos (XTZ) Price Holds $0.77 as Bullish Momentum Builds Despite Market Headwinds
XTZ price trades at $0.77 with technical indicators showing emerging bullish signals as Tezos maintains key support levels amid broader market uncertainty.
XTZ Price Eyes $0.81 Resistance as Tezos Shows Bullish MACD Momentum
Tezos trades at $0.77 with bullish MACD signals emerging. XTZ technical analysis reveals key resistance at $0.81 while RSI holds neutral territory.
XTZ Price Faces Pressure at $0.75 as Tezos Consolidates Near Key Support
Tezos trades at $0.75 (-1.71% in 24h) with XTZ RSI at 48.54 showing neutral momentum while key support levels emerge at $0.69 for potential buying opportunities.
Tezos (XTZ) Shows Mixed Signals as Price Hovers Near $0.76 Support
XTZ price trades at $0.76 after a 3.61% daily decline, while technical indicators suggest bullish momentum may be building despite recent weakness.
Tezos (XTZ) Surges 3.4% to $0.79 as Technical Indicators Flash Bullish Signals
XTZ price climbs to $0.79 with strong momentum indicators pointing toward continued upside potential as Tezos approaches key resistance levels.
Tezos (XTZ) Surges 3.9% as Bulls Target $0.87 Resistance Level
XTZ price climbs to $0.76 with bullish momentum emerging on technical indicators. Key resistance at $0.87 could determine next major move for Tezos traders.
Tezos (XTZ) Tests $0.73 as Seoul Protocol Upgrade Drives Mixed Technical Signals
XTZ price holds steady at $0.73 with 2.13% daily gains as Seoul protocol upgrade begins on testnets, while technical indicators show neutral momentum amid key resistance ahead.
Tezos (XTZ) Price Consolidates at $0.72 as Seoul Upgrade Launches on Testnet
XTZ price holds steady at $0.72 despite minor 0.85% decline, while technical indicators show mixed signals and new Seoul protocol upgrade progresses on testnet.
Tezos (XTZ) Holds Ground at $0.72 Despite Exchange Staking Yield Cuts
XTZ price trades at $0.72 with modest 0.97% gains as technical indicators show mixed signals following Bitvavo's staking yield reduction to 1.4% APY.
Tezos (XTZ) Consolidates Near $0.71 as Staking Yield Cuts Signal Market Shift
XTZ price hovers at $0.71 amid reduced staking yields on Bitvavo platform. Technical indicators show mixed signals with bearish momentum developing.
XTZ Price Struggles at $0.71 as Bearish Momentum Builds Despite Overall Bullish Trend
Tezos trades at $0.71 with XTZ RSI at 39.36 showing neutral territory while MACD signals bearish momentum. Recent staking reward cuts add pressure.
Tezos (XTZ) Struggles Below Key Resistance as Technical Indicators Signal Mixed Outlook
XTZ price holds at $0.72 despite neutral RSI and bearish MACD signals. Key resistance at $0.88 remains critical for Tezos bulls seeking momentum.
Tezos (XTZ) Tests Lower Support as Bears Take Control Below $0.72
XTZ price drops 3.60% to $0.71 as technical indicators flash bearish signals. Key support at $0.69 holds but momentum remains weak across timeframes.
Tezos (XTZ) Price Analysis: Testing Lower Bollinger Band at $0.73 Support
XTZ trades at $0.73 with bearish momentum signals emerging as the token approaches critical support levels near the lower Bollinger Band.
XTZ Price Analysis: Tezos Shows Mixed Signals as RSI Hits Neutral Territory at $0.72
XTZ price trades at $0.72 with 0.96% daily gains, but bearish momentum and position near Bollinger Band support suggest caution for traders ahead.
XTZ Price Falls Below Key Moving Averages as Bearish Momentum Builds
Tezos (XTZ) trades at $0.72 after a 0.65% decline, with technical indicators signaling potential downside as the token tests lower Bollinger Band support levels.
XTZ Price Drops 2.17% to $0.73 as Tezos Tests Critical Support Levels
Tezos (XTZ) trades at $0.73 after declining 2.17% in 24 hours, approaching key support at $0.72 with bearish momentum signals emerging across multiple indicators.
Tezos XTZ Price Analysis: Testing Lower Bollinger Band Support at $0.74
XTZ trades at $0.74 with mixed signals as Etherlink TVL hits $47.7M record while technical indicators show bearish momentum despite bullish overall trend.
Tezos (XTZ) Tumbles 8.36% as Bears Target $0.72 Support Level
XTZ price drops to $0.73 amid bearish momentum, with technical indicators suggesting further downside risk as Tezos approaches critical support levels.
Tezos (XTZ) Surges 4.29% as Bulls Target $1 Resistance Level
XTZ price climbs to $0.88 with strong bullish momentum as technical indicators signal potential breakout above key resistance levels in the near term.
XTZ Price Drops 5% Despite Strong Bullish Trend - Tezos Technical Analysis Shows Mixed Signals
Tezos (XTZ) trades at $0.85 after a 4.99% decline, but technical indicators suggest the broader bullish trend remains intact despite short-term weakness.
Tezos (XTZ) Holds Above Key Support Despite 2.3% Daily Decline - Technical Analysis
XTZ price currently at $0.85, down 2.33% in 24h but maintaining bullish trend above critical support levels. RSI neutral at 55.57 signals potential consolidation phase.
Tezos (XTZ) Breaks Above Key Resistance as Bulls Target $1.03 Level
XTZ price surges to $0.87 with strong bullish momentum as technical indicators signal potential breakout toward next resistance zone at $1.03.
XTZ Price Drops 7% to $0.86 as Tezos Tests Critical Support Levels
Tezos (XTZ) trades at $0.86 after a sharp 7% decline, testing key support at $0.72 while technical indicators show mixed signals amid overall bullish trend.
Tezos (XTZ) Surges 8.89% as Bulls Target $1.10 Resistance Level
XTZ price rallies to $0.88 with strong bullish momentum as technical indicators signal potential breakout above key resistance zones.
Tezos (XTZ) Faces Mixed Signals as Price Hovers at $0.76 Support Level
XTZ price trades at $0.76 with bullish long-term trend but bearish momentum emerging. Key resistance at $1.23 while support holds at $0.64 for critical trading decision.
Tezos (XTZ) Shows Mixed Signals as Price Hovers Near $0.75 Support
XTZ price trades at $0.75 with 1.88% gains, but technical indicators reveal conflicting signals as momentum weakens despite strong bullish trend classification.
XTZ Price Drops 3.34% to $0.74 Despite Strong Bullish Technical Setup
Tezos (XTZ) trades at $0.74 after a 3.34% decline, but technical indicators suggest potential reversal with RSI in neutral territory and price above key support levels.
XTZ Price Struggles at $0.83 Despite Strong Bullish Trend Classification
Tezos trades at $0.83 with mixed signals as XTZ RSI sits neutral at 56.75 while technical indicators show conflicting momentum despite overall bullish classification.
Tezos (XTZ) Price Struggles at $0.82 After Recent Volatility Spike
XTZ trades at $0.82 with -4.36% decline today, showing bearish momentum despite last week's 25% surge driven by DeFi activity and institutional interest.
Cryptocurrency Detective ZachXBT Uncovers Unusual ETH Withdrawals for MTG Cards
ZachXBT's analysis of cryptocurrency transactions involving the withdrawal of over 11,200 ETH, equivalent to $25 million, raises questions about the source and intent of these funds.
Are Zcash (ZEC) and Horizen (ZEN) Immune To The Ongoing Price Corrections?
Despite the huge loss in the crypto market today, Zcash and Horizen have come away as the top price gainers for today
ZRO Tests Lower Bollinger Band Support at $1.67 as Bearish MACD Signals Persist
LayerZero (ZRO) trades at $1.67, down 2.4% in 24 hours, testing crucial support levels amid bearish momentum signals and weak correlation with broader crypto markets.
ZRO Tests Lower Bollinger Band Support at $1.72 as Technical Indicators Signal Oversold Conditions
LayerZero (ZRO) trades at $1.72, up 1.24% daily, testing critical lower Bollinger Band support while RSI suggests oversold bounce potential amid quiet news cycle.
** LayerZero Price Action: ZRO Rebounds Above $2.25 Despite Recent Pullback as Foundation's Token Buyback Strategy Takes Effect
** ZRO price currently trades at $2.29, down 1.21% in 24 hours, but technical indicators suggest the recent LayerZero Foundation buyback announcement continues to support bullish momentum.
ZRO Price Surges 17% After LayerZero Foundation's 50M Token Buyback Announcement
ZRO currently trades at $2.30 with bullish momentum following LayerZero's massive token buyback, though daily correction shows -2.08% as traders take profits.
LayerZero (ZRO) Slides 9% to $2.02 Despite Recent Partnership Gains
ZRO price drops to $2.02 amid 9% daily decline, testing neutral RSI levels while traders weigh token unlock impact against Flare partnership momentum.
LayerZero (ZRO) Price Surges 14.73% as Foundation Announces Major Token Buyback
ZRO trades at $2.20 after a 14.73% rally following LayerZero Foundation's announcement of a 50 million token buyback, overcoming earlier unlock-related selling pressure.
LayerZero (ZRO) Price Surges 3% as Token Buyback Counters Unlock Concerns
ZRO price rebounds to $1.90 (+3.04%) following LayerZero Foundation's announcement of a 50M token buyback worth 5% of total supply, offsetting recent unlock pressure.
LayerZero (ZRO) Price Tests $2.00 Support as Token Unlock Creates Selling Pressure
ZRO trades at $2.00 (+1.22% daily) with neutral RSI at 51.49, but recent 25.71M token unlock may challenge current support levels in coming sessions.
LayerZero (ZRO) Consolidates Around $1.98 as Technical Indicators Signal Potential Breakout
ZRO price holds steady at $1.98 despite 1.44% decline, with RSI neutral at 50.58 and MACD showing bullish momentum as traders watch key resistance at $2.11.
LayerZero (ZRO) Faces Major Token Unlock as Bulls Fight for $2.00 Support
ZRO trades at $2.00 amid mixed signals as upcoming 25.71M token unlock threatens recent 40% rally gains. Technical indicators show neutral momentum.
LayerZero (ZRO) Price Surges 7.43% as Technical Indicators Signal Bullish Momentum
ZRO price hits $2.04 with strong 24-hour gains despite upcoming token unlock concerns. Technical analysis reveals bullish MACD crossover and RSI in neutral zone.
LayerZero (ZRO) Price Consolidates at $1.92 Amid Neutral Technical Signals
ZRO trades at $1.92 with mixed momentum indicators showing neutral RSI at 47.05 while bulls eye key resistance at $2.29 for potential breakout opportunity.
LayerZero (ZRO) Price Analysis: Neutral Signals Amid $1.92 Trading Range
ZRO trades at $1.92 with mixed technical signals. LayerZero shows neutral RSI but bullish MACD momentum as price tests key support levels.
LayerZero (ZRO) Price Analysis: Bulls Fight Back Despite 4.67% Daily Decline
ZRO price trades at $1.90 after a 4.67% drop, but MACD histogram shows bullish momentum emerging. Technical indicators suggest potential reversal as ZRO approaches key support.
LayerZero (ZRO) Price Retreats 4.46% as Technical Indicators Show Mixed Signals
ZRO trades at $1.99 after a 4.46% daily decline, with technical analysis revealing neutral RSI and bullish MACD momentum despite bearish price action.
LayerZero (ZRO) Breaks Above $2 After Ondo Finance Partnership - Bulls Target $2.29
ZRO price surged 4.27% to $2.07 as LayerZero's partnership with Ondo Finance for tokenized asset issuance drives adoption momentum amid bullish technical signals.
LayerZero (ZRO) Price Hovers at $1.99 as Technical Indicators Signal Mixed Momentum
ZRO trades at $1.99 after a 0.50% daily decline, with RSI in neutral territory and MACD showing early bullish divergence signals amid weak overall trend.
LayerZero (ZRO) Price Eyes $2.29 Resistance as Technical Indicators Show Mixed Signals
ZRO trades at $2.01 (+2.60%) with bullish MACD momentum but faces key resistance. Technical analysis reveals critical levels ahead for LayerZero traders.
LayerZero (ZRO) Hovers Near Support as Bulls Eye $2.29 Resistance
ZRO price trades at $1.95 after declining 1.26% in 24 hours, with technical indicators showing neutral momentum as traders watch key support at $1.77
LayerZero (ZRO) Tests $2 Resistance as Camp Network Integration Boosts Adoption
ZRO price climbs 4.85% to $1.97 as new omnichain partnerships strengthen LayerZero's technical foundation despite mixed signals from daily indicators.
ZRO Price Holds Above $1.88 Despite Mixed Technical Signals - LayerZero Analysis
LayerZero (ZRO) trades at $1.88 with +2.40% daily gains, but technical indicators show conflicting signals as ZRO RSI remains neutral at 46.40.
LayerZero (ZRO) Struggles Near $1.82 as Bearish Momentum Builds
ZRO price trades at $1.82 with bearish MACD signals and RSI showing neutral territory. Technical analysis reveals key support testing at $1.77 levels.
LayerZero (ZRO) Price Analysis: Consolidation Near $1.85 Despite Stargate Acquisition Boost
ZRO trades at $1.85 with neutral momentum as technical indicators suggest consolidation following the positive impact of LayerZero's $120M Stargate Finance acquisition.
LayerZero (ZRO) Tests Lower Support at $1.84 Amid Bearish Technical Signals
ZRO trades at $1.84 (-1.07%) near Bollinger Band support despite recent Stargate Finance acquisition boost. Technical indicators suggest neutral-to-bearish momentum ahead.
** LayerZero (ZRO) Price Analysis: $120M Stargate Acquisition Drives Weekly Gains Despite Neutral Signals
** ZRO trades at $1.88 with 5% weekly gains following LayerZero's $120M Stargate Finance acquisition, though technical indicators show mixed signals for traders.
LayerZero (ZRO) Hovers Near Support as Bearish Signals Intensify
ZRO trades at $1.87 with mixed signals as the token sits near Bollinger Band support while RSI remains neutral at 44.46, presenting a critical decision point for traders.
LayerZero (ZRO) Shows Mixed Signals After $120M Stargate Acquisition Despite Short-Term Decline
ZRO trades at $1.89 (-2.07% today) following LayerZero's major $120M Stargate Finance acquisition, presenting conflicting technical and fundamental signals for traders.
ZRO Price Hovers Near Support at $1.93 as LayerZero Shows Neutral Momentum
LayerZero (ZRO) trades at $1.93 with mixed technical signals as the token consolidates between key support and resistance levels on moderate volume.
LayerZero (ZRO) Tests Critical Support at $1.93 Amid Token Unlock Pressure
ZRO price trades at $1.93 (-2.23% today) as technical indicators flash neutral signals following the $120M Stargate acquisition and major token unlock event.
LayerZero (ZRO) Tests Support at $1.98 After Stargate Acquisition Rally Fades
ZRO price retreats to $1.98 (-1.59%) as post-acquisition momentum weakens. Technical indicators show neutral RSI at 48.30 with key support at $1.85.
LayerZero (ZRO) Struggles Below $2 After $58M Token Unlock Despite Stargate Acquisition
ZRO price holds at $1.98 (+1.12%) as traders weigh bullish Stargate merger against bearish pressure from 25.71M token unlock worth $58.36 million.
LayerZero (ZRO) Tests $2.06 Support as RSI Shows Neutral Zone Trading
ZRO price trades at $2.06 with -5.15% daily decline. Technical indicators show mixed signals as LayerZero's RSI sits neutral at 51.32 while MACD suggests emerging bullish momentum.
LayerZero (ZRO) Surges 4% as Stargate Merger Proposal Outweighs Token Unlock Concerns
ZRO price climbs to $2.18 (+3.96%) as LayerZero's $110M Stargate acquisition proposal drives bullish momentum despite upcoming $58M token unlock on August 20.
LayerZero (ZRO) Retreats 8.86% Despite $110M Stargate Acquisition Proposal
ZRO trades at $2.14 after an 8.86% daily decline, showing profit-taking following the major Stargate Finance acquisition announcement that initially drove 30% gains.
LayerZero (ZRO) Price Analysis: Bulls Face $2.60 Resistance After 11% Daily Drop
ZRO trades at $2.21 after an 11.05% decline, but technical indicators suggest bullish momentum may be building despite the current weakness.
LayerZero (ZRO) Surges 28% to $2.45 as Bulls Break Key Resistance
ZRO price explodes 28% to $2.45 with overbought RSI at 72, testing crucial $2.60 resistance after breaking above key moving averages in strong bullish momentum.
LayerZero (ZRO) Price Struggles at $1.91 Amid Airdrop Controversy and Token Unlock Pressure
ZRO trades at $1.91 after controversial airdrop mechanism sparked 22% selloff. Technical indicators show neutral momentum as token unlock pressure persists.
ZRO Price Rebounds 2.84% as LayerZero Technical Indicators Show Mixed Signals
ZRO trades at $1.92 with bullish MACD momentum despite community backlash over controversial airdrop mechanism and ongoing token unlock pressure affecting price action.
LayerZero (ZRO) Shows Modest Recovery Despite Bearish Technicals - ZRO Price Analysis
ZRO price climbs 3.85% to $1.81 but remains below key moving averages. Technical indicators suggest neutral momentum with critical support at $1.64.
LayerZero (ZRO) Trades Near Support at $1.75 as Token Unlock Pressure Persists
ZRO price holds $1.75 support despite bearish momentum from recent token unlock. Technical indicators suggest potential bounce or breakdown ahead.
LayerZero (ZRO) Price Analysis: Token Struggles Below Key Moving Averages Amid Bearish Momentum
ZRO price currently trades at $1.74, up 1.04% in 24h but faces resistance from declining moving averages while RSI signals potential oversold bounce ahead.
LayerZero (ZRO) Price Hovers Near $1.72 as Token Unlock Pressure Continues
ZRO trades at $1.72 (+1.18%) while technical indicators show oversold conditions following recent 25.71M token unlock that increased circulating supply by 23%.
LayerZero (ZRO) Price Hovers at $1.70 as Token Unlock Pressure Persists
ZRO trades at $1.70 with minimal 24h movement as selling pressure from July's major token unlock continues to weigh on price action despite technical oversold conditions.
LayerZero (ZRO) Price Struggles Near $1.74 as Token Unlock Pressure Persists
ZRO trades at $1.74 (-1.86%) while technical indicators show oversold conditions following recent token unlock that released 25.71M tokens into circulation.
LayerZero (ZRO) Price Struggles Despite Multiple Protocol Integrations
ZRO price trades at $1.87 (+2.13%) while technical indicators show mixed signals. Recent partnerships fail to lift token above key resistance levels.
ZRO Price Plunges 5% as LayerZero Tests Critical Support at $1.77
ZRO trades at $1.79 after a sharp 5% decline, with technical indicators showing bearish momentum as LayerZero approaches key support levels near Bollinger Band lows.
LayerZero (ZRO) Price Plunges 8.5% as Token Unlock Creates Oversold Conditions
ZRO trades at $1.91 after sharp decline, with technical indicators showing oversold signals while 25.71M token unlock continues pressuring markets despite a16z backing.
LayerZero (ZRO) Price Drops 8.5% as Technical Indicators Flash Warning Signals
ZRO trades at $1.86 after an 8.48% decline, with RSI at 39.89 suggesting oversold conditions while recent token unlock creates selling pressure.
LayerZero (ZRO) Rebounds 1.12% Despite Major Token Unlock Selling Pressure
ZRO price recovers to $1.98 after 25.7M token unlock caused selloff. Technical indicators show neutral signals with key support at $1.74 holding firm.
LayerZero (ZRO) Price Analysis: Neutral Territory at $1.95 as Technical Indicators Show Mixed Signals
ZRO price trades at $1.95 with 2.25% daily gains. Technical analysis reveals neutral RSI at 43.60 while MACD shows bearish momentum. Key resistance at $2.46.
LayerZero (ZRO) Price Drops 2.6% as Token Unlock Pressure Outweighs a16z Investment
ZRO trades at $1.93 after 25.71M token unlock creates selling pressure, overshadowing a16z's $55M investment signal. Technical indicators show mixed signals.
LayerZero (ZRO) Price Drops 2.75% as Token Unlock Weighs on Bullish Momentum
ZRO trades at $2.26 after declining 2.75% in 24 hours. Despite a16z's $55M investment boost, the recent 25.71M token unlock creates selling pressure for LayerZero.
LayerZero (ZRO) Breaks Above $2.30 as Bulls Target $2.42 Resistance
ZRO price surges 4.91% to $2.33 with bullish momentum building. Technical indicators suggest potential breakout above key resistance levels.
Uniswap Price Analysis - March 5,2021
From the 4h candlestick chart of Uniswap(UNI), an inverse hammer pattern with a long upper shadow line was formed and UNI touched $31.56 temporarily. What is to be expected of UNI in the upcoming days?
Uniswap (UNI) Price Analysis-March 19,2021
UNI is trading at $30.55, but it appears to be caught on a bearish trend. Currently, the bears are retesting the support level of $29.27.
Altcoin Price Analysis: XRP and AAVE
This piece analyzes the short-term price actions and momentum of XRP token and Aave protocol.
UNI, LINK, VET Price Analysis-March 9,2021
With Bitcoin breaking above its psychological barrier of 54K, altcoins have also rallied higher. Here is a more in-depth look at what's in store for Uniswap (UNI), Chainlink (LINK), and VeChain (VET) this week.
Polkadot (DOT) Price Analysis – March 23,2021
The bears occupy the main market, pushing the DOT/USD to the support line below the triangle line. What does this mean?
Bitcoin (BTC) Price Analysis – March 15,2021
Bitcoin (BTC) performed strongly in the past week, breaking through the previous high of $58,354. Bitcoin continued to rise, soaring to a new all-time high (ATH)of $61,781 on March 13. But it seems that Bitcoin has suffered strong selling interest near this level and the price has been corrected. At the time of writing, Bitcoin is trading at $60,157.82.
Jul 24 Trading Analysis: What Bloodbath?
Despite stonk's bloodbath, BTC managed to close higher on the day with some short squeeze liquidation through $9600 level. I am actually surprised that we are still trading at current levels, would only be a matter of time that we see us retracing back some of its gains, which was why I said yesterday, we need to continue to monitor the momentum of capital into BTC.